In the competitive landscape of industrial machinery, two companies stand out: Nordson Corporation (NDSN) and Kadant Inc. (KAI). Both firms operate within the same industry, focusing on innovative technologies and engineered systems that drive efficiency in manufacturing processes. Their strategies for growth and market penetration reveal fascinating insights into their operations. As we delve into this comparison, we aim to identify which company holds the most promise for investors like you.
Table of contents
Company Overview
Nordson Corporation Overview
Nordson Corporation, trading under the ticker NDSN, is a key player in the industrial machinery sector, with a market cap of approximately $13.37B. Founded in 1935 and based in Westlake, Ohio, Nordson specializes in the engineering, manufacturing, and marketing of systems for dispensing and controlling adhesives, coatings, and other fluids. The company operates through two main segments: Industrial Precision Solutions (IPS) and Advanced Technology Solutions (ATS). IPS focuses on automated dispensing systems and coating solutions, while ATS provides precision dispensing systems for medical and semiconductor applications. With a robust portfolio and a dedicated workforce of around 8,000 employees, Nordson aims to enhance productivity and efficiency across various industries.
Kadant Inc. Overview
Kadant Inc., represented by the ticker KAI, operates in a similar industrial machinery space, boasting a market cap of about $3.27B. Established in 1991 and headquartered in Westford, Massachusetts, Kadant supplies advanced technologies and engineered systems. The company segments its operations into Flow Control, Industrial Processing, and Material Handling. These segments encompass a diverse range of products, including fluid-handling systems, industrial automation solutions, and biodegradable absorbent materials. With around 3,500 employees, Kadant is dedicated to delivering innovative solutions that address the needs of its global customer base.
Key Similarities and Differences
Both Nordson and Kadant operate within the industrial machinery sector and focus on providing specialized solutions. However, Nordson emphasizes adhesive and coating technologies, while Kadant diversifies into fluid handling and material processing. This distinction in focus highlights their unique approaches to market demands, catering to different industrial needs.
Income Statement Comparison
The following table provides a comparison of the most recent income statements for Nordson Corporation (NDSN) and Kadant Inc. (KAI), highlighting their financial performance metrics.
| Metric | NDSN | KAI |
|---|---|---|
| Revenue | 2.69B | 1.05B |
| EBITDA | 810.58M | 222.69M |
| EBIT | 674.41M | 173.10M |
| Net Income | 467.28M | 111.60M |
| EPS | 8.17 | 9.51 |
Interpretation of Income Statement
In the most recent fiscal year, Nordson Corporation (NDSN) reported a revenue increase to 2.69B, compared to 2.63B in the previous year, indicating steady growth. Conversely, Kadant Inc. (KAI) also experienced revenue growth, rising to 1.05B from 957.67M. NDSN’s net income slightly decreased to 467.28M, while KAI’s net income increased to 111.60M. The stability in NDSN’s EBIT and EBITDA margins suggests effective cost management, whereas KAI’s margins improved, reflecting operational efficiency. Overall, both companies demonstrate resilience, but NDSN’s slight dip in net income warrants attention in future assessments.
Financial Ratios Comparison
The following table provides a comparative analysis of the most recent financial metrics for Nordson Corporation (NDSN) and Kadant Inc. (KAI). This will help us understand their financial health and operational efficiency.
| Metric | NDSN | KAI |
|---|---|---|
| ROE | 15.94% | 13.17% |
| ROIC | 9.65% | 10.08% |
| P/E | 30.56 | 36.90 |
| P/B | 4.87 | 4.86 |
| Current Ratio | 2.41 | 2.31 |
| Quick Ratio | 1.51 | 1.55 |
| D/E | 0.79 | 0.38 |
| Debt-to-Assets | 38.67% | 22.57% |
| Interest Coverage | 7.58 | 8.55 |
| Asset Turnover | 0.45 | 0.74 |
| Fixed Asset Turnover | 4.21 | 6.18 |
| Payout ratio | 34.55% | 13.15% |
| Dividend yield | 1.13% | 0.36% |
Interpretation of Financial Ratios
Both companies exhibit solid financial metrics, but NDSN’s higher P/E and D/E ratios suggest it may be perceived as more expensive and potentially riskier due to its leverage. KAI shows better asset utilization with a higher asset turnover ratio, indicating efficient operations. However, NDSN’s stronger current and quick ratios point to better liquidity management. Overall, both companies are strong contenders, but investors should weigh the risk factors before making investment decisions.
Dividend and Shareholder Returns
Nordson Corporation (NDSN) offers a dividend with a payout ratio of 34.5% and an annual yield of 1.13%. The company has consistently increased its dividends, supported by strong free cash flow. However, caution is warranted due to potential risks related to unsustainable distributions.
Kadant Inc. (KAI) pays a smaller dividend yield of 0.36% with a payout ratio of 13.1%, reflecting a focus on reinvestment for growth. Despite not paying substantial dividends, KAI engages in share buybacks, which may enhance shareholder value. Overall, both strategies indicate a commitment to long-term value creation.
Strategic Positioning
Nordson Corporation (NDSN) holds a strong market share in the industrial machinery sector, particularly in adhesive and coating systems, with a market cap of approximately 13.4B. Meanwhile, Kadant Inc. (KAI) focuses on fluid-handling technologies and engineered systems, boasting a market cap of around 3.3B. Both companies face competitive pressure from emerging technologies and established players, necessitating continuous innovation to mitigate the risks of technological disruption. As an investor, I would closely monitor their respective market positions and responses to these challenges.
Stock Comparison
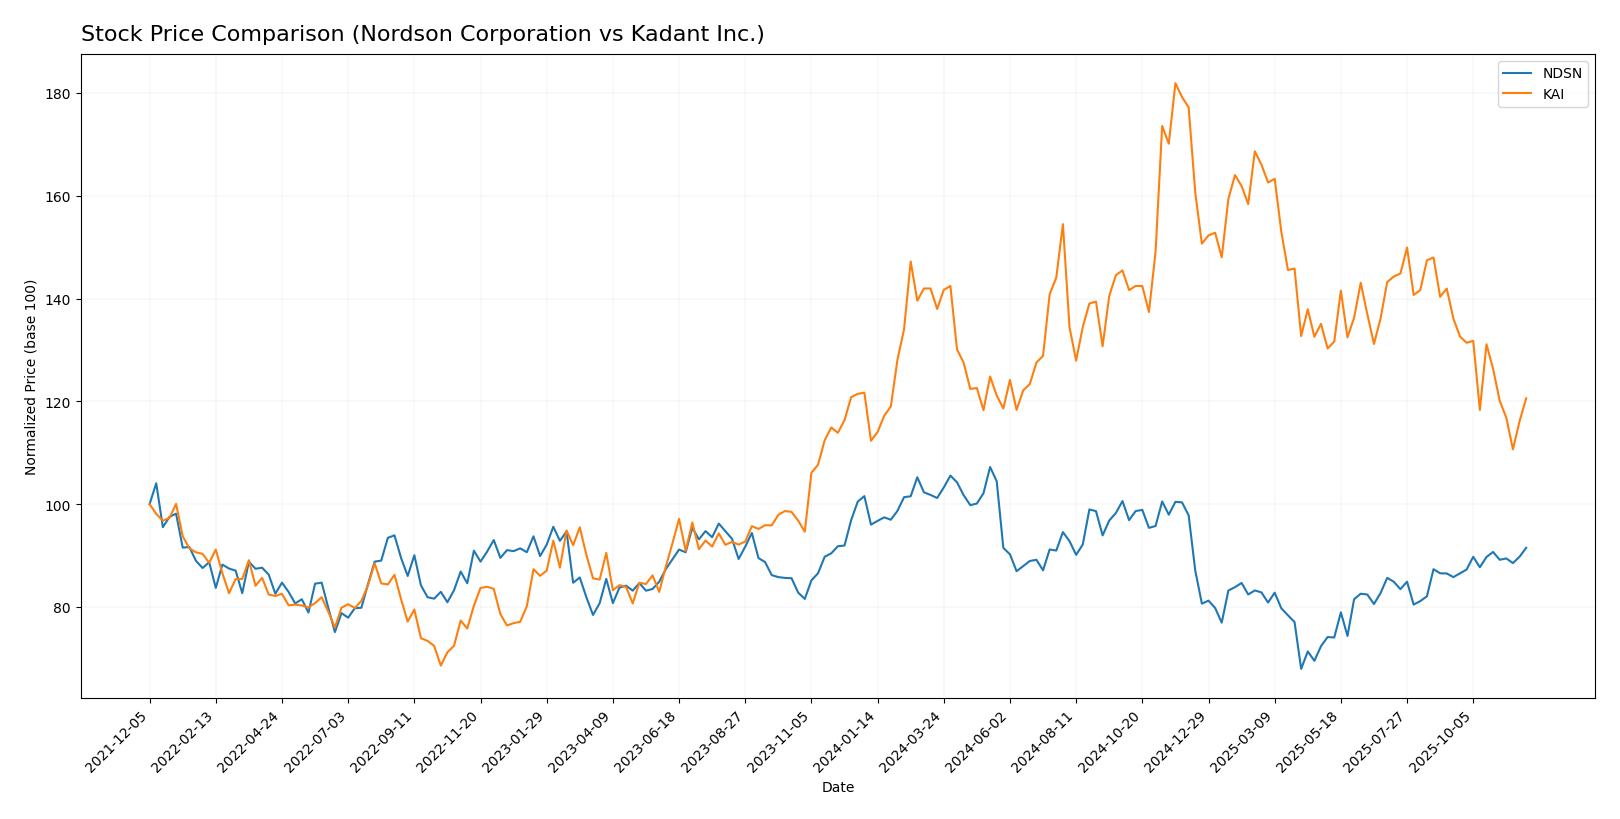
In this analysis, I will examine the stock price movements and trading dynamics of Nordson Corporation (NDSN) and Kadant Inc. (KAI) over the past year, highlighting key price changes and market sentiments.
Trend Analysis
Nordson Corporation (NDSN) Over the past year, NDSN has experienced a price change of -4.7%, indicating a bearish trend. This decline has been accompanied by notable volatility, with a standard deviation of 23.83. The stock reached a high of 278.89 and a low of 176.73 during this period. The trend shows signs of acceleration, suggesting that the downward movement may continue in the near term.
Recent Performance: From September 14, 2025, to November 30, 2025, NDSN’s price increased by 6.65%, with a lower standard deviation of 4.23, indicating reduced volatility. The trend slope during this recent period is positive at 0.95, suggesting a potential short-term recovery.
Kadant Inc. (KAI) In contrast, KAI has recorded a price change of +7.36% over the past year, reflecting a bullish trend. However, this overall trend shows signs of deceleration, with a standard deviation of 35.6. The stock’s price fluctuated between a high of 419.01 and a low of 254.91.
Recent Performance: Analyzing the period from September 14, 2025, to November 30, 2025, KAI’s price has unfortunately decreased by 11.4%. The standard deviation during this recent period is 18.1, suggesting moderate volatility. The trend slope is negative at -4.34, indicating a decline in momentum for KAI.
In summary, while NDSN is currently in a bearish trend with a potential for short-term recovery, KAI has shown a bullish trend over the past year but is experiencing recent declines. Investors should consider these dynamics carefully when making portfolio decisions.
Analyst Opinions
Recent analyst recommendations for both Nordson Corporation (NDSN) and Kadant Inc. (KAI) indicate a consensus rating of “B+”, suggesting a hold position. Analysts highlight strong performance metrics, particularly in return on equity and assets, as key strengths for both companies. The discounted cash flow analysis supports the positive outlook, although concerns about their price-to-earnings ratios persist. Analysts recommend monitoring these stocks for potential growth, but caution against aggressive buying without further market clarity. Overall, the sentiment remains cautiously optimistic for 2025.
Stock Grades
I have gathered the latest stock grades from recognized grading companies for Nordson Corporation (NDSN) and Kadant Inc. (KAI). Here’s the analysis:
Nordson Corporation Grades
| Grading Company | Action | New Grade | Date |
|---|---|---|---|
| Oppenheimer | maintain | Outperform | 2025-08-25 |
| Baird | maintain | Neutral | 2025-08-22 |
| Keybanc | maintain | Overweight | 2025-07-15 |
| Oppenheimer | upgrade | Outperform | 2025-05-30 |
| Baird | maintain | Neutral | 2025-05-30 |
| Keybanc | maintain | Overweight | 2025-04-08 |
| Keybanc | upgrade | Overweight | 2025-03-04 |
| Baird | maintain | Neutral | 2025-02-21 |
| Loop Capital | upgrade | Buy | 2025-01-22 |
| Seaport Global | upgrade | Buy | 2024-12-17 |
Kadant Inc. Grades
| Grading Company | Action | New Grade | Date |
|---|---|---|---|
| Barrington Research | maintain | Outperform | 2025-10-30 |
| Barrington Research | maintain | Outperform | 2025-10-29 |
| Barrington Research | maintain | Outperform | 2025-10-27 |
| Barrington Research | maintain | Outperform | 2025-10-10 |
| Barrington Research | maintain | Outperform | 2025-09-23 |
| DA Davidson | maintain | Neutral | 2025-08-04 |
| Barrington Research | maintain | Outperform | 2025-07-30 |
| Barrington Research | maintain | Outperform | 2025-07-29 |
| Barrington Research | maintain | Outperform | 2025-05-01 |
| DA Davidson | maintain | Neutral | 2025-05-01 |
Overall, both companies have maintained strong grades, particularly Nordson Corporation, which shows a positive trend with multiple upgrades, while Kadant Inc. consistently receives an “Outperform” rating from Barrington Research. This suggests a robust investor sentiment towards these stocks, but I advise monitoring market conditions and company performance closely.
Target Prices
Analysts have provided reliable target prices for both Nordson Corporation (NDSN) and Kadant Inc. (KAI), indicating their expectations for future performance.
| Company | Target High | Target Low | Consensus |
|---|---|---|---|
| Nordson Corporation (NDSN) | 285 | 240 | 263 |
| Kadant Inc. (KAI) | 410 | 275 | 342.5 |
The consensus target prices for NDSN and KAI suggest a positive outlook, with both companies projected to exceed their current stock prices of 238 and 277.79, respectively. This indicates potential upside based on analyst expectations.
Strengths and Weaknesses
The following table summarizes the strengths and weaknesses of Nordson Corporation (NDSN) and Kadant Inc. (KAI), based on the most recent financial data.
| Criterion | Nordson Corporation (NDSN) | Kadant Inc. (KAI) |
|---|---|---|
| Diversification | High | Moderate |
| Profitability | Strong (Net Margin: 17.37%) | Moderate (Net Margin: 10.59%) |
| Innovation | High | Moderate |
| Global presence | Strong | Moderate |
| Market Share | Stable | Growing |
| Debt level | Moderate (Debt/Equity: 0.79) | Low (Debt/Equity: 0.38) |
In conclusion, Nordson demonstrates strong profitability and innovation, making it a robust player in its industry. On the other hand, Kadant presents a lower debt level and is expanding its market share, which may appeal to more risk-averse investors.
Risk Analysis
The following table outlines the key risks associated with Nordson Corporation (NDSN) and Kadant Inc. (KAI) as of the latest available data.
| Metric | Nordson Corporation (NDSN) | Kadant Inc. (KAI) |
|---|---|---|
| Market Risk | Moderate | High |
| Regulatory Risk | Low | Moderate |
| Operational Risk | Moderate | Moderate |
| Environmental Risk | Moderate | Low |
| Geopolitical Risk | High | Moderate |
In assessing risks, market volatility poses a significant threat to both companies, especially given their reliance on global demand. Recent geopolitical tensions have heightened the market risk, particularly for NDSN, which has a broader international exposure. Effective risk management strategies are essential.
Which one to choose?
When comparing Nordson Corporation (NDSN) and Kadant Inc. (KAI), both companies exhibit solid fundamentals, reflected in their respective profit margins and return metrics. NDSN has a net profit margin of 17.37% and a return on equity of 15.94%, while KAI shows a lower net profit margin of 10.59% but a higher return on equity of 13.17%. Stock trends indicate a bearish sentiment for NDSN, with a price change of -4.7%, while KAI shows a bullish trend with a price increase of 7.36%. Analysts rate both companies equally at B+, indicating similar growth potential and stability.
For growth-oriented investors, KAI appears to have a superior market trend, whereas those seeking stability may lean towards NDSN due to its robust financial metrics. However, both face risks related to market competition and economic fluctuations.
Disclaimer: This article is not financial advice. Each investor is responsible for their own investment decisions.
Go further
I encourage you to read the complete analyses of Nordson Corporation and Kadant Inc. to enhance your investment decisions: