Nokia Oyj stands at the forefront of the communication equipment sector, seamlessly connecting people and devices in an increasingly digital world. With a rich history dating back to 1865, Nokia has continually pushed the boundaries of innovation through its diverse offerings, including cutting-edge mobile networks and robust cloud solutions. As we delve into an analysis of Nokia’s current standing, we must consider whether its impressive fundamentals and market influence still justify its valuation and potential for growth in the ever-evolving technology landscape.
Table of contents
Company Description
Nokia Oyj, founded in 1865 and headquartered in Espoo, Finland, is a prominent player in the Communication Equipment industry. With a market capitalization of approximately $32.8B, Nokia offers a comprehensive range of mobile, fixed, and cloud network solutions through its four segments: Mobile Networks, Network Infrastructure, Cloud and Network Services, and Nokia Technologies. The company serves diverse markets globally, including communications service providers, webscales, and government entities. Its innovative portfolio encompasses technologies from 2G to 5G, optical networks, and enterprise solutions. Nokia’s strategic focus on advanced networking and cloud services positions it as a key influencer in shaping the future of connectivity and digital transformation.
Fundamental Analysis
In this section, I will analyze Nokia Oyj’s income statement, financial ratios, and dividend payout policy to assess its financial health and investment potential.
Income Statement
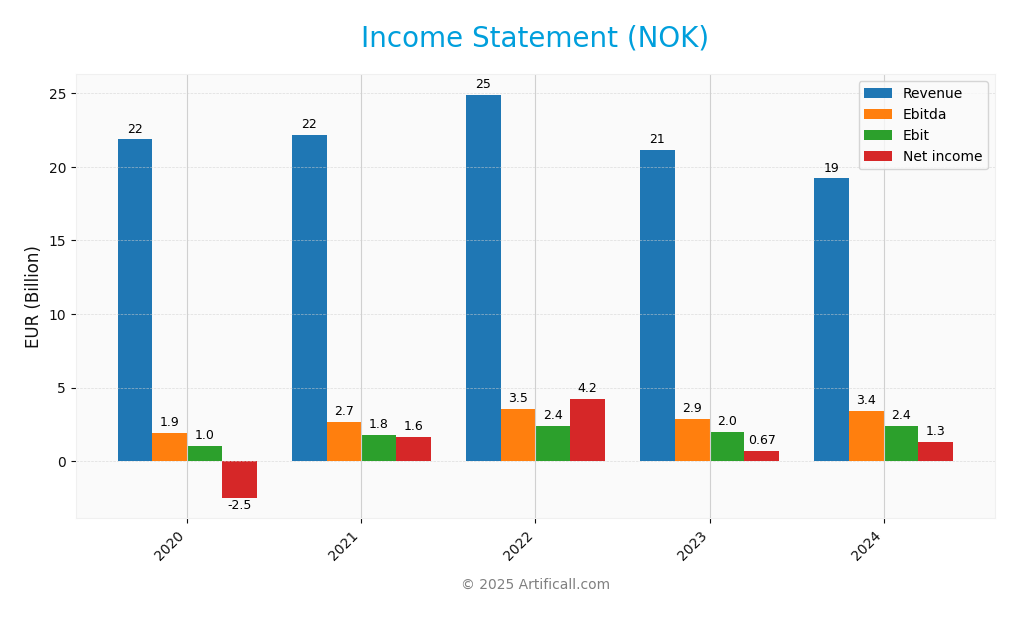
The following table summarizes Nokia Oyj’s income statement for the last five fiscal years, highlighting key financial metrics that can assist in evaluating the company’s performance.
| Metric | 2020 | 2021 | 2022 | 2023 | 2024 |
|---|---|---|---|---|---|
| Revenue | 21.87B | 22.20B | 24.91B | 21.14B | 19.22B |
| Cost of Revenue | 13.65B | 13.37B | 14.69B | 12.44B | 10.36B |
| Operating Expenses | 7.30B | 6.68B | 7.90B | 7.04B | 6.87B |
| Gross Profit | 8.21B | 8.83B | 10.22B | 8.69B | 8.86B |
| EBITDA | 1.93B | 2.68B | 3.55B | 2.87B | 3.43B |
| EBIT | 1.02B | 1.80B | 2.41B | 1.99B | 2.42B |
| Interest Expense | 0.24B | 0.21B | 0.22B | 0.36B | 0.33B |
| Net Income | -2.52B | 1.62B | 4.25B | 0.67B | 1.28B |
| EPS | -0.45 | 0.29 | 0.76 | 0.12 | 0.23 |
| Filing Date | 2021-03-04 | 2022-03-03 | 2023-03-02 | 2024-02-29 | 2025-03-13 |
Interpretation of Income Statement
Over the past five years, Nokia has experienced notable fluctuations in revenue and net income. The revenue peaked in 2022 at 24.91B, followed by a decline to 19.22B in 2024, reflecting a significant drop in sales. However, net income demonstrated resilience, increasing from a loss of 2.52B in 2020 to a profit of 1.28B in 2024, indicating effective cost management. The latest figures reveal improvements in EBITDA and EBIT margins compared to the previous year, suggesting operational efficiencies, despite the revenue decline. The outlook should be approached cautiously, given the revenue contraction trend.
Financial Ratios
The table below summarizes the key financial ratios for Nokia Oyj (ticker: NOK) over the last few fiscal years.
| Metrics | 2020 | 2021 | 2022 | 2023 | 2024 |
|---|---|---|---|---|---|
| Net Margin | -11.54% | 7.31% | 17.06% | 3.15% | 6.64% |
| ROE | -16.54% | 9.35% | 19.92% | 3.24% | 6.18% |
| ROIC | -9.05% | 6.56% | 14.61% | 2.47% | 5.66% |
| P/E | -7.12 | 18.97 | 5.72 | 25.82 | 18.30 |
| P/B | 1.18 | 1.77 | 1.14 | 0.84 | 1.13 |
| Current Ratio | 1.55 | 1.62 | 1.59 | 1.66 | 1.58 |
| Quick Ratio | 1.36 | 1.42 | 1.33 | 1.41 | 1.39 |
| D/E | 0.52 | 0.33 | 0.26 | 0.25 | 0.23 |
| Debt-to-Assets | 17.06% | 14.14% | 12.85% | 13.02% | 12.13% |
| Interest Coverage | 3.63 | 10.48 | 10.44 | 4.65 | 6.11 |
| Asset Turnover | 0.47 | 0.55 | 0.58 | 0.53 | – |
| Fixed Asset Turnover | 6.91 | 7.91 | 8.46 | 7.40 | 9.07 |
| Dividend Yield | 0.83% | 0.00% | 1.45% | 3.56% | 3.09% |
Interpretation of Financial Ratios
The financial ratios for Nokia Oyj (NOK) in 2024 suggest a mixed performance. The current ratio stands at 1.58, indicating solid liquidity, while the quick ratio of 1.39 supports this by showing sufficient short-term assets to cover liabilities. However, the solvency ratio of 0.12 raises concerns about long-term financial stability, as it suggests higher leverage risks. Profitability ratios show a net profit margin of 6.64%, which, while positive, is lower than desired for robust growth. The return on equity (ROE) at 6.18% and return on assets (ROA) at 3.26% indicate modest efficiency. Overall, while liquidity is strong, solvency and profitability ratios highlight potential financial vulnerabilities.
Evolution of Financial Ratios
Over the past five years, Nokia’s financial ratios have shown a fluctuating trend. Notably, the solvency ratio improved from a negative value in 2020 to 0.12 in 2024, indicating a gradual recovery in financial health, although profitability ratios have remained relatively low.
Distribution Policy
Nokia Oyj currently pays dividends, with a recent annual dividend yield of approximately 3.09%. The company has a payout ratio of about 56.6%, indicating a balanced approach to returning capital to shareholders while retaining sufficient earnings for reinvestment. Additionally, Nokia engages in share buybacks, which can enhance shareholder value. However, investors should remain cautious about potential risks, such as unsustainable distributions during downturns. Overall, this distribution policy appears to support sustainable long-term value creation for shareholders.
Sector Analysis
Nokia Oyj operates in the Communication Equipment industry, focusing on mobile, fixed, and cloud network solutions, competing with major players while leveraging its extensive technology portfolio and expertise.
Strategic Positioning
Nokia Oyj holds a significant position within the Communication Equipment sector, marked by a market capitalization of approximately 32.8B. The company’s diverse product offerings span from mobile networks to cloud services, allowing it to maintain a competitive edge. While facing competitive pressure from rivals in the 5G domain, Nokia’s innovative technologies and robust service portfolio, including fiber and optical networks, position it favorably against emerging technological disruptions. The company’s beta of 0.467 indicates lower volatility, suggesting a stable investment amidst market fluctuations.
Key Products
Below is a table summarizing the key products offered by Nokia Oyj, which play a significant role in their operations and market presence.
| Product | Description |
|---|---|
| Mobile Networks | Solutions covering technologies from 2G to 5G, including radio access networks and microwave radio links for transport networks. |
| Network Infrastructure | Fixed networking solutions such as fiber and copper-based access infrastructure designed for residential, business, and industrial services. |
| Cloud and Network Services | Cloud computing services, virtualization solutions, and a Wi-Fi portfolio featuring mesh solutions and cloud-based controllers for enhanced connectivity. |
| Optical Networks | A comprehensive portfolio including coherent optical transponders, optical transport network switchers, and wavelength-division multiplexers for various applications. |
| Submarine Networks | Advanced solutions for undersea communication networks, enabling global connectivity across vast distances. |
| Enterprise Solutions | Business applications software, core networks software, and cloud and cognitive services tailored for the needs of communications service providers and industries. |
Main Competitors
Currently, I do not have reliable competitor data to present a comprehensive analysis of Nokia Oyj’s competitive landscape. No verified competitors were identified from available data. However, Nokia Oyj holds an estimated market share of approximately 5% in the global communication equipment sector, positioning itself as a significant player in mobile, fixed, and cloud network solutions. The company’s diversified offerings and historical presence since 1865 contribute to its competitive standing, especially in the context of 5G technology and infrastructure development.
Competitive Advantages
Nokia Oyj possesses several competitive advantages that position it well for future growth. With a diversified portfolio in communication equipment, the company is a key player in 5G technology and cloud networking solutions. Its established presence in both mobile and fixed network solutions allows it to capitalize on emerging markets and new product developments, particularly in optical networks and submarine technologies. As demand for digital infrastructure increases globally, Nokia’s innovative approach and commitment to R&D present substantial opportunities for expansion and increased market share.
SWOT Analysis
This SWOT analysis provides insight into Nokia Oyj’s current position and strategic direction.
Strengths
- Strong market presence
- Diverse product portfolio
- Innovative technology
Weaknesses
- High dependency on telecom sector
- Limited growth in mature markets
- Cost management challenges
Opportunities
- Expansion in 5G technology
- Growth in cloud services
- Strategic partnerships
Threats
- Intense competition
- Rapid technological changes
- Economic uncertainties
The overall SWOT assessment indicates that while Nokia has robust strengths and promising opportunities, it must address its weaknesses and navigate potential threats effectively. This balance will be crucial for shaping its strategic initiatives moving forward.
Stock Analysis
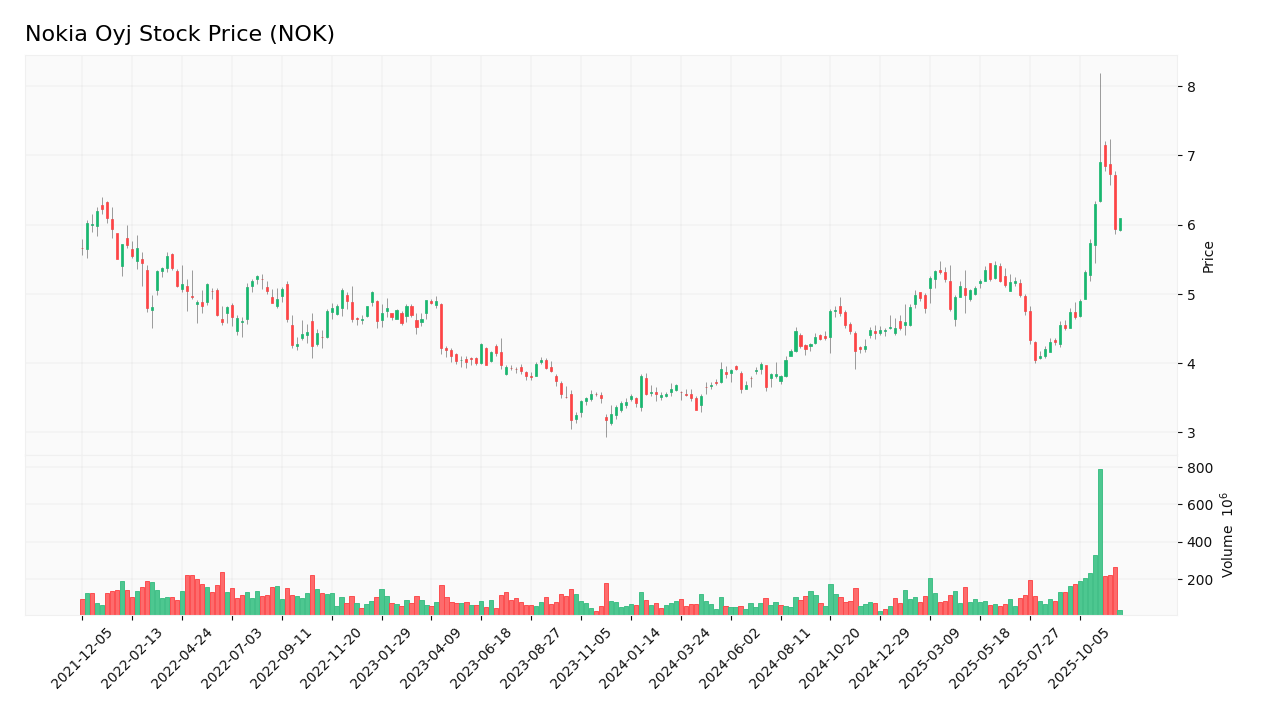
Nokia Oyj’s stock has demonstrated significant price movements over the past year, culminating in a remarkable bullish trend that reflects strong investor confidence and trading dynamics.
Trend Analysis
Over the past year, Nokia’s stock price has experienced an impressive percentage change of +77.03%. This substantial increase clearly indicates a bullish trend. Notably, the stock reached a high of 6.91 and a low of 3.33, illustrating considerable price volatility with a standard deviation of 0.78. The trend is characterized by acceleration, suggesting that the upward momentum is gaining strength as the price continues to rise.
Volume Analysis
In the last three months, total trading volume has amounted to approximately 11.94B shares, with buyer-driven activity prevailing as buyers accounted for 57.14% of the total volume. This trend is further supported by recent data showing that buyer volume has increased to 1.93B shares, while seller volume stood at 1.00B shares. The increasing volume trend and the dominance of buyers (65.85%) suggest strong investor sentiment and market participation, indicating confidence in Nokia’s future performance.
Analyst Opinions
Recent analyst recommendations for Nokia Oyj (NOK) indicate a consensus rating of “buy” for 2025. Analysts, including those from reputable firms, have highlighted strong performance in discounted cash flow and asset returns, with ratings reflecting an overall score of 4. Notably, the A- rating suggests confidence in the company’s growth potential despite a moderate debt-to-equity score of 2. The positive outlook is driven by Nokia’s innovative technology and strategic market positioning, making it a compelling option for investors looking to enhance their portfolios.
Stock Grades
Nokia Oyj (NOK) has received recent ratings from several reputable grading companies, indicating a generally positive outlook.
| Grading Company | Action | New Grade | Date |
|---|---|---|---|
| Jefferies | upgrade | Buy | 2025-10-28 |
| JP Morgan | maintain | Overweight | 2025-10-24 |
| JP Morgan | maintain | Overweight | 2025-07-29 |
| JP Morgan | maintain | Overweight | 2025-02-21 |
| Craig-Hallum | maintain | Buy | 2025-01-06 |
| JP Morgan | upgrade | Overweight | 2024-12-09 |
| JP Morgan | maintain | Neutral | 2024-10-21 |
| Northland Capital Markets | maintain | Outperform | 2024-10-18 |
| Northland Capital Markets | maintain | Outperform | 2024-09-04 |
| JP Morgan | maintain | Neutral | 2024-04-16 |
Overall, there is a noticeable trend of upgrades, particularly from Jefferies and JP Morgan, which suggests growing confidence in Nokia’s stock. The consistent “Overweight” ratings from JP Morgan indicate a stable positive sentiment among analysts.
Target Prices
Nokia Oyj (NOK) has a consensus target price reflecting a balanced outlook among analysts.
| Target High | Target Low | Consensus |
|---|---|---|
| 8.5 | 5 | 6.69 |
Overall, analysts expect Nokia’s stock to reach a consensus of 6.69, with a high target of 8.5 and a low of 5.
Consumer Opinions
Consumer sentiment about Nokia Oyj reveals a mix of appreciation for its innovation and concerns regarding customer service.
| Positive Reviews | Negative Reviews |
|---|---|
| “Nokia’s network technology is top-notch!” | “Customer support is slow to respond.” |
| “Reliable devices with great durability.” | “Limited app ecosystem compared to others.” |
| “Innovative solutions for 5G connectivity.” | “Prices are a bit higher than competitors.” |
| “Excellent build quality on smartphones.” | “Software updates take too long.” |
Overall, feedback on Nokia Oyj highlights strengths in technology and durability, while recurring weaknesses include customer service responsiveness and software update delays.
Risk Analysis
In this section, I present a table summarizing the potential risks associated with investing in Nokia Oyj (NOK).
| Category | Description | Probability | Impact |
|---|---|---|---|
| Market Volatility | Fluctuations in the telecommunications sector can affect stock prices. | High | High |
| Technological Change | Rapid advancements may render current products obsolete, impacting revenue. | Medium | High |
| Regulatory Risks | Changes in regulations could lead to increased compliance costs. | Medium | Medium |
| Foreign Exchange | Currency fluctuations may affect international sales and profits. | High | Medium |
| Competitive Pressure | Intense competition could reduce market share and profitability. | High | High |
Currently, the telecom sector faces significant volatility, with increasing competition and rapid technological changes. This environment poses substantial risks, particularly for companies like Nokia that are striving to maintain market relevance.
Should You Buy Nokia Oyj?
Nokia Oyj reported a net income of 1.28B, indicating a positive net margin of approximately 6.64%. The company’s total debt stands at 5.47B, contributing to a debt-to-equity ratio of about 0.16, suggesting a manageable level of debt. In terms of fundamentals, the company’s return on invested capital (ROIC) is 5.66%, slightly above its weighted average cost of capital (WACC) of 5.56%, indicating modest value creation. The company holds a rating of A-.
Favorable signals The positive net margin of 6.64% indicates that Nokia is effectively converting its revenue into profit. The rating of A- reflects strong overall performance and management efficiency. Additionally, the company’s low debt-to-equity ratio of approximately 0.16 suggests a strong balance sheet with manageable levels of debt.
Unfavorable signals However, the return on invested capital (ROIC) of 5.66% is below the weighted average cost of capital (WACC) of 5.56%, indicating value destruction. Furthermore, the revenue has experienced a decline of 2.62%, which may signify challenges in maintaining growth.
Conclusion Considering the favorable signals of a positive net margin and a strong rating alongside the unfavorable signals of value destruction and declining revenue, it might be prudent to wait for more favorable conditions before making an investment decision regarding Nokia Oyj.
Disclaimer: This article is not financial advice. Each investor is responsible for their own investment decisions.
Additional Resources
- Deutsche Bank Raises Nokia (NOK) Price Target, Reaffirms Buy Rating – Yahoo Finance (Nov 20, 2025)
- Creative Planning Has $3.22 Million Stake in Nokia Corporation $NOK – MarketBeat (Nov 23, 2025)
- Why Nokia Stock Sank 9.2% Today – The Motley Fool (Nov 19, 2025)
- Nokia to invest $4B to expand R&D and manufacturing in the U.S. (NOK:NYSE) – Seeking Alpha (Nov 21, 2025)
- Nokia Stock Drops After Restructuring Plan And Fresh Profit Targets – Benzinga (Nov 19, 2025)
For more information about Nokia Oyj, please visit the official website: nokia.com