In the fast-evolving semiconductor industry, two players stand out: Lam Research Corporation (LRCX) and Nova Ltd. (NVMI). Both companies are crucial in the manufacturing of semiconductor processing equipment, focusing on innovation and precision. While Lam Research specializes in complex fabrication systems, Nova excels in metrology solutions for process control. This comparison aims to uncover which of these companies presents a more compelling investment opportunity. Let’s dive in and see which company might be the better fit for your portfolio.

Table of contents
Company Overview
Lam Research Corporation Overview
Lam Research Corporation (LRCX) is a leading provider of semiconductor processing equipment, specializing in the fabrication of integrated circuits. Founded in 1980 and headquartered in Fremont, California, Lam designs, manufactures, and services advanced systems crucial for semiconductor production. Their product range includes technologies for deposition, etching, and cleaning processes, which are essential for producing high-performance semiconductors. With a market cap of approximately $197B, Lam’s innovations cater to major semiconductor manufacturers globally, making it a pivotal player in the technology sector. The company’s commitment to research and development positions it at the forefront of industry advancements.
Nova Ltd. Overview
Nova Ltd. (NVMI) specializes in process control systems for the semiconductor manufacturing industry. Established in 1993 and based in Rehovot, Israel, Nova’s offerings focus on metrology platforms that ensure precision throughout various semiconductor production stages, including lithography and deposition. With a market cap of around $9.16B, Nova serves a diverse clientele, including logic and memory manufacturers, highlighting its integral role in enhancing manufacturing efficiency and product quality. The company is recognized for its innovative solutions and robust growth trajectory, which are crucial in today’s fast-evolving tech landscape.
Key similarities between Lam Research and Nova Ltd. include their focus on the semiconductor industry and their roles in enhancing manufacturing processes. However, they differ significantly in their product offerings; Lam emphasizes equipment for fabrication, while Nova specializes in metrology and process control solutions. This distinction defines their respective market positioning and customer bases.
Income Statement Comparison
The following table compares the most recent income statements of Lam Research Corporation (LRCX) and Nova Ltd. (NVMI) to highlight their financial performance.
| Metric | LRCX | NVMI |
|---|---|---|
| Revenue | 18.44B | 672.40M |
| EBITDA | 6.34B | 204.92M |
| EBIT | 5.96B | 187.54M |
| Net Income | 5.36B | 183.76M |
| EPS | 4.17 | 6.31 |
Interpretation of Income Statement
In the most recent fiscal year, Lam Research Corporation exhibited robust revenue growth, increasing from 14.91B in 2024 to 18.44B in 2025, resulting in a solid net income of 5.36B. Meanwhile, Nova Ltd. showed a revenue increase from 517.92M in 2023 to 672.40M in 2024, with net income rising to 183.76M. LRCX’s EBITDA margin improved, reflecting effective cost management, while NVMI maintained stable margins with slight increases in both revenue and net income. Overall, LRCX’s performance indicates a strong market position, whereas NVMI is gradually enhancing its profitability.
Financial Ratios Comparison
The following table presents a comparative analysis of the most recent financial ratios for Lam Research Corporation (LRCX) and Nova Ltd. (NVMI).
| Metric | LRCX | NVMI |
|---|---|---|
| ROE | 54.33% | 19.81% |
| ROIC | 33.99% | 13.39% |
| P/E | 23.36 | 31.20 |
| P/B | 12.69 | 6.18 |
| Current Ratio | 2.21 | 2.32 |
| Quick Ratio | 1.55 | 1.92 |
| D/E | 0.48 | 0.25 |
| Debt-to-Assets | 22.28% | 16.98% |
| Interest Coverage | 33.11 | 116.20 |
| Asset Turnover | 0.86 | 0.48 |
| Fixed Asset Turnover | 7.59 | 5.06 |
| Payout ratio | 21.45% | 0% |
| Dividend yield | 0.92% | 0% |
Interpretation of Financial Ratios
Lam Research Corporation exhibits stronger profitability metrics with a notably higher ROE and ROIC compared to Nova Ltd. However, NVMI benefits from lower leverage (D/E ratio) and an impressive interest coverage ratio, indicating a robust capacity to manage debt. LRCX’s higher P/E ratio suggests that it is more highly valued relative to earnings, which may indicate market confidence but could also imply higher risk if growth expectations are not met. Overall, while LRCX shows superior returns, NVMI’s risk management ratios warrant attention.
Dividend and Shareholder Returns
Lam Research Corporation (LRCX) pays dividends, with a recent yield of 0.9% and a payout ratio of 21.5%. The dividend trend has been stable, supported by strong free cash flow. In contrast, Nova Ltd. (NVMI) does not pay dividends, opting to reinvest earnings into growth initiatives. Although NVMI lacks dividend distributions, they engage in share buybacks, reflecting a commitment to enhancing shareholder value. Overall, LRCX’s approach supports sustainable long-term value, while NVMI’s strategy aligns with aggressive growth prospects.
Strategic Positioning
In the semiconductor equipment market, Lam Research Corporation (LRCX) holds a significant market share, leveraging its extensive product range for wafer fabrication. With a market cap of $197B and a competitive edge in advanced processing technology, it faces pressure from smaller players like Nova Ltd. (NVMI), which, despite a market cap of $9B, specializes in metrology systems. Both companies are navigating potential technological disruptions that could reshape the industry landscape, necessitating vigilant risk management strategies.
Stock Comparison
In the past year, both Lam Research Corporation (LRCX) and Nova Ltd. (NVMI) have exhibited significant price movements, showcasing distinct trading dynamics that merit careful analysis.
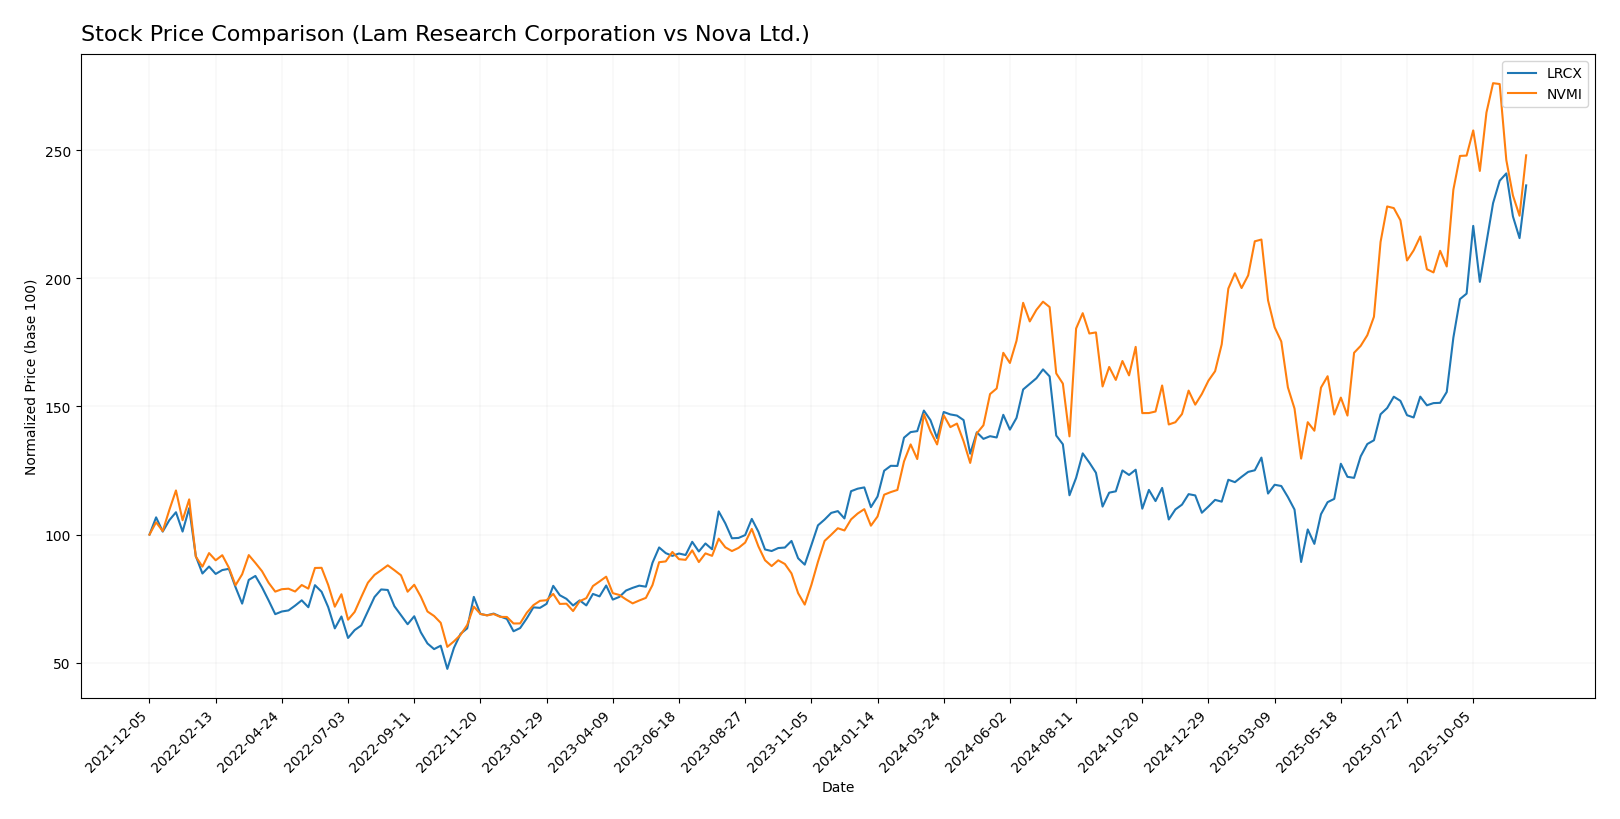
Trend Analysis
Lam Research Corporation (LRCX) Over the past year, LRCX has experienced a remarkable price change of +113.35%, indicating a bullish trend. The stock has shown acceleration in its upward movement, with notable highs at $159.35 and lows at $59.09. The volatility measured by a standard deviation of 21.54 suggests some fluctuations; however, overall sentiment remains positive.
In the recent trend analysis from September 14, 2025, to November 30, 2025, LRCX’s price increased by 33.6%, with a standard deviation of 13.05, reinforcing the stock’s strong bullish sentiment.
Nova Ltd. (NVMI) NVMI has also demonstrated strength with an impressive price change of +139.63% over the past year, firmly establishing a bullish trend. However, the trend shows signs of deceleration, as indicated by a recent price increase of only 5.73% from September 14, 2025, to November 30, 2025. The stock reached a high of $345.06 and a low of $129.32, with a higher volatility reflected in a standard deviation of 48.46.
Overall, while NVMI remains bullish, the deceleration in its recent trend could imply a period of consolidation ahead. Both companies exhibit strong buyer dominance in their trading volumes, with LRCX having a buyer percentage of 58.52% and NVMI at 55.75%.
Analyst Opinions
Recent analyst recommendations for Lam Research Corporation (LRCX) and Nova Ltd. (NVMI) indicate a consensus rating of “B+” for both companies. Analysts argue that LRCX benefits from strong return on equity and assets, though it shows some weakness in debt-to-equity and price-to-earnings ratios. Similarly, NVMI demonstrates solid performance metrics, especially in return on assets, but also faces challenges in valuation ratios. Given these insights, I maintain a cautious outlook, favoring a hold position for 2025.
Stock Grades
In this section, I will provide you with the latest stock grades from recognized grading companies for two companies: Lam Research Corporation (LRCX) and Nova Ltd. (NVMI).
Lam Research Corporation Grades
| Grading Company | Action | New Grade | Date |
|---|---|---|---|
| Citigroup | maintain | Buy | 2025-11-12 |
| UBS | maintain | Buy | 2025-10-23 |
| Morgan Stanley | maintain | Equal Weight | 2025-10-23 |
| Stifel | maintain | Buy | 2025-10-23 |
| Susquehanna | maintain | Positive | 2025-10-23 |
| B. Riley Securities | maintain | Buy | 2025-10-23 |
| Mizuho | maintain | Outperform | 2025-10-23 |
| Citigroup | maintain | Buy | 2025-10-23 |
| JP Morgan | maintain | Overweight | 2025-10-23 |
| Oppenheimer | maintain | Outperform | 2025-10-23 |
Nova Ltd. Grades
| Grading Company | Action | New Grade | Date |
|---|---|---|---|
| Evercore ISI Group | maintain | Outperform | 2025-11-07 |
| Benchmark | maintain | Buy | 2025-11-07 |
| B of A Securities | maintain | Buy | 2025-06-24 |
| Cantor Fitzgerald | maintain | Overweight | 2025-06-24 |
| Citigroup | maintain | Buy | 2025-05-09 |
| Benchmark | maintain | Buy | 2025-05-09 |
| B of A Securities | maintain | Buy | 2025-04-16 |
| Cantor Fitzgerald | maintain | Overweight | 2025-03-14 |
| Benchmark | maintain | Buy | 2025-02-14 |
| Needham | maintain | Hold | 2025-02-14 |
Overall, the grades for both LRCX and NVMI indicate a strong sentiment, with several “Buy” and “Outperform” ratings maintained across different grading companies. This suggests that both stocks are generally viewed favorably by analysts in the current market environment.
Target Prices
The consensus target prices for Lam Research Corporation (LRCX) and Nova Ltd. (NVMI) reflect positive expectations from analysts.
| Company | Target High | Target Low | Consensus |
|---|---|---|---|
| Lam Research Corporation (LRCX) | 200 | 98 | 157.42 |
| Nova Ltd. (NVMI) | 224 | 210 | 217 |
For LRCX, the target consensus of 157.42 is slightly above the current price of 156.50, suggesting a modest upside. NVMI’s consensus of 217 indicates a stronger outlook compared to its current price of 310.33, warranting caution for potential investors given the high valuation.
Strengths and Weaknesses
The following table summarizes the strengths and weaknesses of Lam Research Corporation (LRCX) and Nova Ltd. (NVMI), two prominent players in the semiconductor industry.
| Criterion | Lam Research Corporation (LRCX) | Nova Ltd. (NVMI) |
|---|---|---|
| Diversification | Strong product range across various semiconductor processes | Focused on metrology systems for semiconductor manufacturing |
| Profitability | Net profit margin: 29.06% | Net profit margin: 27.33% |
| Innovation | High emphasis on R&D and patents | Steady innovation in metrology technology |
| Global presence | Operates in key markets globally | Significant presence in Israel, US, and Asia |
| Market Share | Leading market share in semiconductor equipment | Growing market share in metrology solutions |
| Debt level | Debt to equity ratio: 0.48 | Debt to equity ratio: 0.33 |
Key takeaways indicate that both companies exhibit strong profitability and innovative capabilities. However, Lam Research shows a more diversified product range and higher market share, which may present a favorable investment opportunity.
Risk Analysis
In the following table, I outline the key risks associated with Lam Research Corporation (LRCX) and Nova Ltd. (NVMI) to help evaluate their potential impact on investments.
| Metric | Lam Research Corporation (LRCX) | Nova Ltd. (NVMI) |
|---|---|---|
| Market Risk | High, due to semiconductor volatility | Moderate, affected by industry cycles |
| Regulatory Risk | Moderate, subject to export restrictions | Moderate, influenced by international regulations |
| Operational Risk | High, reliance on supply chain stability | Moderate, potential production disruptions |
| Environmental Risk | Moderate, compliance with environmental laws | Low, minimal exposure to environmental regulations |
| Geopolitical Risk | High, operational in sensitive regions | Moderate, exposure to international markets |
Both companies face considerable market risk due to the volatile semiconductor industry, with LRCX being particularly sensitive to supply chain disruptions. Recent geopolitical tensions have heightened these risks, making careful consideration essential for potential investors.
Which one to choose?
When comparing Lam Research Corporation (LRCX) and Nova Ltd. (NVMI), both companies display strong fundamentals, but with notable differences. LRCX has a higher gross profit margin of 48.7% compared to NVMI’s 57.6%. However, NVMI’s profit margins are lower, with net profit margins around 27.3%. LRCX’s price-to-earnings (P/E) ratio is approximately 23.4, which suggests a relatively favorable valuation, while NVMI stands at 31.2, indicating it may be overvalued. Both stocks show bullish trends, but LRCX has a more stable price movement with a recent 33.6% increase.
Investors seeking growth may prefer LRCX due to its robust margins and consistent returns on equity (ROE at 54.3%), while those interested in higher revenue growth could lean towards NVMI, despite its higher valuation risks.
Disclaimer: This article is not financial advice. Each investor is responsible for their own investment decisions.
Go further
I encourage you to read the complete analyses of Lam Research Corporation and Nova Ltd. to enhance your investment decisions: