In today’s competitive industrial landscape, selecting the right investment can significantly impact your portfolio’s performance. This article compares two notable players in the machinery sector: Kadant Inc. (KAI) and Columbus McKinnon Corporation (CMCO). Both companies operate in overlapping markets, focusing on innovative solutions for material handling and processing. With their unique strategies and product offerings, I aim to help you determine which company presents the more compelling investment opportunity.
Table of contents
Company Overview
Kadant Inc. Overview
Kadant Inc. is a leading provider of technologies and engineered systems that serve various industrial sectors, with a focus on fluid-handling systems, industrial processing, and material handling. Founded in 1991 and based in Westford, Massachusetts, Kadant operates through three key segments: Flow Control, Industrial Processing, and Material Handling. The company delivers innovative solutions such as rotary joints, debarkers, and recycling systems tailored for industries like packaging and alternative fuels. With a market cap of approximately $3.27B, Kadant remains pivotal in enhancing operational efficiencies for its clients.
Columbus McKinnon Corporation Overview
Columbus McKinnon Corporation specializes in intelligent motion solutions, designing and manufacturing equipment that facilitates the ergonomic movement, lifting, and securing of materials globally. Established in 1875 and headquartered in Buffalo, New York, the company caters to various industries, including transportation, energy, and e-commerce. Its product portfolio includes hoists, crane systems, and automation technologies, bolstering efficiencies in material handling. Columbus McKinnon is valued at around $475M, reflecting its critical role in modern industrial operations.
Both Kadant and Columbus McKinnon operate within the industrial sector, emphasizing machinery and systems that enhance operational efficiency. While Kadant focuses on fluid handling and processing systems, Columbus McKinnon specializes in motion solutions for material handling. Despite their different niches, both companies share a commitment to innovation and customer service in their respective markets.
Income Statement Comparison
Below is a comparison of the income statements for Kadant Inc. (KAI) and Columbus McKinnon Corporation (CMCO) for their most recent fiscal years, providing insights into their financial performance.
| Metric | Kadant Inc. (KAI) | Columbus McKinnon (CMCO) |
|---|---|---|
| Revenue | 1.05B | 963M |
| EBITDA | 222M | 75M |
| EBIT | 173M | 27M |
| Net Income | 112M | -5M |
| EPS | 9.51 | -0.18 |
Interpretation of Income Statement
Kadant Inc. has shown strong growth in revenue and net income, with a significant increase from 957M in revenue in the previous year to 1.05B in the latest year. In contrast, Columbus McKinnon experienced a decline in net income, moving from 46M in the previous year to a net loss of 5M this year, despite a slightly reduced revenue drop from 1.01B to 963M. KAI’s EBITDA margin has improved, signaling operational efficiency, while CMCO’s margins have contracted, indicating rising costs without corresponding revenue growth. This divergence in performance highlights the importance of evaluating not just revenue but also profitability and operational efficiency when choosing investments.
Financial Ratios Comparison
In this section, I will provide a comparative overview of key financial ratios for Kadant Inc. (KAI) and Columbus McKinnon Corporation (CMCO) based on the most recent data.
| Metric | KAI | CMCO |
|---|---|---|
| ROE | 13.17% | -0.58% |
| ROIC | 10.08% | 3.60% |
| P/E | 36.90 | -94.69 |
| P/B | 4.86 | 0.55 |
| Current Ratio | 2.31 | 1.81 |
| Quick Ratio | 1.55 | 1.04 |
| D/E | 0.38 | 0.61 |
| Debt-to-Assets | 0.23 | 0.31 |
| Interest Coverage | 8.55 | 1.68 |
| Asset Turnover | 0.74 | 0.55 |
| Fixed Asset Turnover | 6.18 | 9.07 |
| Payout Ratio | 13.15% | -156.52% |
| Dividend Yield | 0.36% | 1.65% |
Interpretation of Financial Ratios
Kadant Inc. displays a robust financial position with solid profitability metrics and a healthy current ratio, indicating good liquidity. The relatively high P/E ratio suggests that the market expects strong growth, despite the high valuation. In contrast, Columbus McKinnon struggles with negative profitability, evidenced by a negative P/E and payout ratio, signaling potential financial distress. Investors should weigh KAI’s strengths against CMCO’s challenges when considering portfolio inclusion.
Dividend and Shareholder Returns
Kadant Inc. (KAI) pays dividends with a payout ratio of 13.15%, showing a consistent annual dividend yield of approximately 0.36%. The company demonstrated a positive trend in dividends, with a recent dividend per share of $1.25. Their free cash flow comfortably covers distributions, mitigating risks of excessive repurchases.
Columbus McKinnon Corporation (CMCO) does not currently pay dividends, primarily due to negative net income and a focus on reinvestment for growth. However, the company has initiated share buybacks, indicating a commitment to returning value to shareholders. This approach aligns with potential long-term value creation, but investors should monitor profitability closely.
Strategic Positioning
Kadant Inc. (KAI) and Columbus McKinnon Corporation (CMCO) operate in the industrial machinery sector, each holding significant market shares in their respective niches. KAI focuses on fluid-handling and industrial processing systems, while CMCO specializes in intelligent motion solutions and material handling equipment. Both companies face competitive pressure from emerging technologies and established players, necessitating continuous innovation to maintain their market positions. As they navigate these dynamics, risk management remains essential for sustaining growth and profitability.
Stock Comparison
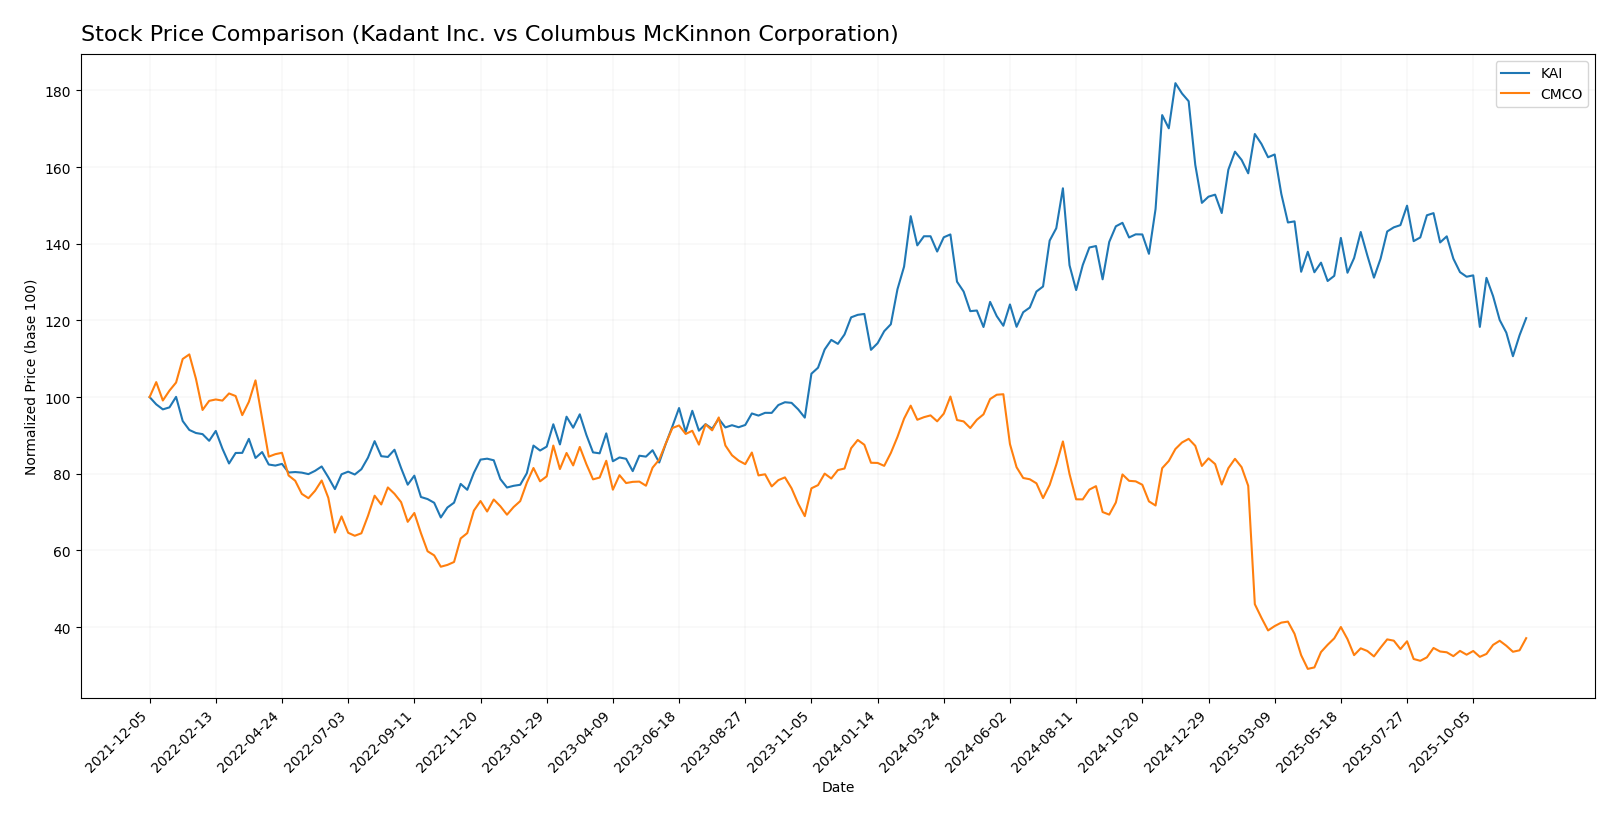
Over the past year, Kadant Inc. (KAI) and Columbus McKinnon Corporation (CMCO) have exhibited significant price movements and trading dynamics, reflecting their respective positions in the market.
Trend Analysis
Kadant Inc. (KAI) Over the past year, KAI has experienced a price change of +7.36%, indicating a bullish trend. The stock reached a notable high of 419.01 and a low of 254.91, suggesting some volatility with a standard deviation of 35.6. However, in the recent period from September 14, 2025, to November 30, 2025, the price changed by -11.4%, indicating a deceleration in bullish momentum.
Columbus McKinnon Corporation (CMCO) In contrast, CMCO has seen a significant price decrease of -55.24% over the last year, marking a bearish trend. The stock’s volatility is evident with a standard deviation of 11.25, having fluctuated between a high of 44.9 and a low of 12.96. Recently, from September 14, 2025, to November 30, 2025, CMCO’s price changed by +14.47%, indicating a slight recovery yet still within a broader bearish context.
Analyst Opinions
Recent recommendations for Kadant Inc. (KAI) and Columbus McKinnon Corporation (CMCO) both indicate a solid “B+” rating, suggesting a consensus to hold. Analysts praise KAI’s strong return on assets and discounted cash flow scores, citing its sustainable growth potential. Conversely, CMCO’s impressive discounted cash flow score and price-to-book ratio offset concerns regarding its return on equity. Overall, the market sentiment for both companies leans towards a cautious hold, reflecting balanced views on their growth prospects amid market volatility.
Stock Grades
I have gathered the latest stock grades from reliable grading companies for Kadant Inc. (KAI) and Columbus McKinnon Corporation (CMCO). Here’s an overview of their ratings:
Kadant Inc. Grades
| Grading Company | Action | New Grade | Date |
|---|---|---|---|
| Barrington Research | maintain | Outperform | 2025-10-30 |
| Barrington Research | maintain | Outperform | 2025-10-29 |
| Barrington Research | maintain | Outperform | 2025-10-27 |
| Barrington Research | maintain | Outperform | 2025-10-10 |
| Barrington Research | maintain | Outperform | 2025-09-23 |
| DA Davidson | maintain | Neutral | 2025-08-04 |
| Barrington Research | maintain | Outperform | 2025-07-30 |
| Barrington Research | maintain | Outperform | 2025-07-29 |
| Barrington Research | maintain | Outperform | 2025-05-01 |
| DA Davidson | maintain | Neutral | 2025-05-01 |
Columbus McKinnon Corporation Grades
| Grading Company | Action | New Grade | Date |
|---|---|---|---|
| DA Davidson | downgrade | Neutral | 2025-02-11 |
| DA Davidson | maintain | Buy | 2024-02-05 |
| DA Davidson | maintain | Buy | 2022-10-04 |
| DA Davidson | maintain | Buy | 2022-10-03 |
| Barrington Research | maintain | Outperform | 2022-07-29 |
| Barrington Research | maintain | Outperform | 2022-07-28 |
| JP Morgan | downgrade | Neutral | 2022-05-26 |
| Barrington Research | maintain | Outperform | 2022-05-26 |
| Barrington Research | maintain | Outperform | 2022-05-25 |
| JP Morgan | downgrade | Neutral | 2022-05-25 |
Overall, Kadant Inc. has consistently maintained an “Outperform” rating from Barrington Research, indicating strong confidence in its performance. In contrast, Columbus McKinnon Corporation has experienced a downgrade to “Neutral” from DA Davidson, suggesting a more cautious outlook.
Target Prices
The current consensus target prices for Kadant Inc. (KAI) and Columbus McKinnon Corporation (CMCO) reflect analysts’ expectations for future stock performance.
| Company | Target High | Target Low | Consensus |
|---|---|---|---|
| Kadant Inc. | 410 | 275 | 342.5 |
| Columbus McKinnon Corporation | 50 | 48 | 49 |
Kadant Inc. has a target consensus of 342.5, suggesting significant upside potential from its current price of 277.79. Columbus McKinnon shows a consensus of 49, indicating a moderate increase from its current price of 16.53.
Strengths and Weaknesses
The following table outlines the strengths and weaknesses of Kadant Inc. (KAI) and Columbus McKinnon Corporation (CMCO) based on the most recent financial data.
| Criterion | Kadant Inc. (KAI) | Columbus McKinnon (CMCO) |
|---|---|---|
| Diversification | High (3 segments) | Moderate (1 main segment) |
| Profitability | Strong (10.59% net margin) | Weak (-0.53% net margin) |
| Innovation | Moderate | Low |
| Global presence | Strong | Moderate |
| Market Share | Moderate | Low |
| Debt level | Low (22.57% debt/equity) | High (61.29% debt/equity) |
Key takeaways: Kadant Inc. showcases strong profitability and low debt levels, making it a more stable investment compared to Columbus McKinnon, which is currently struggling with profitability and higher debt.
Risk Analysis
Below is a summary of the key risks associated with Kadant Inc. (KAI) and Columbus McKinnon Corporation (CMCO):
| Metric | Kadant Inc. (KAI) | Columbus McKinnon Corp. (CMCO) |
|---|---|---|
| Market Risk | Medium | High |
| Regulatory Risk | Medium | Medium |
| Operational Risk | Low | High |
| Environmental Risk | Low | Medium |
| Geopolitical Risk | Medium | High |
Both companies face significant market risks due to economic volatility, particularly in the industrial sector. CMCO is particularly exposed to operational risks stemming from supply chain disruptions, while KAI has a moderate exposure to regulatory changes affecting the industrial machinery sector.
Which one to choose?
When comparing Kadant Inc. (KAI) and Columbus McKinnon Corporation (CMCO), KAI shows stronger financial fundamentals. KAI has a higher net profit margin of 10.59% compared to CMCO’s negative margin, indicating better profitability. The current ratio for KAI stands at 2.31, ensuring strong liquidity, while CMCO’s ratio is lower at 1.81. KAI’s stock trend appears bullish, despite a recent slight decline, whereas CMCO’s trend is bearish with a significant price drop of 55.24%. Analysts rate both companies B+, but KAI’s overall financial stability, including a lower debt-to-equity ratio and superior return on equity, makes it a more attractive option.
Investors focused on growth may prefer KAI, while those prioritizing turnaround potential could consider CMCO. However, risk remains, particularly due to CMCO’s competitive pressures and market dependence.
Disclaimer: This article is not financial advice. Each investor is responsible for their own investment decisions.
Go further
I encourage you to read the complete analyses of Kadant Inc. and Columbus McKinnon Corporation to enhance your investment decisions: