
Finding a trading strategy is challenging and long because there are too many possibilities. However, I discovered a way to quickly find a trading strategy thanks to decision trees and the MFE/MAE ratio on the Prorealtime platform. I hope this post will help you to save a lot of time in your trading strategies research.


What is a decision tree?
Decision tree definition
Decision trees are a category of trees used in data exploration and business intelligence. They give a hierarchic representation of data in the form of sequences of decisions.
The decision trees will help you to compute all the possible combinations of conditions allowing an entry opening.
There are three categories of nodes on a decision tree: the root node, the internal nodes, and the leaves.
Root node
The root node is the highest node of the decision tree. It is the gateway of a tree.
Internal nodes
The internal nodes begin just under the root node. All these nodes have child nodes that can be another internal node or a leaf.
Leaf nodes
These nodes have no child. They correspond to a final decision. Each leaf is a decision representing a possible combination that we want to test.
Decision tree modeling
We will design the modeling of the decision tree from the set of possible values that we will test :

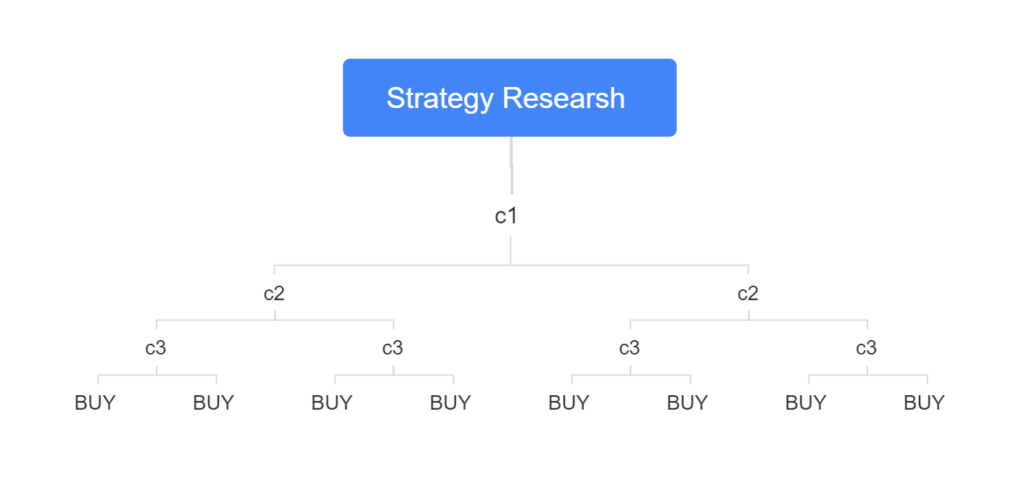
On the above decision tree, you have to imagine that you are focused on a not leaf node :
- To test a true condition, go down one floor toward the right.
- If you want to test a false condition, you go down one floor toward the left.
For example, all the left conditions on the decision tree (c1, c2, and c3) represent all false conditions: “NOT c1 AND NOT c2 AND NOT c3”.
The leaf nodes represent the decision that we will make. Since we search long entry points, the decision that we will make is “BUY”.
Find an entry point from technical indicators
You can use decision trees for modeling the possible values of a global entry opening condition. This condition will be defined from a set of technical indicators.
Principal technical indicators
There are four principal categories of technical indicators: trend, momentum, volume, and volatility.
| TREND | MOMENTUM | VOLUME | VOLATILITY |
|---|---|---|---|
| Moving averages Exponential moving average (EMA) Moving average Convergence divergence (MACD) Parabolic stop and reverse (Parabolic SAR) Linear regression Polynomial regression | Stochastic momentum Index (SMI) Commodity channel index (CCI) Relative strength index (RSI) | Volume Chaikin oscillator Onbalance volume (OBV) Volume rate of change | Bollinger bands Average true range Standard deviation Standard error |
For the example, I randomly chose three technical indicators from I defined three intermediate conditions :
//  Definition of unitary conditions to test
c1 = RSI[14] > 30
c2 = MACD [12,26,9] > 0
c3 = LinearRegressionSlope[10](close) > 0
We will test all the possibilities of these three conditions (c1, c2, and c3) in a global entry opening condition :
conditionDecisionTree = c1 AND NOT c2 AND c3Truth table
Turn the decision tree into a truth matrix
We can represent the set of possibilities the decision tree gives in a truth matrix. In the following table, the “0” value represents “FALSE” and the “1” value represents “TRUE” :
| c1 | c2 | c3 |
|---|---|---|
| 0 | 0 | 0 |
| 0 | 0 | 1 |
| 0 | 1 | 0 |
| 0 | 1 | 1 |
| 1 | 0 | 0 |
| 1 | 0 | 1 |
| 1 | 1 | 0 |
| 1 | 1 | 1 |
Translation of the truth table into runnable code
It is easy to translate the truth table into Prorealtime code. We have to replace “0” with “NOT condition” and “1” with “condition”.
| c1 | c2 | c3 |
|---|---|---|
| NOT c1 | NOT c2 | NOT c3 |
| NOT c1 | NOT c2 | C3 |
| NOT c1 | c2 | NOT c3 |
| NOT c1 | c2 | c3 |
| c1 | NOT c2 | NOT c3 |
| c1 | NOT c2 | C3 |
| c1 | c2 | NOT c3 |
| c1 | c2 | C3 |
Now we can easily build all the conditions that we want to test.
Build the conditions of the trading system
To build all the conditions, inserting the “AND” keyword between each condition from the truth table is sufficient. In this way, we will obtain the global condition allowing entry opening :
conditionDecisionTree = NOT c1 AND NOT c2 AND NOT c3
conditionDecisionTree = NOT c1 AND NOT c2 AND C3
conditionDecisionTree = NOT c1 AND c2 AND NOT c3
conditionDecisionTree = NOT c1 AND c2 AND c3
conditionDecisionTree = c1 AND NOT c2 AND NOT c3
conditionDecisionTree = c1 AND NOT c2 AND C3
conditionDecisionTree = c1 AND c2 AND NOT c3
conditionDecisionTree = c1 AND c2 AND C3
We can successfully test each possibility to observe if one of the combinations gives us an arbitrage opportunity.
For that, we have to define a cursor with a value beginning from 1 until 8. We will use this cursor in the condition “if cursor=x then” to test each “conditionDecisionTree “ possibility :
IF cursor=1 THEN
	conditionDecisionTree = NOT c1 AND NOT c2 AND NOT c3
ENDIF
On the below page, I give you the complete source code to find a strategy with three technical indicators.
Long trading strategy research
To begin, I will only try to buy each condition previously given to see if the three chosen technical indicators are efficient for a long strategy.
Code to research a long trading strategy
DEFPARAM CUMULATEORDERS = false
DEFPARAM FLATBEFORE = 090000
DEFPARAM FLATAFTER = 213000

// Définition des conditions unitaires à tester
c1 = RSI[14] > 30
c2 = MACD [12,26,9] > 0
c3 = LinearRegressionSlope[10](close) > 0

// Parcourir l'arbre de décision
IF cursor=1 THEN
	conditionDecisionTree = NOT c1 AND NOT c2 AND NOT c3
ENDIF

IF cursor=2 THEN
	conditionDecisionTree = NOT c1 AND NOT c2 AND C3
ENDIF

IF cursor=3 THEN
	conditionDecisionTree = NOT c1 AND c2 AND NOT c3
ENDIF

IF cursor=4 THEN
	conditionDecisionTree = NOT c1 AND c2 AND c3
ENDIF

IF cursor=5 THEN
	conditionDecisionTree = c1 AND NOT c2 AND NOT c3
ENDIF

IF cursor=6 THEN
	conditionDecisionTree = c1 AND NOT c2 AND C3
ENDIF

IF cursor=7 THEN
	conditionDecisionTree = c1 AND c2 AND NOT c3
ENDIF

IF cursor=8 THEN
	conditionDecisionTree = c1 AND c2 AND C3
ENDIF

// Ouvrir une position
IF NOT LongOnMarket AND conditionDecisionTree THEN
	BUY 1 CONTRACT AT MARKET
ENDIF
Long Trading strategy test running
To run a test, you have to create a new automated trading system on the Prorealtime platform and copy-paste the previous code source.
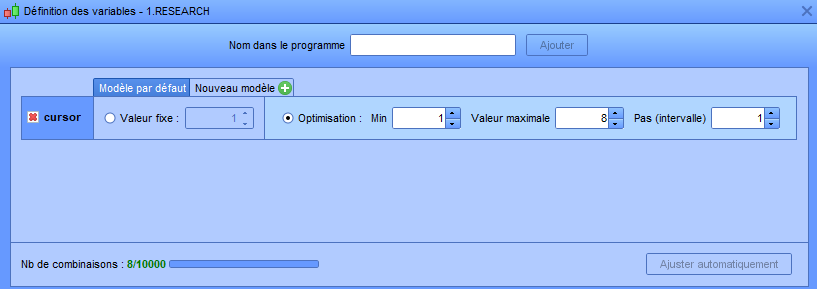
After that, you have to open the optimizer of the variables. I present to you this functionality in the chapter “Optimizer of the variables” of my book. This tool allows you to test a range of values of a variable.
We will run the optimizer of the variables on the “cursor” variable varying its value from 1 to 8. Thus we can cover all possible cases of the global condition “conditionDecisionTree “.

Now we can run the test like a normal strategy.
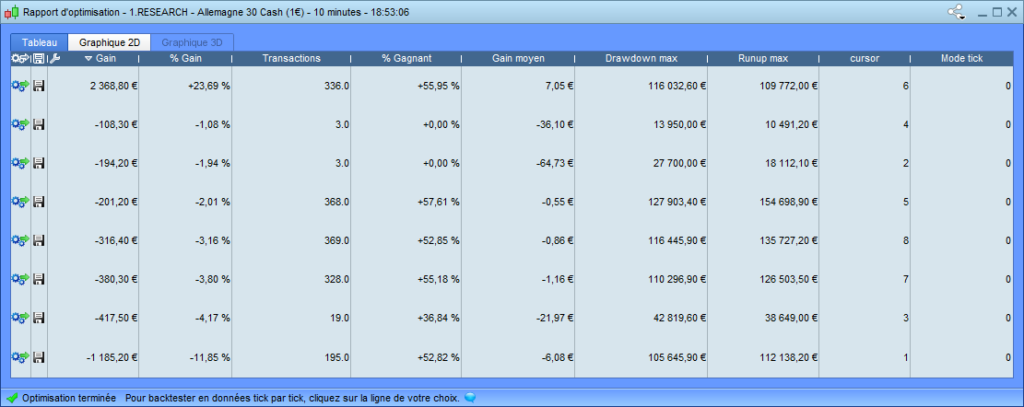
Interpretation of the result
Having launched the process, the optimizer of the variables prints the result for each value of the “cursor” variable corresponding to each tested combination.
The optimizer will naturally sort the result by performance :


The MFE / MAE ratio
Estimate the profitability of a strategy
As I mentioned in the chapter “Tactic and strategy meshing” of my book, the performance of a strategy depends on the entry, stop, and target positioning.
We will use the MFE, the MAE, and the average MFE / MAE to overcome this issue. These three indicators are available on the Prorealtime platform.
Max Favorable Execution
The MFE corresponds to the greatest latent gain while the position. The average MFE is the average of the MFE of the backtested strategy. This is the average of the maximal latent profits of the strategy.
Max Adverse Execution
The MAE corresponds to the greatest latent loss while the position. The average MAE is the average of the MAE of the backtested strategy. This is the average of the maximal latent losses of the strategy.
The average MFE / MAE indicator
The average MFE / MAE prints the MFE and the MAE on a graphic bar.
The MFE / MAE ratio
MFE / MAE ratio = MFE / MAE
You can easily validate the efficiency of an entry point thanks to the MFE / MAE ratio. If the MFE / MAE ratio is greater than 1, the average of latent profits is greater than the average of latent losses.
Backtest interpretation
To simplify the test result reading, I created a specific report that only contains the MFA, the MAE, and the average MFE / MAE indicators:


To create a specific report, you have to click on the tool key on the top and the right of the default report:


Then click on the green crux button to create a new report:


After that, you have to name and save the new model.
We can observe that despite the performance of 23.69%, the MFE is lower than the MAE.
MFE / MAE ratio:
MFE / MAE ratio = 67.42 / 68.68
MFE / MAE ratio = 0.98
The MFE / MAE ratio is lower than 1; thus, the tested combination is not good.
However, the fact that the MFE and the MAE are close gives us the hope that we will eventually have the possibility to create a profitable automated trading system. Besides, we should try to see if latent profits appear before latent losses. We also should analyze each entry point of this strategy.
Short trading strategy Research
Because the MFE / MAE ratio is lower than 1, I will remake the previous research process on the three same technical indicators that I presented at the beginning of this chapter for a short-selling strategy.
For that, I will replace the “BUY” instruction with “SELLSHORT” in the source code :
// Open a short entry
IF NOT ShortOnMarket AND conditionDecisionTree THEN

	SELLSHORT 1 CONTRACT AT MARKET

ENDIF
Note about source code
You may be remarked that I also replaced the “NOT LongOnMarket” instruction with “NOT ShortOnMarket”. I will explain this instruction later in my book’s chapter, “Position status of your system”.
Remember that this instruction disallows a new short entry opening if the system has already opened a short entry and did not close it.
You can see the source code research on the page below, a short entry from the three technical indicators I chose at the beginning of this chapter.
Code to research a short trading strategy
DEFPARAM CUMULATEORDERS = false
DEFPARAM FLATBEFORE = 090000
DEFPARAM FLATAFTER = 213000

// Définition des conditions unitaires à tester
c1 = RSI[14] > 30
c2 = MACD [12,26,9] > 0
c3 = LinearRegressionSlope[10](close) > 0

// Parcourir l'arbre de décision
IF cursor=1 THEN
	conditionDecisionTree = NOT c1 AND NOT c2 AND NOT c3
ENDIF

IF cursor=2 THEN
	conditionDecisionTree = NOT c1 AND NOT c2 AND C3
ENDIF

IF cursor=3 THEN
	conditionDecisionTree = NOT c1 AND c2 AND NOT c3
ENDIF

IF cursor=4 THEN
	conditionDecisionTree = NOT c1 AND c2 AND c3
ENDIF

IF cursor=5 THEN
	conditionDecisionTree = c1 AND NOT c2 AND NOT c3
ENDIF

IF cursor=6 THEN
	conditionDecisionTree = c1 AND NOT c2 AND C3
ENDIF

IF cursor=7 THEN
	conditionDecisionTree = c1 AND c2 AND NOT c3
ENDIF

IF cursor=8 THEN
	conditionDecisionTree = c1 AND c2 AND C3
ENDIF

// Ouvrir une position courte
IF NOT ShortOnMarket AND conditionDecisionTree THEN
	SELLSHORT 1 CONTRACT AT MARKET
ENDIF
Running and interpretation of the result of the short strategy
The running of this test is like the previous long test.
The optimizer of the variables selected for the first combination for the cursor value is 1. The performance of this combination is 11.46%.
This combination corresponds to the following condition :
conditionDecisionTree = NOT c1 AND NOT c2 AND NOT c3This result is interesting even if the performance is only 11.46% on the period, the MFE / MAE ratio is more positive than the initial long strategy :

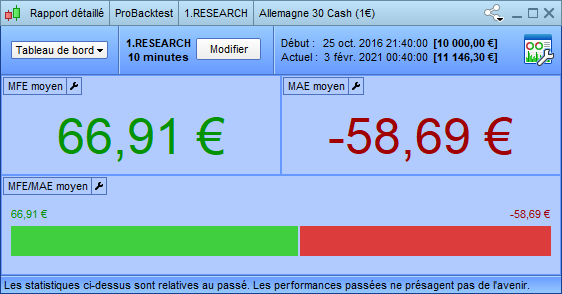
We can eventually conclude that the three initially selected conditions give a better potential of a return to a short strategy than a long strategy.
Strategy research summary
- The decision tree data structure may help you to represent all the combinations of technical indicators.
- The MFE / MAE ratio is a good indicator of whether an entry point is exploitable quickly.
- The MFE / MAE ratio should be greater than 1 to validate the earnings potential of a strategy.
- If the MFE / MAE ratio of a long strategy is lower than 1, then the MFE / MAE ratio should be greater than 1 if you short these same entries.
To go further
Find a trading strategy from more technical indicators
In my book about automated trading, I give source code to find a strategy from 4 and 5 technical indicators.
In the next post, I will show you how to develop an automated trend-following system using Prorealtime.
Sources
- Decision tree: https://en.wikipedia.org/wiki/Decision_tree
- Combinations and Permutations: https://www.mathsisfun.com/combinatorics/combinations-permutations.html
- Trading strategy papers: https://www.academia.edu/Documents/in/Trading_Strategies
Primary image source: https://www.maxpixel.net/Experiment-Flat-Laboratory-Chemistry-Science-5379250
Range Breakout Indicator for Prorealtime
The Range Breaker indicator will help you seize the best trading opportunities. It detects all range breakouts, often followed by explosive price movements. The indicator works with all brokers accepting the Prorealtime platform.