Home > Analyses > Technology > Everpure, Inc
Everpure, Inc revolutionizes how enterprises manage and protect their data, powering critical operations worldwide. Its innovative FlashArray and FlashBlade products set industry standards for speed, reliability, and efficiency in data storage. Renowned for seamless integration and cutting-edge software like Purity, Everpure shapes the future of digital infrastructure. As competition intensifies, I examine whether Everpure’s robust fundamentals justify its current valuation and growth prospects in the evolving tech landscape.

Table of contents
Business Model & Company Overview
Everpure, Inc, founded in 2009 and headquartered in Santa Clara, California, commands a dominant position in the computer hardware sector. It offers a cohesive ecosystem of data storage technologies, integrating enterprise-class software and hardware solutions. Its portfolio includes FlashArray for block storage, FlashBlade for unstructured data, and AI-ready infrastructure, all united by Purity software that delivers advanced data services and protocols. This integrated approach defines its core mission to simplify and secure data management at scale.
The company’s revenue engine balances high-performance hardware with recurring subscription services like evergreen storage and Pure as-a-Service. Its global footprint spans the Americas, Europe, and Asia, leveraging direct sales and channel partners to capture diverse markets. Everpure’s strategic combination of innovative products and cloud-native solutions, such as Portworx for Kubernetes, establishes a robust economic moat that positions it to shape the future of data storage.
Financial Performance & Fundamental Metrics
I will analyze Everpure, Inc’s income statement, key financial ratios, and dividend payout policy to assess its core financial health and shareholder value approach.
Income Statement
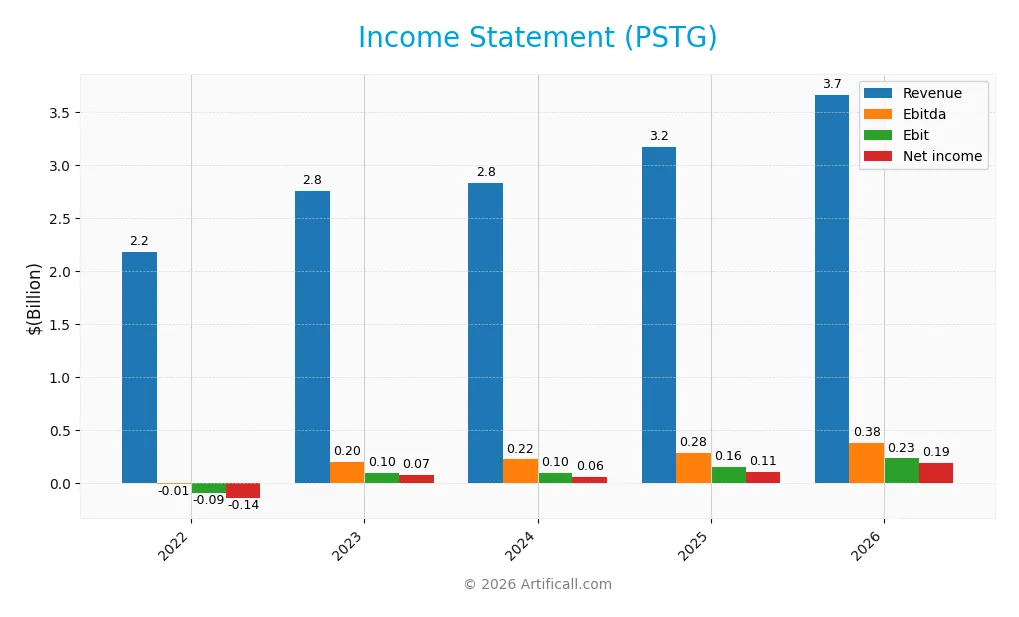
The table below summarizes Everpure, Inc’s key income statement figures for fiscal years 2022 through 2026, reflecting revenue growth and profitability trends.
| 2022 | 2023 | 2024 | 2025 | 2026 | |
|---|---|---|---|---|---|
| Revenue | 2.18B | 2.75B | 2.83B | 3.17B | 3.66B |
| Cost of Revenue | 708M | 856M | 809M | 955M | 1.08B |
| Operating Expenses | 1.57B | 1.81B | 1.97B | 2.13B | 2.46B |
| Gross Profit | 1.47B | 1.90B | 2.02B | 2.21B | 2.58B |
| EBITDA | -8.67M | 197M | 222M | 282M | 379M |
| EBIT | -91.8M | 97M | 98M | 156M | 232M |
| Interest Expense | 37M | 4.7M | 7.5M | 7.8M | 7.3M |
| Net Income | -143M | 73M | 62M | 107M | 188M |
| EPS | -0.50 | 0.24 | 0.20 | 0.33 | 0.49 |
| Filing Date | 2022-04-07 | 2023-04-03 | 2024-04-01 | 2025-03-27 | 2026-03-25 |
Income Statement Evolution
Everpure’s revenue rose 68% from 2022 to 2026, with a 15.6% increase in the latest year. Net income surged 231% over the period, while net margin expanded 178%. Gross margin stayed strong at 70%, reflecting stable cost control. Operating expenses grew alongside revenue, slightly pressuring operating margins but supporting overall earnings growth.
Is the Income Statement Favorable?
In 2026, Everpure reported $3.66B revenue and $188M net income, yielding a 5.1% net margin. EBIT margin was neutral at 6.3%, while interest expenses remained low at 0.2%. Despite operating expenses growing in line with revenue, earnings and EPS grew over 50%, signaling solid fundamental performance. Overall, the income statement appears favorable with strong profitability and efficient capital costs.
Financial Ratios
The table below summarizes key financial ratios for Everpure, Inc (PSTG) over the past five fiscal years, offering a snapshot of profitability, liquidity, leverage, and valuation metrics:
| Ratios | 2022 | 2023 | 2024 | 2025 | 2026 |
|---|---|---|---|---|---|
| Net Margin | -6.57% | 2.65% | 2.17% | 3.37% | 5.14% |
| ROE | -18.99% | 7.76% | 4.83% | 8.17% | 13.02% |
| ROIC | -4.44% | 2.76% | 1.55% | 2.45% | 3.43% |
| P/E | -52.78 | 120.70 | 213.05 | 203.82 | 123.52 |
| P/B | 10.02 | 9.37 | 10.28 | 16.65 | 16.08 |
| Current Ratio | 2.30 | 1.42 | 1.83 | 1.61 | 1.60 |
| Quick Ratio | 2.26 | 1.39 | 1.80 | 1.58 | 1.56 |
| D/E | 1.21 | 0.81 | 0.21 | 0.22 | 0.15 |
| Debt-to-Assets | 29.20% | 21.46% | 7.45% | 7.09% | 4.62% |
| Interest Coverage | -2.68 | 17.59 | 7.16 | 10.91 | 15.64 |
| Asset Turnover | 0.70 | 0.78 | 0.77 | 0.80 | 0.78 |
| Fixed Asset Turnover | 7.10 | 6.38 | 5.87 | 5.21 | 4.74 |
| Dividend Yield | 0.00% | 0.00% | 0.00% | 0.00% | 0.00% |
Evolution of Financial Ratios
Return on Equity (ROE) improved steadily from a negative -18.99% in 2022 to 13.02% in 2026, reflecting a recovery in profitability. The Current Ratio declined from 2.30 in 2022 to 1.60 in 2026, indicating lower but still adequate liquidity. Debt-to-Equity Ratio dropped sharply from 0.81 in 2023 to 0.15 in 2026, signaling a significant deleveraging trend.
Are the Financial Ratios Favorable?
In 2026, profitability ratios such as ROE (13.02%) and net margin (5.14%) appear neutral, while return on invested capital (3.43%) trails the 10.26% WACC, marking an unfavorable profitability spread. Liquidity is favorable with a Current Ratio of 1.6 and quick ratio of 1.56. Leverage ratios, including debt to equity at 0.15 and debt to assets at 4.62%, are favorable. Market valuation ratios like P/E at 123.5 and P/B at 16.1 remain elevated and unfavorable. Overall, the ratios present a slightly favorable profile.
Shareholder Return Policy
Everpure, Inc (PSTG) does not pay dividends, reflecting a reinvestment strategy aligned with its growth phase. The company maintains positive net income and free cash flow, supporting operational expansion rather than immediate shareholder payouts.
The absence of dividends accompanies no share buyback activity, indicating a focus on capital retention to fuel development. This policy supports sustainable long-term value creation by prioritizing reinvestment over distributions in the current market cycle.
Score analysis
The radar chart below highlights key financial metrics to assess Everpure, Inc’s valuation and performance:
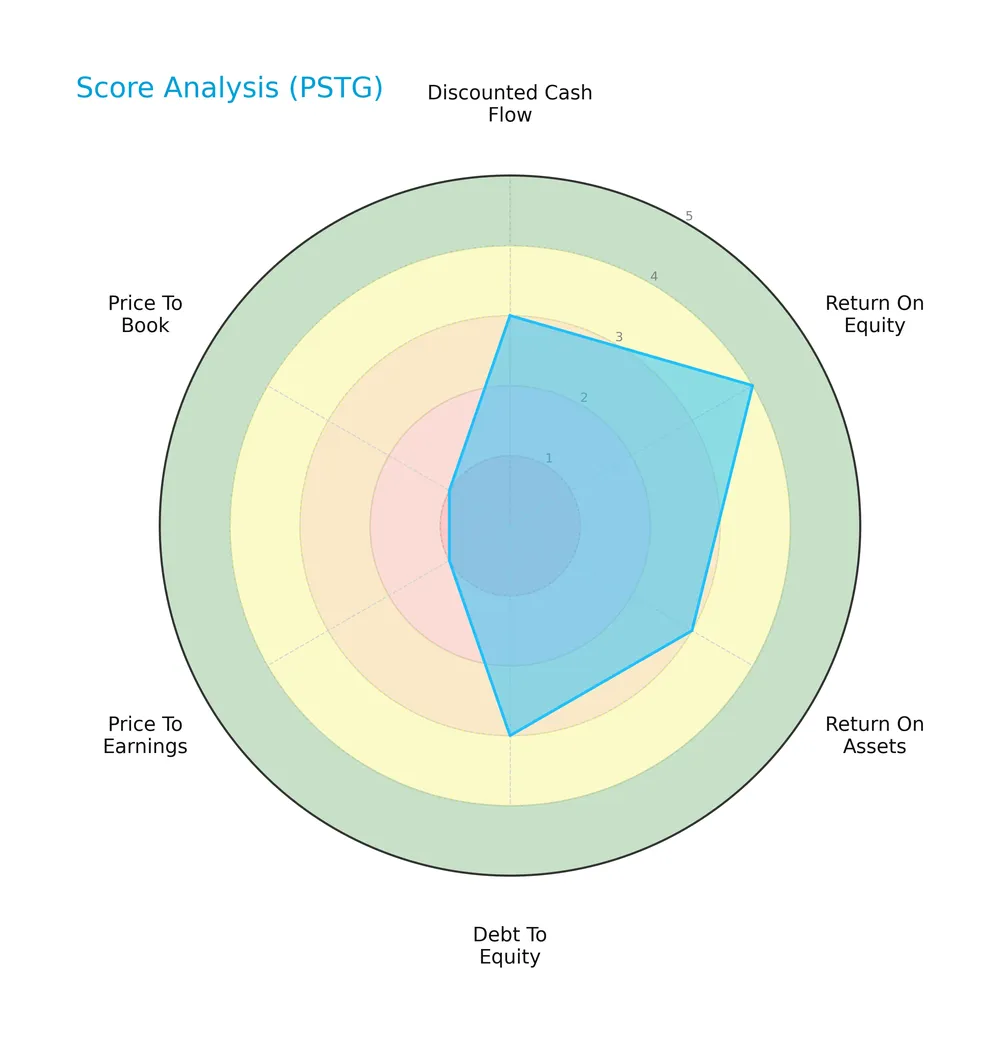
Everpure shows moderate discounted cash flow, return on assets, and debt-to-equity scores. Return on equity is favorable. However, price-to-earnings and price-to-book valuations are very unfavorable, indicating potential market pricing concerns.
Analysis of the company’s bankruptcy risk
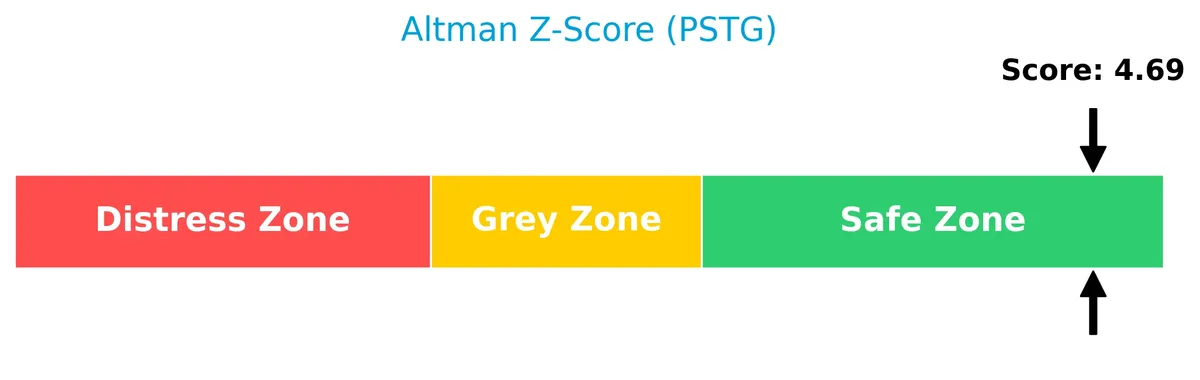
Everpure’s Altman Z-Score places it comfortably in the safe zone, signaling low bankruptcy risk:
Is the company in good financial health?
The Piotroski score diagram offers insight into Everpure’s current financial condition:
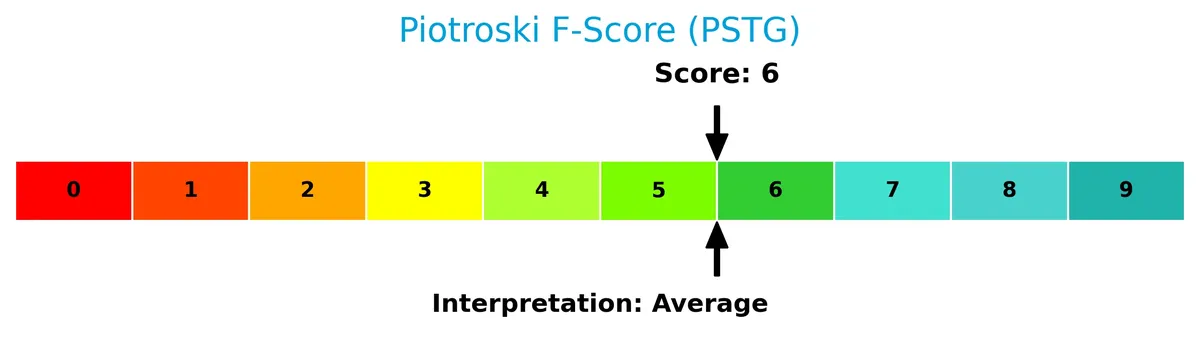
With a score of 6, Everpure demonstrates average financial health, reflecting some strengths but also room for improvement in profitability and efficiency metrics.
Competitive Landscape & Sector Positioning
This section analyzes Everpure, Inc’s strategic position within the technology sector, focusing on its product segments and competitors. It will detail the company’s key products, revenue breakdown, and market dynamics. I will assess whether Everpure holds a sustainable competitive advantage over its industry rivals.
Strategic Positioning
Everpure, Inc concentrates on advanced data storage solutions, blending products and services with growing subscription revenue. Its geographic exposure spans the US and international markets, with the US generating roughly two-thirds of revenue. This dual focus highlights a balanced, yet technology-centric strategy.
Revenue by Segment
The pie chart illustrates Everpure, Inc’s revenue breakdown by segment for fiscal year 2026, highlighting the relative contribution of Product and Service lines.
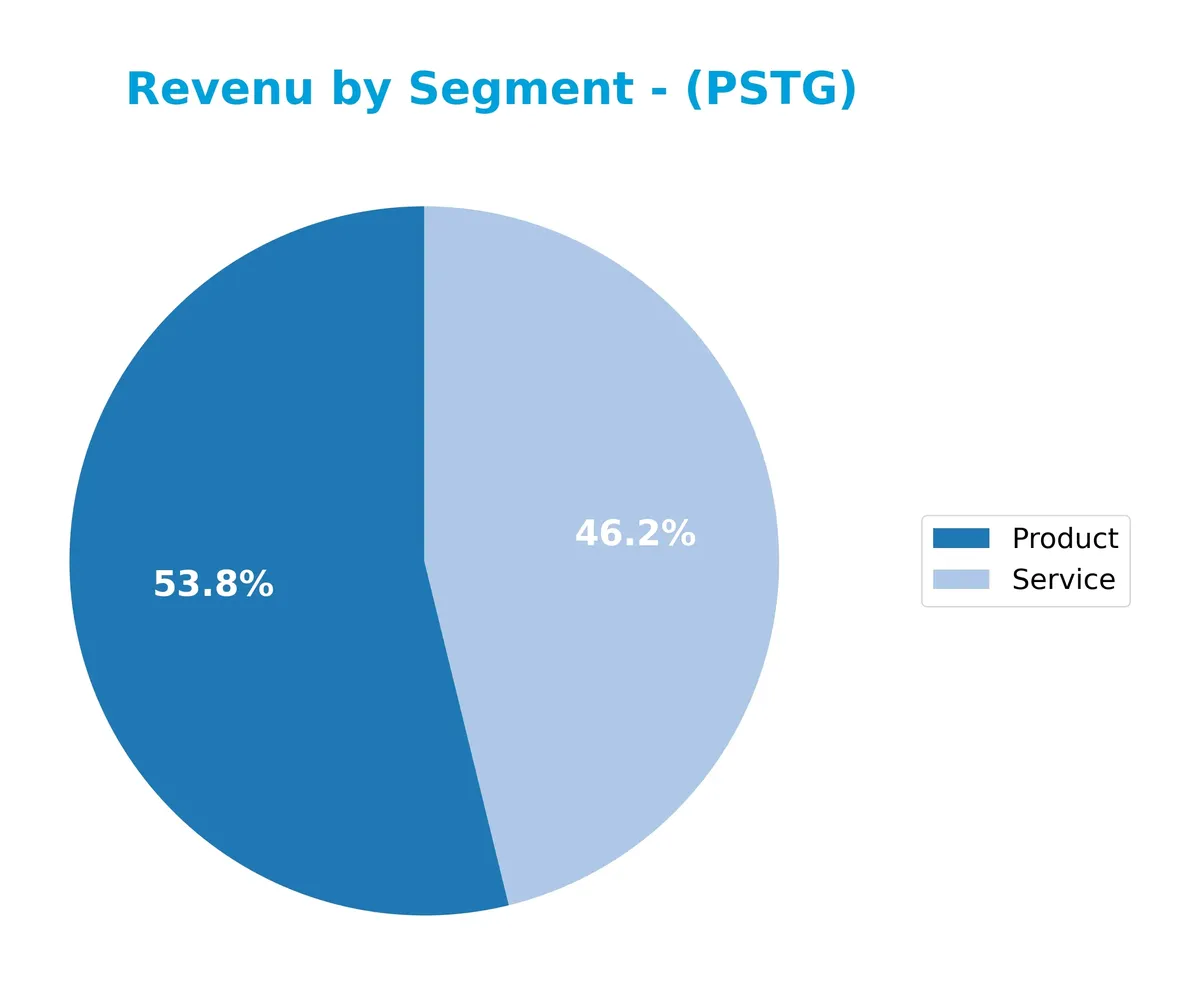
Everpure’s Product segment leads with $1.97B in 2026, showing steady growth from $1.44B in 2022. The Service segment also expanded significantly, reaching $1.69B in 2026 from $739M in 2022. This dual expansion reflects a balanced business model with rising service revenue reducing concentration risk. The acceleration in Service revenue signals growing recurring income, enhancing overall stability.
Key Products & Brands
Everpure, Inc offers a diverse portfolio of data storage products and services, including hardware, software, and cloud solutions:
| Product | Description |
|---|---|
| FlashArray | Block-oriented storage arrays for databases, applications, virtual machines, and traditional workloads. |
| FlashArray//XL | An enhanced version of FlashArray, details unspecified in the provided data. |
| FlashArray//C | All-QLC flash array designed for cost-effective storage. |
| FlashBlade | Storage solution optimized for unstructured data workloads. |
| FlashStack | Integrated infrastructure platform combining compute, network, and storage. |
| FlashRecover | All-flash data protection solution for modern backup and recovery needs. |
| AIRI | AI-ready full-stack infrastructure platform. |
| Evergreen Storage Subscription | Subscription service providing ongoing access to storage hardware and software upgrades. |
| Pure as-a-Service | Cloud-based storage consumption model offering flexibility and scalability. |
| Cloud Block Store | Cloud-native block storage solution for hybrid and multi-cloud environments. |
| Portworx | Kubernetes data management platform for cloud-native applications. |
| Purity Software | Enterprise-class data services software, providing data reduction, protection, encryption, and storage protocols. |
Everpure’s product revenue grew to $1.97B in 2026, supported by $1.69B in services. The company integrates hardware, software, and cloud offerings, targeting a broad spectrum of data storage needs across industries.
Main Competitors
There are 12 competitors in total, with this table outlining the top 10 leaders by market capitalization:
| Competitor | Market Cap. |
|---|---|
| Arista Networks, Inc. | 168B |
| Dell Technologies Inc. | 86B |
| Western Digital Corporation | 65B |
| Seagate Technology Holdings plc | 61B |
| Pure Storage, Inc. | 22B |
| NetApp, Inc. | 21B |
| HP Inc. | 21B |
| Super Micro Computer, Inc. | 18B |
| IonQ, Inc. | 16B |
| D-Wave Quantum Inc. | 9B |
Pure Storage, Inc. ranks 5th among its peers, with a market cap 11.58% the size of the leader, Arista Networks. It sits below both the average market cap of the top 10 competitors (48.7B) and the sector median (21B). The company maintains a 213.88% larger gap over the next closest competitor above it, highlighting a significant scale difference.
Comparisons with competitors
Check out how we compare the company to its competitors:
Does Everpure have a competitive advantage?
Everpure currently lacks a strong competitive advantage, as its return on invested capital (ROIC) falls below its weighted average cost of capital (WACC), indicating value destruction. However, the company’s ROIC trend shows significant growth, suggesting improving profitability.
Looking ahead, Everpure’s expanding product portfolio, including AI-ready infrastructure and cloud-native data management solutions, alongside growth in both U.S. and international markets, offers potential opportunities to enhance its competitive position.
SWOT Analysis
This analysis highlights Everpure, Inc’s key internal and external factors to guide strategic decisions.
Strengths
- strong revenue growth of 68% over 5 years
- favorable gross margin at 70%
- low debt with debt-to-assets at 4.6%
Weaknesses
- ROIC below WACC, indicating value destruction
- high P/E of 123.5 signals overvaluation
- unfavorable price-to-book ratio at 16.1
Opportunities
- expanding international sales, Non-US revenue growing rapidly
- growth in cloud-native and AI-ready infrastructure
- increasing demand for data protection and storage services
Threats
- intense competition in computer hardware sector
- rapid technological changes may require heavy R&D
- high valuation poses risk if growth slows
Everpure’s strengths in growth and margin underpin its market position, but value destruction and high valuation demand caution. The company must leverage global expansion and innovation to offset competitive and technological risks.
Stock Price Action Analysis
The weekly stock chart below illustrates Everpure, Inc’s price movements and volatility over the last 12 months:
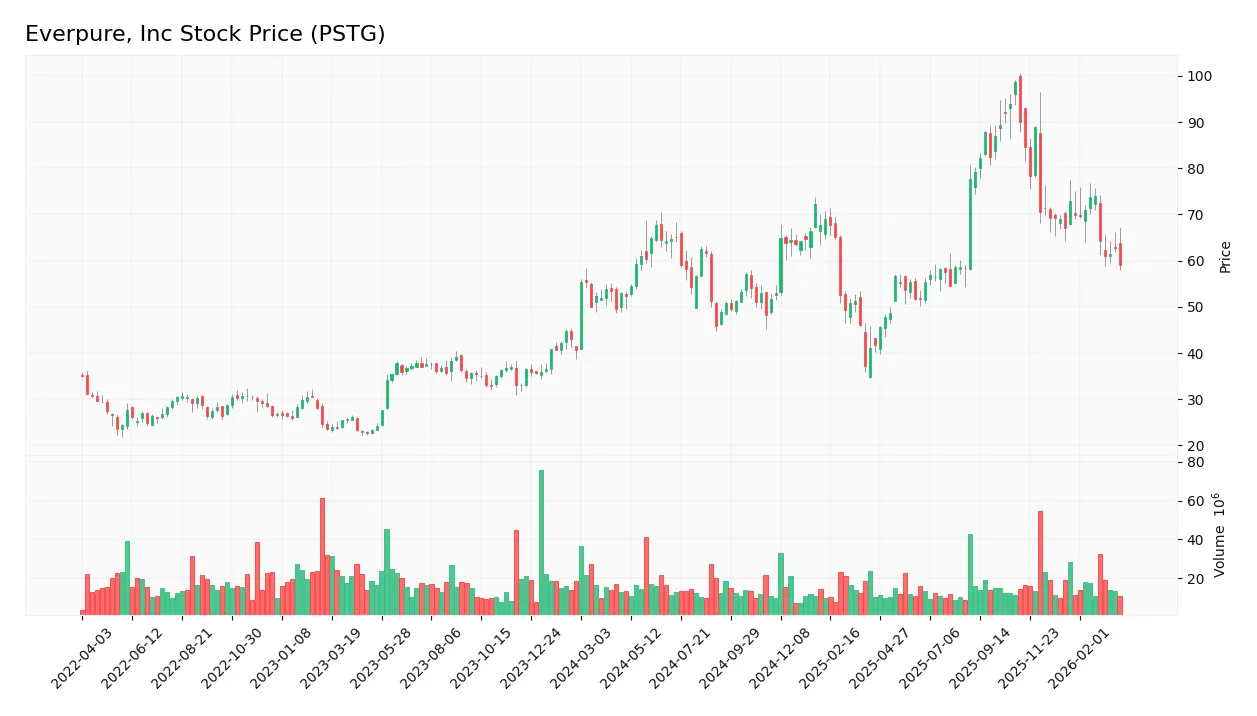
Trend Analysis
Over the past year, PSTG’s stock gained 12.9%, indicating a bullish trend with decelerating momentum. The price ranged from a low of 37.18 to a peak near 98.7. Recent three-month data show a -11.94% decline, a short-term bearish slope, and reduced volatility at 5.15%.
Volume Analysis
In the last three months, trading volumes declined slightly with seller volume (105M) marginally exceeding buyer volume (101M). Buyer dominance stands at 49%, signaling neutral investor sentiment and balanced market participation in this period.
Target Prices
Analysts set a clear target price consensus for Everpure, Inc, reflecting optimistic growth expectations.
| Target Low | Target High | Consensus |
|---|---|---|
| 60 | 105 | 87.56 |
The target range spans from 60 to 105, with a consensus near 88, indicating moderate upside potential balanced by some risk.

Don’t Let Luck Decide Your Entry Point
Optimize your entry points with our advanced ProRealTime indicators. You’ll get efficient buy signals with precise price targets for maximum performance. Start outperforming now!
Analyst & Consumer Opinions
This section examines Everpure, Inc (PSTG) through analyst ratings and consumer feedback to gauge market sentiment.
Stock Grades
Here are the latest verified stock grades for Everpure, Inc from leading financial firms:
| Grading Company | Action | New Grade | Date |
|---|---|---|---|
| Northland Capital Markets | Upgrade | Outperform | 2026-03-09 |
| Wells Fargo | Maintain | Overweight | 2026-02-26 |
| UBS | Maintain | Sell | 2026-02-26 |
| Barclays | Maintain | Equal Weight | 2026-02-26 |
| Wedbush | Maintain | Outperform | 2026-02-23 |
| Evercore ISI Group | Maintain | Outperform | 2026-02-19 |
| Citigroup | Maintain | Buy | 2026-02-17 |
| Lake Street | Maintain | Buy | 2025-12-03 |
The consensus leans bullish, with multiple firms affirming “Buy” or better ratings. UBS stands out as a consistent outlier with a “Sell” rating, indicating some divergent views on risk or value.
Consumer Opinions
Everpure, Inc. sparks lively consumer sentiment, reflecting a mix of enthusiasm and critical feedback.
| Positive Reviews | Negative Reviews |
|---|---|
| Exceptional water filtration quality. | Higher price point than competitors. |
| Reliable and long-lasting filter systems. | Customer service response times can lag. |
| Easy installation and maintenance. | Limited product variety in some regions. |
Consumers consistently praise Everpure’s superior filtration and durability. However, pricing and occasional service delays emerge as common concerns.
Risk Analysis
Below is a table summarizing key risks facing Everpure, Inc, along with their likelihood and potential impact:
| Category | Description | Probability | Impact |
|---|---|---|---|
| Valuation Risk | Extremely high P/E (123.5) and P/B (16.1) ratios suggest overvaluation | High | High |
| Profitability Risk | ROIC (3.43%) below WACC (10.26%) signals weak capital efficiency | Medium | High |
| Market Volatility | Beta of 1.33 indicates above-market price swings | High | Medium |
| Dividend Policy | No dividend yield limits income appeal and signals reinvestment | Medium | Medium |
| Financial Health | Favorable Altman Z-Score (4.69) shows low bankruptcy risk | Low | Low |
| Liquidity Risk | Current ratio (1.6) and quick ratio (1.56) are solid | Low | Low |
Everpure’s biggest concerns lie in its stretched valuation and subpar return on invested capital versus its cost of capital. The stock trades well above industry averages, increasing downside risk if growth falters. Its sound liquidity and low bankruptcy risk mitigate immediate solvency worries.
Should You Buy Everpure, Inc?
Everpure, Inc appears to be improving profitability with rising ROIC, yet it still destroys value relative to WACC, suggesting a slightly unfavorable moat. Supported by a manageable leverage profile and a B- rating, the overall financial health could be seen as moderately favorable.
Strength & Efficiency Pillars
Everpure, Inc presents a solid operational profile with a favorable gross margin of 70.38% and a net margin standing at 5.14%. The return on equity (ROE) is neutral at 13.02%, reflecting moderate profitability. Despite a rising ROIC trend, the current ROIC of 3.43% falls short of the WACC at 10.26%, indicating the company is currently shedding value rather than creating it. Nevertheless, strong interest coverage of 31.56 and low leverage (debt-to-equity at 0.15) support operational resilience.
Weaknesses and Drawbacks
The company’s valuation metrics raise significant concerns: a P/E ratio of 123.52 and a P/B ratio of 16.08 suggest an expensive market pricing, leaving limited margin for valuation correction. While liquidity ratios are favorable, the mismatch between ROIC and WACC signals inefficiency in capital allocation. Additionally, lack of dividend yield (0%) may deter income-focused investors. Recent bearish price action (-11.94%) and near parity in buyer-seller activity (buyers at 48.99%) signal short-term market pressure and uncertainty.
Our Final Verdict about Everpure, Inc
Everpure, Inc’s financial health is solidly in the safe zone with an Altman Z-score of 4.69, alleviating bankruptcy concerns. However, the high valuation multiples combined with declining recent price trends suggest caution. Despite long-term operational improvements and a bullish overall trend, the recent market pressure might warrant a wait-and-see approach for a more favorable entry point. The investment profile may appear attractive for patient investors focused on growth.
Disclaimer: This content is for informational purposes only and does not constitute financial, investment, or other professional advice. Investing in financial markets involves a significant risk of loss, and past performance is not indicative of future results.
Additional Resources
- Everpure (PSTG) was Volatile Despite Strong Results – Yahoo Finance (Mar 24, 2026)
- Is Everpure, Inc. (PSTG) a good stock to buy now? – MSN (Mar 25, 2026)
- Everpure Stock Down 25% in Past 6 Months: Should You Hold or Offload? – TradingView (Mar 27, 2026)
- Decoding Everpure Inc (PSTG): A Strategic SWOT Insight – GuruFocus (Mar 26, 2026)
- Everpure (PSTG) maps AI-era storage, hyperscaler and 1touch plans – Stock Titan (Mar 24, 2026)
For more information about Everpure, Inc, please visit the official website: purestorage.com