In today’s rapidly evolving tech landscape, two companies stand out for their innovative approaches: EPAM Systems, Inc. and Asana, Inc. Both firms operate within the technology sector, yet they focus on different facets of digital solutions—EPAM specializes in software development and engineering services, while Asana offers a robust work management platform. By examining their market strategies and overlap, I aim to help you determine which company may be a more compelling investment opportunity. Let’s dive in!
Table of contents
Company Overview
EPAM Overview
EPAM Systems, Inc. is a leading provider of digital platform engineering and software development services, founded in 1993 and headquartered in Newtown, Pennsylvania. With a market capitalization of approximately $10.25B, EPAM specializes in delivering engineering services that encompass requirements analysis, platform selection, and implementation. The company also offers infrastructure management and optimization solutions, serving diverse industries such as financial services, healthcare, and software technology. EPAM’s focus on innovation is evident in its offerings, which include AI, robotics, and virtual reality solutions, positioning it as a key player in the information technology services sector.
Asana Overview
Asana, Inc., headquartered in San Francisco, California, operates a collaborative work management platform aimed at individuals and teams across various industries. Incorporated in 2008, Asana has grown to a market capitalization of around $2.95B. The platform facilitates project management, enabling teams to efficiently orchestrate tasks and strategic initiatives. Asana serves clients in technology, retail, and healthcare, among others, and is particularly known for its user-friendly interface that promotes organizational productivity.
Key Similarities and Differences
Both EPAM and Asana are technology-driven companies catering to business needs, but they differ significantly in their business models. EPAM focuses on providing comprehensive engineering and consulting services, while Asana centers on delivering a software platform for work management and collaboration. This distinction highlights EPAM’s role in service provision versus Asana’s emphasis on software application and user experience.
Income Statement Comparison
The following table summarizes the most recent income statements of EPAM Systems, Inc. and Asana, Inc., highlighting key financial metrics that can aid in assessing their performance.
| Metric | EPAM Systems, Inc. | Asana, Inc. |
|---|---|---|
| Revenue | 4.73B | 724M |
| EBITDA | 672M | -230M |
| EBIT | 545M | -247M |
| Net Income | 455M | -256M |
| EPS | 7.93 | -1.11 |
Interpretation of Income Statement
In the most recent fiscal year, EPAM demonstrated solid revenue growth, increasing from 4.69B to 4.73B, while net income rose from 417M to 455M, reflecting stable margins. Conversely, Asana reported a revenue increase from 652M to 724M; however, it continued to post significant net losses, with a net income of -256M. This indicates a persistent struggle with profitability despite revenue growth. The divergence in performance suggests that while EPAM is managing to enhance its profitability, Asana still faces substantial challenges in controlling expenses, which has hindered margin improvement.
Financial Ratios Comparison
The following table provides a comparative overview of the most recent revenue and financial ratios for both EPAM Systems, Inc. (EPAM) and Asana, Inc. (ASAN).
| Metric | EPAM | ASAN |
|---|---|---|
| ROE | 12.52% | -112.31% |
| ROIC | 10.67% | -54.04% |
| P/E | 29.47 | -19.16 |
| P/B | 3.69 | 21.52 |
| Current Ratio | 2.96 | 1.44 |
| Quick Ratio | 2.96 | 1.44 |
| D/E | 0.045 | 1.18 |
| Debt-to-Assets | 3.44% | 30.11% |
| Interest Coverage | — | — |
| Asset Turnover | 0.99 | 0.81 |
| Fixed Asset Turnover | 14.08 | 2.76 |
| Payout Ratio | 0% | 0% |
| Dividend Yield | 0% | 0% |
Interpretation of Financial Ratios
In comparing these two companies, EPAM displays strong financial health with a solid ROE of 12.52% and a manageable debt-to-equity ratio of 0.045, indicating low leverage. Conversely, ASAN shows significant financial challenges, with negative ROE and ROIC, highlighting operational inefficiencies and excessive debt levels (D/E at 1.18). Investors should approach ASAN with caution, given its poor profitability metrics and high leverage risk.
Dividend and Shareholder Returns
EPAM Systems, Inc. does not pay dividends, reflecting a strategy focused on reinvestment and growth rather than shareholder distributions. The company is currently engaging in share buybacks, which can enhance shareholder value by reducing share dilution. Asana, Inc. similarly opts against dividends, prioritizing investment in innovation amid its high-growth phase. This approach, while lacking immediate returns, could potentially support long-term value creation if managed prudently.
Strategic Positioning
EPAM Systems, Inc. (EPAM) holds a significant market share in the digital platform engineering sector, leveraging its extensive service offerings across multiple industries. With a market cap of 10.2B, it faces competitive pressure from emerging tech firms and established players alike. Asana, Inc. (ASAN), with a market cap of 2.9B, operates in the work management space, experiencing technological disruption as it adapts to changing market demands. Both companies must continuously innovate to maintain their competitive edge.
Stock Comparison
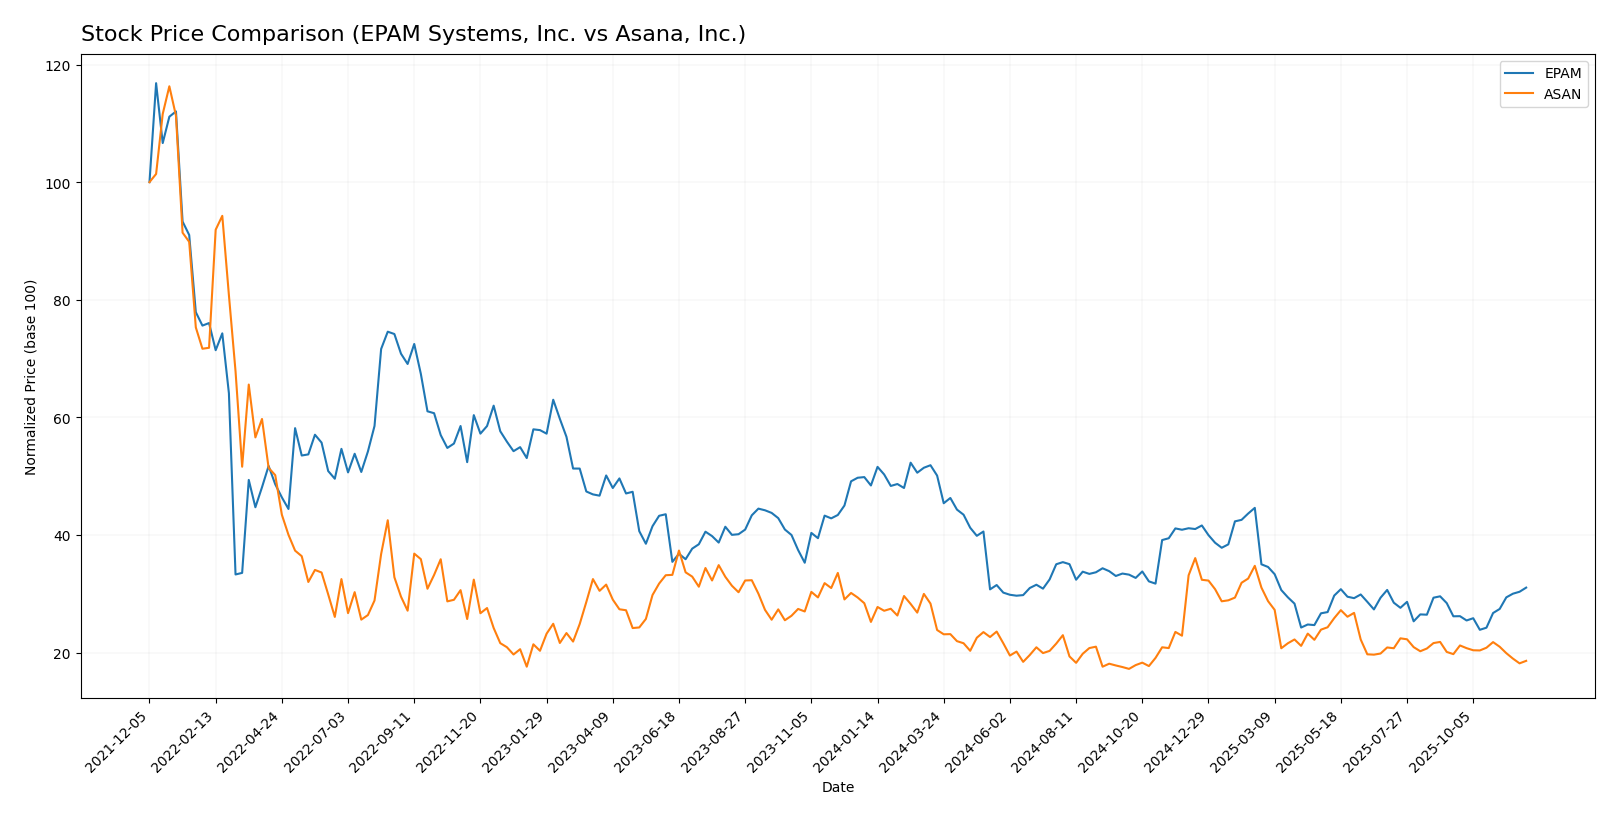
In this section, I will analyze the weekly stock price movements and trading dynamics of EPAM Systems, Inc. (EPAM) and Asana, Inc. (ASAN) over the past year, highlighting key price fluctuations and market trends.
Trend Analysis
EPAM Systems, Inc. (EPAM) Over the past year, EPAM’s stock has experienced a significant decrease of -35.89%, indicating a bearish trend. Notably, the stock reached a high of 311.98 and a low of 142.38. This trend is characterized by acceleration, suggesting a persistent decline in stock value. The standard deviation of 46.0 indicates considerable price volatility.
In the recent period from September 14, 2025, to November 30, 2025, there has been a positive price change of 18.64%, which, while encouraging, does not alter the overall bearish outlook. The trend slope is 3.21, signaling a potential rebound in the short term.
Asana, Inc. (ASAN) In contrast, ASAN’s stock has fallen by -26.27% over the past year, also reflecting a bearish trend. The highest price observed was 24.15, with a low of 11.53. The trend is noted for deceleration, suggesting that the rate of decline is slowing down. The standard deviation of 2.93 implies lower volatility compared to EPAM.
For the recent timeframe of September 14, 2025, to November 30, 2025, ASAN’s stock has decreased by -5.79%, with a trend slope of -0.12, indicating a slight downward movement. The current market conditions show that buyer dominance has weakened, with buyers accounting for only 26.28% of recent trades, highlighting a seller-dominant market environment.
Analyst Opinions
Recent analyst recommendations for EPAM Systems, Inc. (EPAM) show a positive outlook with a rating of B+. Analysts highlight strong discounted cash flow and return on assets, suggesting solid growth potential. Conversely, Asana, Inc. (ASAN) holds a D+ rating, indicating significant concerns regarding its financial metrics and overall performance. The consensus for EPAM is a “buy,” while ASAN is viewed as a “sell.” This divergence underscores the importance of careful selection in the current investing landscape.
Stock Grades
I have analyzed the latest available stock grades from reliable grading companies for EPAM Systems, Inc. and Asana, Inc. Here are the detailed ratings:
EPAM Systems, Inc. Grades
| Grading Company | Action | New Grade | Date |
|---|---|---|---|
| Mizuho | maintain | Outperform | 2025-11-11 |
| JP Morgan | maintain | Overweight | 2025-11-07 |
| Morgan Stanley | maintain | Equal Weight | 2025-09-09 |
| JP Morgan | maintain | Overweight | 2025-08-20 |
| Barclays | maintain | Overweight | 2025-05-12 |
| Needham | maintain | Buy | 2025-05-09 |
| Guggenheim | maintain | Buy | 2025-05-09 |
| Piper Sandler | maintain | Neutral | 2025-05-09 |
| Morgan Stanley | maintain | Equal Weight | 2025-05-09 |
| Stifel | maintain | Buy | 2025-05-02 |
Asana, Inc. Grades
| Grading Company | Action | New Grade | Date |
|---|---|---|---|
| Baird | maintain | Neutral | 2025-09-04 |
| Morgan Stanley | maintain | Underweight | 2025-09-04 |
| Piper Sandler | maintain | Overweight | 2025-09-04 |
| Baird | maintain | Neutral | 2025-06-04 |
| UBS | maintain | Neutral | 2025-06-04 |
| Jefferies | maintain | Hold | 2025-06-04 |
| RBC Capital | maintain | Underperform | 2025-06-04 |
| Morgan Stanley | maintain | Underweight | 2025-06-04 |
| JMP Securities | maintain | Market Outperform | 2025-06-04 |
| B of A Securities | maintain | Buy | 2025-06-04 |
Overall, EPAM Systems shows a consistent positive trend with multiple “Outperform” and “Overweight” ratings, indicating strong confidence from analysts. Conversely, Asana’s grades reflect a mixed sentiment with some “Underweight” ratings, suggesting caution in the market.
Target Prices
The current target price consensus for EPAM Systems, Inc. and Asana, Inc. reflects the expectations of market analysts.
| Company | Target High | Target Low | Consensus |
|---|---|---|---|
| EPAM Systems, Inc. | 185 | 175 | 180 |
| Asana, Inc. | 88 | 10 | 23.41 |
For EPAM Systems, analysts are projecting a consensus target price of 180, which is slightly below the current stock price of 185.5. In contrast, Asana has a target consensus of 23.41, indicating a significant upside potential from its current price of 12.475.
Strengths and Weaknesses
The following table outlines the strengths and weaknesses of EPAM Systems, Inc. and Asana, Inc. based on the most recent data.
| Criterion | EPAM Systems, Inc. | Asana, Inc. |
|---|---|---|
| Diversification | High | Moderate |
| Profitability | Moderate (9.6%) | Negative |
| Innovation | Strong | Moderate |
| Global presence | Strong | Limited |
| Market Share | Significant | Growing |
| Debt level | Low (4.4%) | High (54.1%) |
Key takeaways from this analysis reveal that while EPAM has a strong market presence and low debt levels, Asana is struggling with profitability and has higher debt, which may pose risks for investors.
Risk Analysis
In the following table, I present a breakdown of the key risks associated with two companies, EPAM Systems, Inc. and Asana, Inc.
| Metric | EPAM Systems, Inc. | Asana, Inc. |
|---|---|---|
| Market Risk | Moderate | High |
| Regulatory Risk | Low | Moderate |
| Operational Risk | Moderate | High |
| Environmental Risk | Low | Low |
| Geopolitical Risk | High | Moderate |
Both companies face significant market risk, especially Asana, which is currently underperforming with a D+ rating. EPAM’s geopolitical risk is elevated due to its operations in diverse regions, while Asana’s operational challenges and regulatory pressures contribute to its heightened risk profile.
Which one to choose?
In comparing EPAM Systems (EPAM) and Asana (ASAN), EPAM shows stronger fundamentals with a market cap of $13.4B and a B+ rating from analysts, reflecting solid performance in profitability and asset management. Its net profit margin stands at 9.61%, while ASAN, with a market cap of $4.9B and a D+ rating, struggles with negative margins and a reliance on external financing, as evidenced by its high debt-to-equity ratio of 1.18. EPAM’s stock trend has been bearish with a recent price change of -35.89%, yet its recent trend shows a potential recovery with an 18.64% increase. In contrast, ASAN has also faced bearish trends, with a recent decline of -5.79%.
Investors focused on growth may prefer EPAM due to its stronger fundamentals, while those prioritizing speculative plays might find ASAN appealing despite its risks. However, both companies face risks from competition and market volatility.
Disclaimer: This article is not financial advice. Each investor is responsible for their own investment decisions.
Go further
I encourage you to read the complete analyses of EPAM Systems, Inc. and Asana, Inc. to enhance your investment decisions: