In today’s fast-paced technology landscape, understanding the nuances between companies can be crucial for investment decisions. In this article, I will compare Elastic N.V. (ESTC) and MicroStrategy Incorporated (MSTR), both leaders in the software application industry, yet differing in their innovation strategies and market approaches. As both companies leverage data analytics to enhance their offerings, I aim to help you determine which one is the more intriguing investment opportunity. Let’s dive in!

Table of contents
Company Overview
Elastic N.V. Overview
Elastic N.V. (ticker: ESTC) is a technology company focused on delivering search and analytics solutions that operate across public and private cloud environments. Founded in 2012 and headquartered in Mountain View, California, Elastic’s core product, the Elastic Stack, includes tools like Elasticsearch for real-time data analysis, Kibana for visualization, and Beats for data shipping. Elastic aims to empower organizations to harness the power of their data through intuitive search capabilities and analytics, targeting various use cases such as app search and performance monitoring. The company has carved a niche in the software application industry, boasting a market cap of approximately $7.45B.
MicroStrategy Incorporated Overview
MicroStrategy Incorporated (ticker: MSTR), founded in 1989 and based in Tysons Corner, Virginia, is a leader in enterprise analytics software. The company provides a comprehensive platform that enables businesses to derive insights from data through advanced visualization, reporting, and mobile capabilities. MicroStrategy focuses on delivering a modern analytics experience to its users, including seamless access for data scientists and analysts. With a significant market cap of around $49.36B, MicroStrategy serves a diverse range of industries, emphasizing scalability and security in its offerings.
Key similarities and differences in their business models include both companies operating within the software application sector, but while Elastic focuses on search and analytics for varied data types, MicroStrategy emphasizes enterprise-level analytics with a broader range of consulting and educational services.
Income Statement Comparison
The following table compares the most recent income statements of Elastic N.V. and MicroStrategy Incorporated, highlighting key financial metrics.
| Metric | Elastic N.V. (ESTC) | MicroStrategy Inc. (MSTR) |
|---|---|---|
| Revenue | 1.48B | 463M |
| EBITDA | 6M | -1.85B |
| EBIT | -6M | -1.87B |
| Net Income | -108M | -1.17B |
| EPS | -1.04 | -6.06 |
Interpretation of Income Statement
In the most recent year, Elastic N.V. reported a revenue of 1.48B, significantly up from 1.27B the previous year, indicating a positive growth trend. However, their net income remains negative at -108M, reflecting ongoing challenges in profitability. In contrast, MicroStrategy’s revenue slightly declined to 463M, while it faced substantial losses with a net income of -1.17B, exacerbated by high operating expenses. The deterioration in both companies’ earnings highlights the need for careful assessment of their financial health and risk management strategies moving forward.
Financial Ratios Comparison
The table below presents a comparative analysis of key financial metrics for Elastic N.V. (ESTC) and MicroStrategy Incorporated (MSTR) as of 2025.
| Metric | [Company A: ESTC] | [Company B: MSTR] |
|---|---|---|
| ROE | -11.66% | -6.40% |
| ROIC | -11.80% | -4.38% |
| P/E | -82.65 | -47.80 |
| P/B | 9.64 | 3.06 |
| Current Ratio | 1.92 | 0.71 |
| Quick Ratio | 1.92 | 0.71 |
| D/E | 0.64 | 0.40 |
| Debt-to-Assets | 0.23 | 0.28 |
| Interest Coverage | -2.17 | -29.92 |
| Asset Turnover | 0.57 | 0.02 |
| Fixed Asset Turnover | 51.28 | 5.73 |
| Payout Ratio | 0% | 0% |
| Dividend Yield | 0% | 0% |
Interpretation of Financial Ratios
Both companies exhibit challenging financial health indicators. ESTC’s high P/B ratio suggests overvaluation relative to its book value, while its negative ROE and ROIC signal persistent losses, raising concerns about profitability. MSTR shares similar patterns, with alarming negative figures across key ratios, indicating significant operational challenges. Notably, MSTR’s excessive debt levels and negative interest coverage underline critical liquidity risks. Investors should approach both stocks with caution and consider the implications of these ratios in their decision-making process.
Dividend and Shareholder Returns
Both Elastic N.V. (ESTC) and MicroStrategy Incorporated (MSTR) do not pay dividends, focusing instead on reinvestment to fuel growth. ESTC, grappling with negative net income, prioritizes research and development, which may align with long-term value creation despite the absence of dividends. MSTR, similarly, has a negative net margin but engages in share buybacks, indicating a commitment to enhancing shareholder value. This lack of dividends can be risky, yet both companies aim for sustainable growth through strategic reinvestment.
Strategic Positioning
Elastic N.V. (ESTC) holds a notable position in the software application market, focusing on search and data analytics solutions through its Elastic Stack. It faces competitive pressure from established players like MicroStrategy (MSTR), which specializes in enterprise analytics. MSTR’s significant market cap of 49.4B reflects its strong market presence. Both companies must navigate technological disruptions and evolving customer needs, making innovation a key priority to maintain and grow their market shares.
Stock Comparison
In this section, I will analyze the weekly stock price movements of Elastic N.V. (ESTC) and MicroStrategy Incorporated (MSTR) over the past year, highlighting significant price dynamics and trading behaviors.
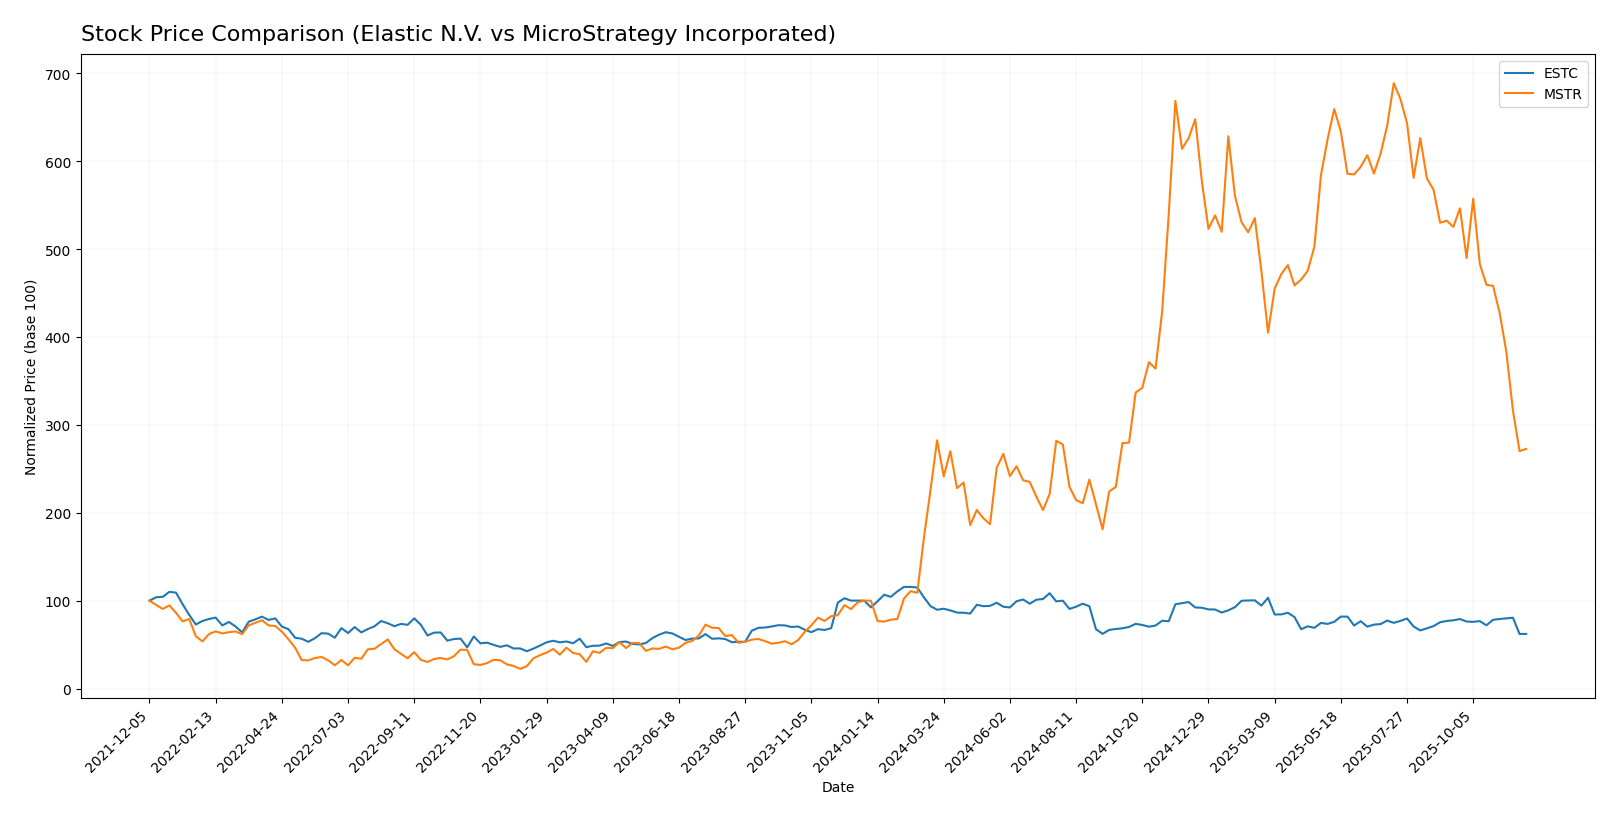
Trend Analysis
Elastic N.V. (ESTC) Over the past year, ESTC has experienced a price change of -32.66%, indicating a bearish trend. During this period, the stock reached a high of 130.39 and a low of 70.04, reflecting notable volatility with a standard deviation of 14.91. The recent trend from September 14, 2025, to November 30, 2025, shows a further decline of -19.92%, with a standard deviation of 6.91. This suggests a deceleration in the downward trend, as indicated by the trend slope of -1.02.
MicroStrategy Incorporated (MSTR) In contrast, MSTR has seen a significant price increase of 172.67% over the past year, showcasing a bullish trend. The stock’s price fluctuated between a high of 434.58 and a low of 48.1, with a high level of volatility represented by a standard deviation of 113.26. However, the recent trend analysis from September 14, 2025, to November 30, 2025, indicates a sharp decline of -48.08%, with a standard deviation of 60.99, suggesting a deceleration in its previous upward momentum, as denoted by the trend slope of -16.58.
In summary, while ESTC is firmly in a bearish trend with signs of deceleration, MSTR’s substantial yearly gains are currently overshadowed by a recent downturn, highlighting the importance of monitoring these trends closely for informed investment decisions.
Analyst Opinions
Recent analyst recommendations for Elastic N.V. (ESTC) reflect a cautious outlook, with a rating of C-. Analysts highlight concerns over low scores in return on equity and overall financial health. MicroStrategy Incorporated (MSTR) has received a slightly better rating of C, but analysts note weaknesses in discounted cash flow metrics. The consensus for both companies leans towards a hold position for the current year, as investors are advised to monitor their financial recoveries closely before making substantial investments.
Stock Grades
Recent stock ratings indicate a cautious yet stable outlook for both Elastic N.V. and MicroStrategy Incorporated. Here’s a breakdown of the grades from recognized grading companies.
Elastic N.V. Grades
| Grading Company | Action | New Grade | Date |
|---|---|---|---|
| Citigroup | maintain | Buy | 2025-11-24 |
| JP Morgan | maintain | Overweight | 2025-11-21 |
| Piper Sandler | maintain | Overweight | 2025-11-21 |
| Cantor Fitzgerald | maintain | Neutral | 2025-11-21 |
| Wells Fargo | maintain | Equal Weight | 2025-11-21 |
| DA Davidson | maintain | Neutral | 2025-11-21 |
| Stifel | maintain | Buy | 2025-11-21 |
| Morgan Stanley | maintain | Overweight | 2025-11-21 |
| Truist Securities | maintain | Buy | 2025-11-21 |
| Guggenheim | maintain | Buy | 2025-11-21 |
MicroStrategy Incorporated Grades
| Grading Company | Action | New Grade | Date |
|---|---|---|---|
| Monness, Crespi, Hardt | upgrade | Neutral | 2025-11-10 |
| HC Wainwright & Co. | maintain | Buy | 2025-11-03 |
| Canaccord Genuity | maintain | Buy | 2025-11-03 |
| BTIG | maintain | Buy | 2025-10-31 |
| TD Cowen | maintain | Buy | 2025-10-31 |
| Cantor Fitzgerald | maintain | Overweight | 2025-10-31 |
| Wells Fargo | downgrade | Equal Weight | 2025-09-30 |
| TD Cowen | maintain | Buy | 2025-09-16 |
| Canaccord Genuity | maintain | Buy | 2025-08-26 |
| Mizuho | maintain | Outperform | 2025-08-11 |
Overall, Elastic N.V. shows a consistent grade maintenance with a slight emphasis on buying, while MicroStrategy demonstrates a mix of upgrades and downgrades, indicating a potential shift in investor sentiment. It’s essential to monitor these trends as they could affect investment decisions moving forward.
Target Prices
The consensus target prices from reliable analysts for Elastic N.V. and MicroStrategy Incorporated are as follows:
| Company | Target High | Target Low | Consensus |
|---|---|---|---|
| Elastic N.V. (ESTC) | 134 | 76 | 108 |
| MicroStrategy Inc. (MSTR) | 705 | 175 | 478.5 |
The overall analyst expectations indicate a bullish outlook for both companies. Elastic N.V. has a target consensus of 108, suggesting potential upside from its current price of 70.095. Meanwhile, MicroStrategy’s target consensus of 478.5 implies significant growth potential compared to its current price of 171.85.
Strengths and Weaknesses
The following table outlines the strengths and weaknesses of Elastic N.V. (ESTC) and MicroStrategy Incorporated (MSTR), based on the most recent financial data available.
| Criterion | Elastic N.V. (ESTC) | MicroStrategy Incorporated (MSTR) |
|---|---|---|
| Diversification | Moderate | Low |
| Profitability | Negative margins | Negative margins |
| Innovation | High | Moderate |
| Global presence | Strong | Moderate |
| Market Share | Niche | Niche |
| Debt level | Moderate (0.23) | High (0.47) |
Key takeaways from this analysis indicate that while both companies are experiencing challenges with profitability, Elastic shows stronger innovation and global presence. However, MicroStrategy has higher debt levels that may pose risks.
Risk Analysis
In the table below, I outline the various risks associated with Elastic N.V. (ESTC) and MicroStrategy Incorporated (MSTR) based on the most recent data.
| Metric | Elastic N.V. (ESTC) | MicroStrategy Incorporated (MSTR) |
|---|---|---|
| Market Risk | Medium | High |
| Regulatory Risk | Medium | Medium |
| Operational Risk | High | High |
| Environmental Risk | Low | Low |
| Geopolitical Risk | Medium | High |
Both companies face significant operational and market risks, particularly in the volatile tech sector. MSTR’s reliance on cryptocurrencies adds a layer of geopolitical risk as regulatory scrutiny increases globally.
Which one to choose?
In comparing Elastic N.V. (ESTC) and MicroStrategy Incorporated (MSTR), distinct differences emerge. ESTC has recently shown a bearish trend with a 32.66% decline in price over the past year, alongside a C- rating from analysts, reflecting challenges in profitability with negative net margins and significant debt concerns. In contrast, MSTR has experienced a bullish trend with a 172.67% price increase, although it faces high volatility and recent downturns. It holds a C rating, indicating similar issues with profitability but slightly better debt metrics.
For investors focused on growth and willing to accept volatility, MSTR may be appealing; however, those prioritizing stability might consider ESTC, albeit with caution due to its ongoing financial struggles. Both companies face industry risks, including market competition and dependency on technology advancements.
Disclaimer: This article is not financial advice. Each investor is responsible for their own investment decisions.
Go further
I encourage you to read the complete analyses of Elastic N.V. and MicroStrategy Incorporated to enhance your investment decisions: