In the dynamic landscape of the uranium industry, two companies stand out: Cameco Corporation (CCJ) and enCore Energy Corp. (EU). Both firms are engaged in uranium production and exploration, yet they adopt distinct strategies to navigate market challenges and opportunities. As we delve into this comparison, I’ll highlight their innovative approaches and market positions, helping you, the investor, determine which company may be the most appealing addition to your portfolio.
Table of contents
Company Overview
Cameco Corporation Overview
Cameco Corporation (CCJ) is a prominent player in the uranium industry, actively involved in the production and sale of uranium. Headquartered in Saskatoon, Canada, the company operates through two main segments: Uranium and Fuel Services. The Uranium segment focuses on the exploration, mining, and milling of uranium concentrate, while the Fuel Services segment specializes in refining and fabricating uranium for nuclear reactors. With a market capitalization of approximately $37.8B and a strategic focus on serving nuclear utilities across the Americas, Europe, and Asia, Cameco is well-positioned to capitalize on the growing demand for clean energy solutions.
enCore Energy Corp. Overview
enCore Energy Corp. (EU), based in Corpus Christi, Texas, is dedicated to the acquisition, exploration, and development of uranium resource properties primarily in the United States. The company holds significant interests in several key projects, including Crownpoint and Hosta Butte in New Mexico, as well as the Dewey Burdock project in South Dakota. With a market capitalization of around $485M, enCore is actively expanding its footprint in the uranium sector, targeting key regions to enhance its resource base and cater to the increasing demand for uranium in the energy market.
Both Cameco and enCore operate within the uranium industry, focusing on different aspects of the supply chain. While Cameco is heavily involved in both mining and fuel services on a global scale, enCore primarily concentrates on resource acquisition and development within the United States. Their differing scales and operational strategies highlight the diverse opportunities within the uranium market.
Income Statement Comparison
Below is a comparison of the most recent income statements for Cameco Corporation (CCJ) and enCore Energy Corp. (EU). This table highlights key financial metrics that can help investors assess each company’s performance.
| Metric | Cameco Corporation (CCJ) | enCore Energy Corp. (EU) |
|---|---|---|
| Revenue | 3.14B | 58.33M |
| EBITDA | 789.34M | -67.59M |
| EBIT | 474.91M | -72.19M |
| Net Income | 171.85M | -61.39M |
| EPS | 0.40 | -0.34 |
Interpretation of Income Statement
In the most recent fiscal year, Cameco Corporation demonstrated strong revenue growth, increasing from 2.59B in 2023 to 3.14B in 2024, while net income declined from 360.85M to 171.85M, indicating a significant drop in profitability. Conversely, enCore Energy Corp. showed a modest revenue increase, but it remained in the negative, with a net loss of 61.39M. The EBITDA for CCJ remained positive, suggesting operational efficiency, while enCore’s negative EBITDA indicates ongoing challenges in cost management. Overall, CCJ’s financial health appears robust, while EU continues to face hurdles that may require strategic adjustments for improvement.
Financial Ratios Comparison
In the table below, I present a comparison of key financial ratios for Cameco Corporation (CCJ) and enCore Energy Corp. (EU) based on the most recent available data.
| Metric | Cameco Corporation (CCJ) | enCore Energy Corp. (EU) |
|---|---|---|
| ROE | 2.7% | -21.5% |
| ROIC | 3.8% | -17.3% |
| P/E | 187.0 | -22.1 |
| P/B | 5.0 | 2.2 |
| Current Ratio | 1.62 | 2.91 |
| Quick Ratio | 0.80 | 2.21 |
| D/E | 0.20 | 0.08 |
| Debt-to-Assets | 13.1% | 6.0% |
| Interest Coverage | 3.98 | -41.6 |
| Asset Turnover | 0.32 | 0.07 |
| Fixed Asset Turnover | 0.95 | 0.20 |
| Payout Ratio | 40.5% | 0% |
| Dividend Yield | 0.22% | 0% |
Interpretation of Financial Ratios
Cameco Corporation showcases stronger financial health with positive ROE, ROIC, and adequate coverage ratios, indicating efficient asset utilization and solid profitability. In contrast, enCore Energy Corp. presents concerning ratios, particularly with negative profitability metrics and a high P/E ratio, signaling potential risks. Investors should approach enCore with caution due to its financial instability, as indicated by its negative earnings and cash flow ratios.
Dividend and Shareholder Returns
Cameco Corporation (CCJ) distributes dividends with a payout ratio of 40.5% and a yield of 0.22%. The company has been consistent in its dividend payments, supported by a solid free cash flow coverage. However, potential risks include reliance on commodity prices which could affect sustainability.
In contrast, enCore Energy Corp. (EU) does not pay dividends, reflecting its focus on reinvestment for growth during its high-risk phase. The absence of dividends suggests prioritization of R&D and expansion. Neither company currently engages in share buybacks. Ultimately, CCJ’s dividend approach fosters long-term shareholder value, while EU’s strategy may align better with aggressive growth objectives.
Strategic Positioning
Cameco Corporation (CCJ) holds a dominant position in the uranium market with a market cap of 37.8B, benefiting from its extensive operational experience and diverse offerings in uranium and fuel services. In contrast, enCore Energy Corp. (EU), with a market cap of 485M, is positioned as a growing player focusing on uranium resource properties in the U.S. Both companies face competitive pressure and technological disruptions as the market evolves, but Cameco’s established presence provides a strong benchmark for enCore’s growth potential.
Stock Comparison
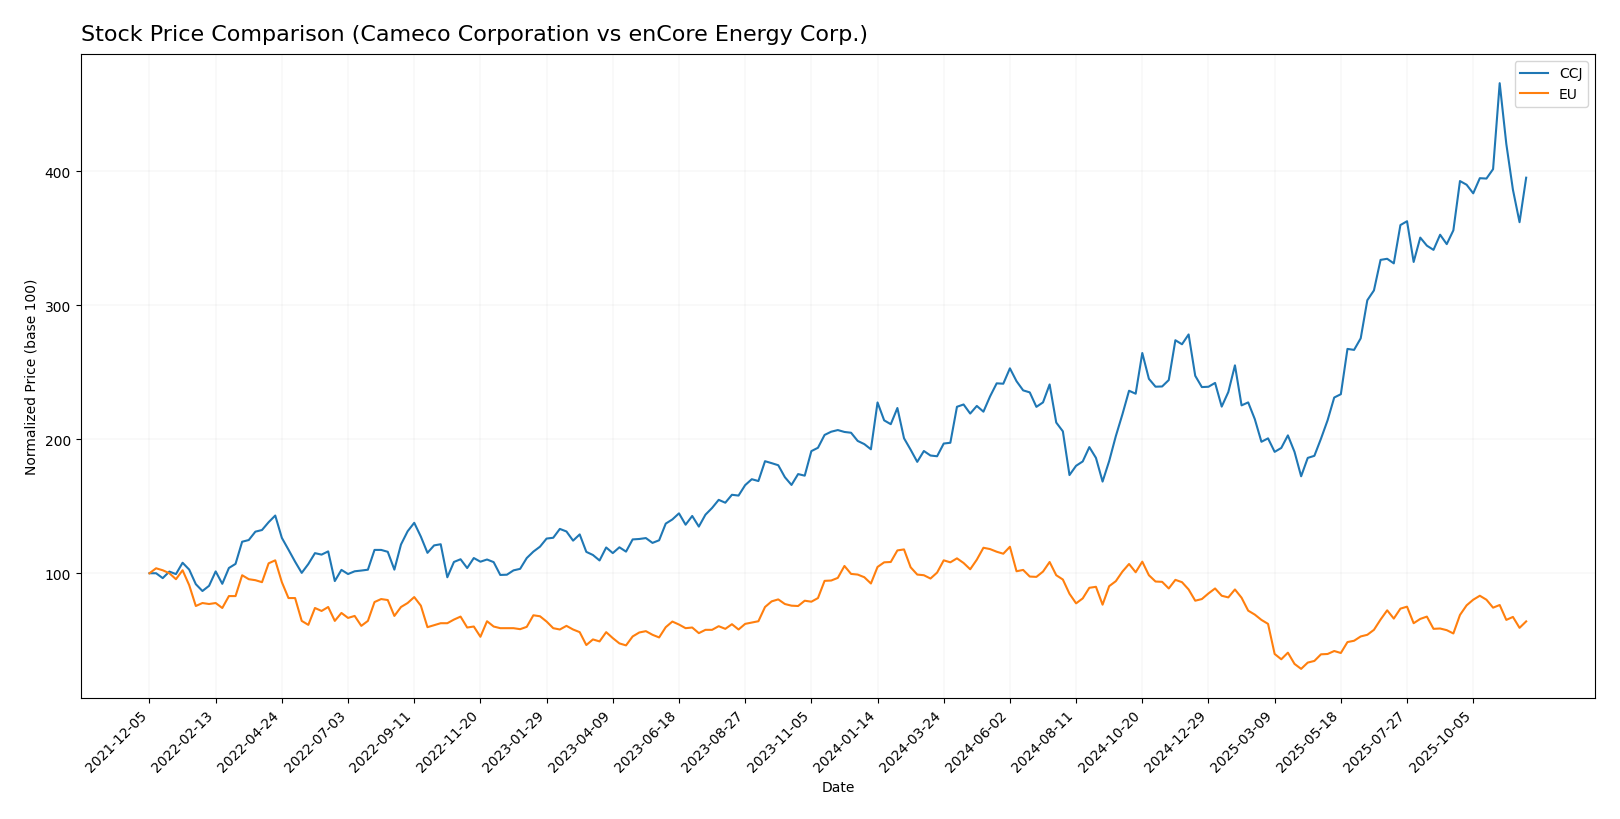
In this section, I will examine the weekly stock price movements of Cameco Corporation (CCJ) and enCore Energy Corp. (EU) over the past year, highlighting key trends and trading dynamics that have influenced their performance.
Trend Analysis
Cameco Corporation (CCJ) Over the past year, CCJ has experienced a remarkable price change of +105.28%, indicating a bullish trend. The stock has demonstrated acceleration in its upward movement, with notable highs reaching 102.21 and lows of 36.96. The standard deviation of 15.32 suggests a considerable amount of volatility, reflecting the dynamic nature of its trading environment. Recently, from September 14 to November 30, 2025, the stock achieved a further increase of 11.04%, supporting the ongoing bullish sentiment.
enCore Energy Corp. (EU) In contrast, EU has faced a challenging year with a price decline of -30.61%, categorizing it as a bearish trend. This downward movement has also shown acceleration, with the stock fluctuating between a high of 4.85 and a low of 1.16. The standard deviation of 0.96 indicates a relatively stable trading environment despite the overall decline. Interestingly, in the recent period from September 14 to November 30, 2025, EU saw a price increase of 16.37%, but the overall trend remains bearish, suggesting ongoing challenges for the company.
In summary, while CCJ shows strong upward momentum, EU’s recovery efforts are overshadowed by its overall bearish trajectory.
Analyst Opinions
Recent evaluations indicate mixed sentiments for Cameco Corporation (CCJ) and enCore Energy Corp. (EU). Analysts suggest a “Buy” recommendation for CCJ, highlighting strong return on assets and manageable debt levels, despite lower price-to-earnings and price-to-book scores. Conversely, EU has received a “Sell” rating, with analysts pointing to poor performance across key metrics, including discounted cash flow and return on equity. Overall, the consensus for CCJ leans towards a buy, while EU strongly indicates a sell for 2025.
Stock Grades
In this section, I present the latest stock ratings for Cameco Corporation (CCJ) and enCore Energy Corp. (EU), reflecting the current sentiment from reputable grading companies.
Cameco Corporation Grades
| Grading Company | Action | New Grade | Date |
|---|---|---|---|
| RBC Capital | maintain | Outperform | 2025-11-13 |
| RBC Capital | maintain | Outperform | 2025-10-31 |
| Goldman Sachs | maintain | Buy | 2025-10-29 |
| RBC Capital | maintain | Outperform | 2025-08-01 |
| RBC Capital | maintain | Outperform | 2025-06-20 |
| GLJ Research | maintain | Buy | 2025-06-12 |
| Goldman Sachs | maintain | Buy | 2025-06-11 |
| GLJ Research | maintain | Buy | 2025-03-12 |
| RBC Capital | maintain | Outperform | 2025-03-04 |
| Scotiabank | maintain | Outperform | 2024-08-19 |
enCore Energy Corp. Grades
| Grading Company | Action | New Grade | Date |
|---|---|---|---|
| HC Wainwright & Co. | maintain | Buy | 2025-08-12 |
| HC Wainwright & Co. | maintain | Buy | 2025-05-13 |
| HC Wainwright & Co. | maintain | Buy | 2025-03-18 |
| HC Wainwright & Co. | maintain | Buy | 2024-11-19 |
| HC Wainwright & Co. | maintain | Buy | 2024-10-07 |
| HC Wainwright & Co. | maintain | Buy | 2024-08-15 |
| HC Wainwright & Co. | maintain | Buy | 2024-06-14 |
| B. Riley Securities | maintain | Buy | 2024-05-15 |
Overall, both CCJ and EU show a consistent trend of ratings that indicate a positive outlook, with multiple maintain recommendations from reputable analysts. Notably, CCJ has received a mix of “Outperform” and “Buy” ratings, suggesting robust confidence in its performance, while EU has been rated as “Buy” consistently, reflecting strong investor sentiment.
Target Prices
A consensus target price has been established for both companies, indicating optimistic future potential.
| Company | Target High | Target Low | Consensus |
|---|---|---|---|
| Cameco Corporation (CCJ) | 109 | 70 | 95.75 |
| enCore Energy Corp. (EU) | 7 | 7 | 7 |
Analysts project a significant upside for Cameco Corporation, with a consensus target of 95.75 compared to its current price of 86.74. In contrast, enCore Energy is expected to stabilize at 7, matching its current price of 2.59.
Strengths and Weaknesses
The following table outlines the strengths and weaknesses of Cameco Corporation (CCJ) and enCore Energy Corp. (EU) based on the most recent data.
| Criterion | Cameco Corporation (CCJ) | enCore Energy Corp. (EU) |
|---|---|---|
| Diversification | Strong uranium portfolio | Focused on U.S. projects |
| Profitability | Net margin: 14% | Negative profit margins |
| Innovation | Advanced mining techniques | Limited R&D investment |
| Global presence | Operations in multiple countries | Primarily U.S.-focused |
| Market Share | Leading in uranium sector | Growing market share |
| Debt level | Low (Debt-to-Equity: 0.20) | Very low (Debt-to-Equity: 0.07) |
Key takeaways: Cameco Corporation demonstrates stronger profitability and global presence compared to enCore Energy Corp., which has a more focused but limited operational scope. Investors should weigh these factors carefully when considering their portfolios.
Risk Analysis
In the table below, I outline the key risks associated with each company.
| Metric | Cameco Corporation (CCJ) | enCore Energy Corp. (EU) |
|---|---|---|
| Market Risk | Moderate | High |
| Regulatory Risk | High | Moderate |
| Operational Risk | Moderate | High |
| Environmental Risk | High | Moderate |
| Geopolitical Risk | Moderate | High |
Both companies face significant risks, particularly in regulatory and market dynamics. Cameco’s exposure to regulatory challenges in the uranium industry is considerable, while enCore Energy grapples with higher operational and market risks, especially given its recent financial instability. Careful assessment and risk management are essential for potential investors.
Which one to choose?
When comparing Cameco Corporation (CCJ) and enCore Energy Corp. (EU), the fundamentals indicate that CCJ appears to be a more stable investment option. CCJ has a market cap of 32.1B, a gross profit margin of 33.9%, and a rating of B- from analysts, reflecting solid financial health. In contrast, EU faces challenges with a market cap of 620M and a negative gross profit margin of -12.4%, resulting in a C- rating. The stock trend for CCJ is bullish, with a price increase of 105.3% recently, while EU has experienced a bearish trend with a decline of 30.6%.
Investors focused on growth may prefer CCJ due to its strong fundamentals and positive trend, while those prioritizing high-risk, high-reward opportunities may consider EU, despite its current challenges. Both companies face risks related to market dependence and competition.
Disclaimer: This article is not financial advice. Each investor is responsible for their own investment decisions.
Go further
I encourage you to read the complete analyses of Cameco Corporation and enCore Energy Corp. to enhance your investment decisions: