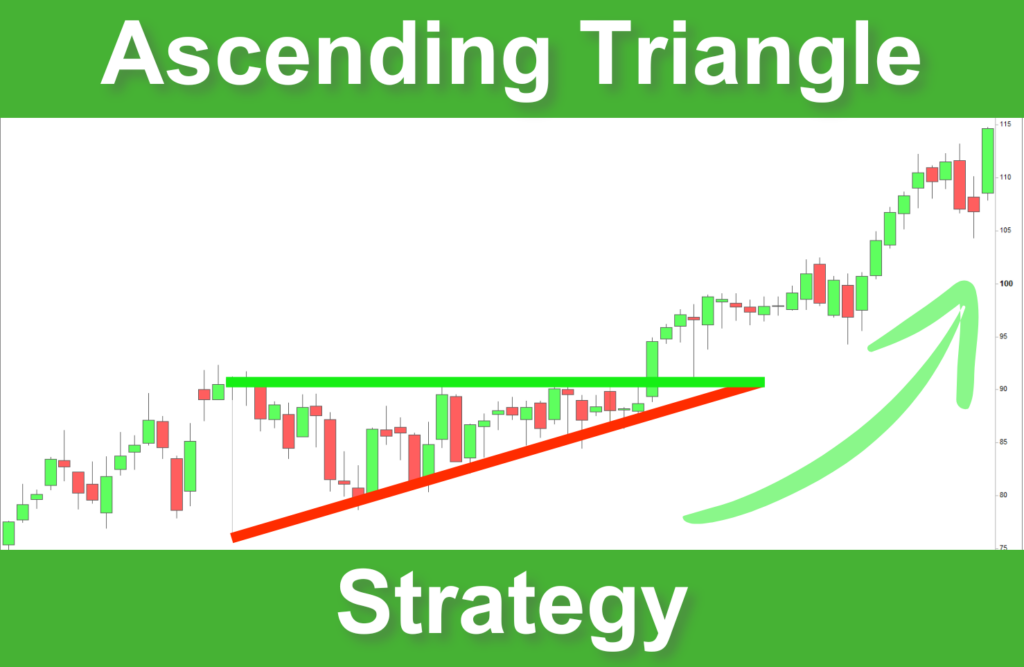
Benefit from the uptrend resumption
The ascending triangle is a figure to know in trading. You can use them to capitalize on the resumption of the uptrend. But be careful. If triangles give reliable buying signals, they can be traps. There are things you need to know about this figure before using it. In this article, I will show you how to trade ascending triangles well. I will tell you everything you need to know to leverage this figure’s potential while avoiding the pitfalls.
What is an ascending triangle?
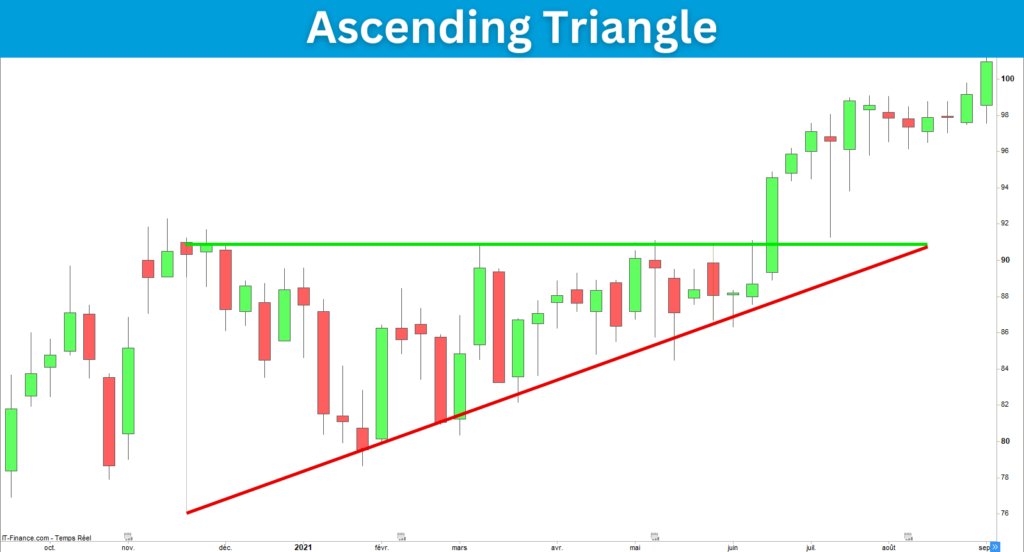
The ascending triangle is shaped by two lines: a horizontal resistance and an ascending oblique. These two lines form a right triangle shape pointing to the right:
How to identify an ascending triangle?
Identifying an ascending triangle is pretty simple once you know what to look for. First, you must identify areas where the price is stuck under a horizontal resistance. Then, see if the price increases and compresses under this resistance. If so, try to connect the lows with a rising oblique. The pattern obtained by the horizontal resistance and the rising oblique should look like a triangle.
Key features of the ascending triangle
Here are the key features of the ascending triangle pattern:
Drawing the resistance and the oblique correctly
Resistance
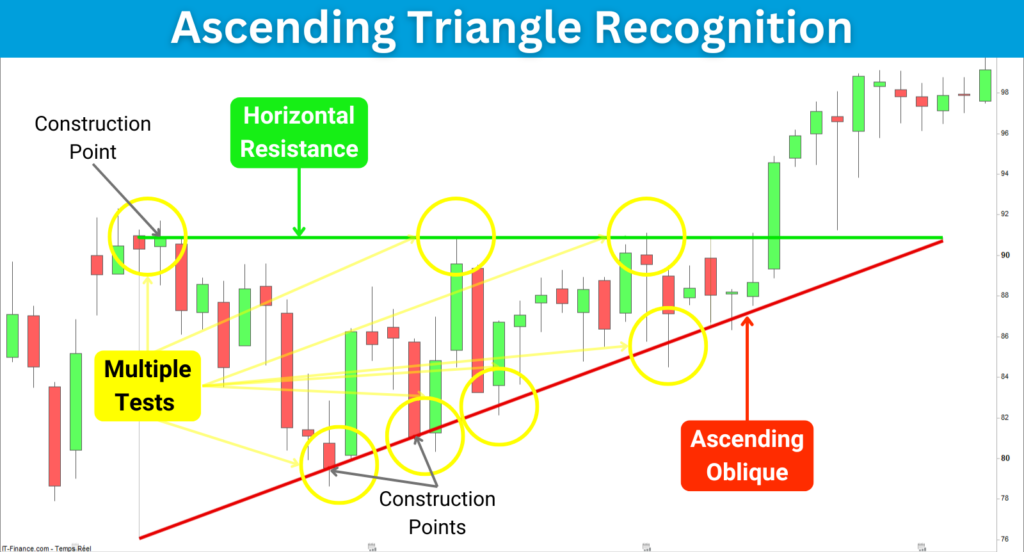
To correctly draw the resistance, you need to find the closing price that maximizes the number of tests of the line and minimizes the number of candles whose price is above this line.
Oblique
To correctly draw the ascending oblique, you need to find two points of construction of the line to maximize the number of tests of this line and minimize the number of candles whose price is below this line.
The following image shows the construction points of an ascending triangle:
What is an ascending triangle breakout?
Think of an ascending triangle as a pressure cooker. The market pushes higher, but a resistance level acts as a ceiling. Buyers are getting stronger, pushing prices up with higher lows, but sellers hold the fort at a fixed resistance level. Eventually, the pressure builds up so much that something has to give. When buyers finally overcome the resistance, we get a breakout—and that’s where the opportunity lies!
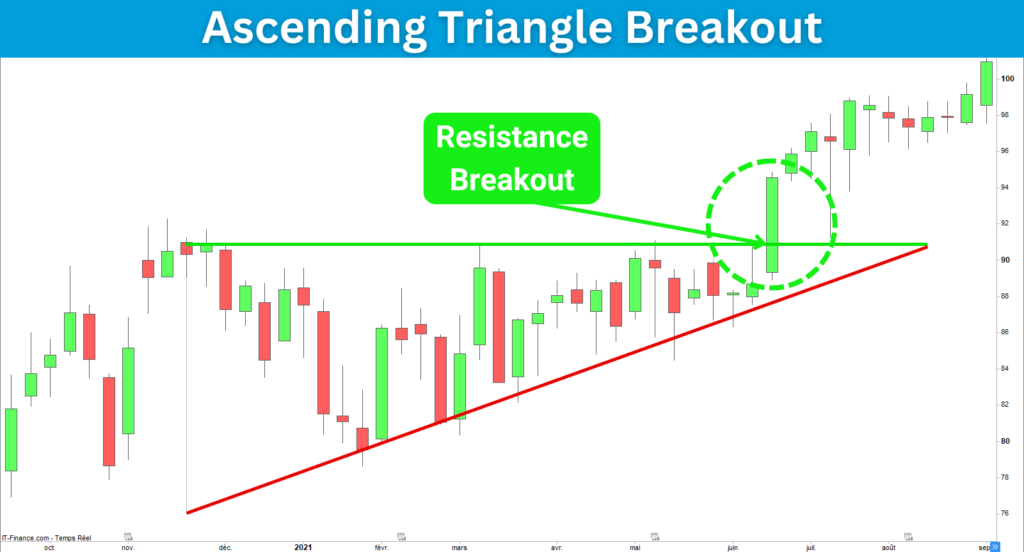
The breakout happens when the price breaks up the horizontal resistance. That signals the uptrend restarting. You will place a buying order to capitalize on the upcoming price movement.
Here is an example of an ascending triangle breakout:
⚠️ Beware of volatility! ⚠️
One of the particularities of the ascending triangle is the volatility that occurs after its break. It is common to see the price abruptly break the horizontal resistance and retrace just as abruptly before breaking again upwards. If you trade ascending triangles, you must prepare yourself psychologically for strong price movements.
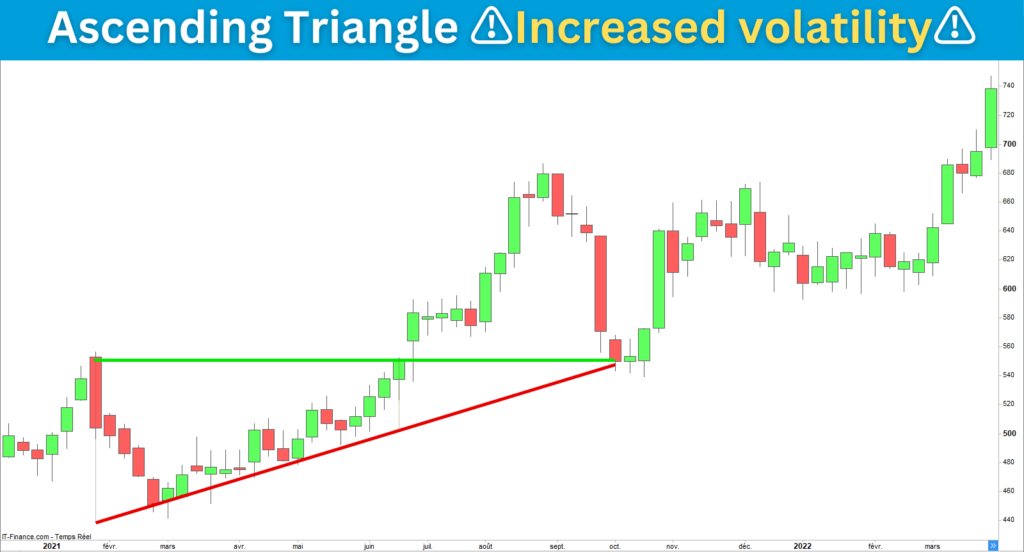
Don’t worry. I will give you tips to help you manage this volatility. 😉
My trading strategy for an ascending triangle breakout
Now that you know how ascending triangles work, I will get down to business. I’m going to show you how to trade ascending triangles with confidence, step by step:
1. Spot the ascending triangle
The first step you have to take is to draw the ascending triangle on your chart. You can do this manually or use an indicator like the Ultimate Breaker. You must identify a flat resistance and connect the lows to obtain an ascending trendline. Extend both lines to the right until they meet at a point.
2. Waiting for the breakout
Don’t anticipate the breakout. You should wait for a clear breakout of the resistance. That is to say, wait for the price to close above the resistance before entering your trade. If you are impatient, you risk being caught off guard by fakeouts.
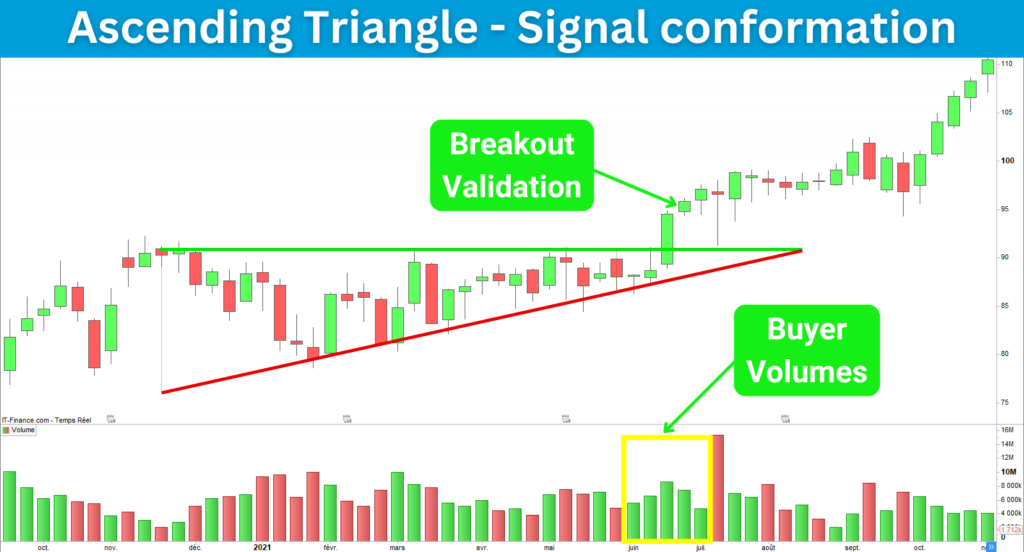
3. Validate the move
Not all signals are good to take. Sometimes, after a breakout, the price retraces. You need to evaluate whether the triangle breakout is truly worthwhile.
Here are some tips that will help you decide whether to open a position:
- You can wait for the price following the breakout closes above the resistance to validate the signal.
- You can ensure high volumes accompany the breakout to avoid fakeouts.
4. Enter the trade
You have patiently waited for the breakout before opening a position, which is very good! The time has come to open a position. I will present the classical way to enter a trade and explain why I do not follow it. Then, I will share with you my method to manage my entries.
The classical way
There are two schools of thought: some recommend opening the position right after the breakout, and others wait for the retest of the resistance. I consider that these two approaches are not fully adapted to ascending triangles, and here is why:
- If you open a position immediately after the breakout, you take the risk of seeing your position retraced.
- If you wait for a retest, you could miss the trade because the retest does not always happen.
My personal method
I propose an alternative method that I consider more suitable for ascending triangles: these are progressive entries. This method involves entering entries depending on the market. The most straightforward approach involves opening an entry each time the candle closes above the resistance level. You could also open an entry with every two candles.
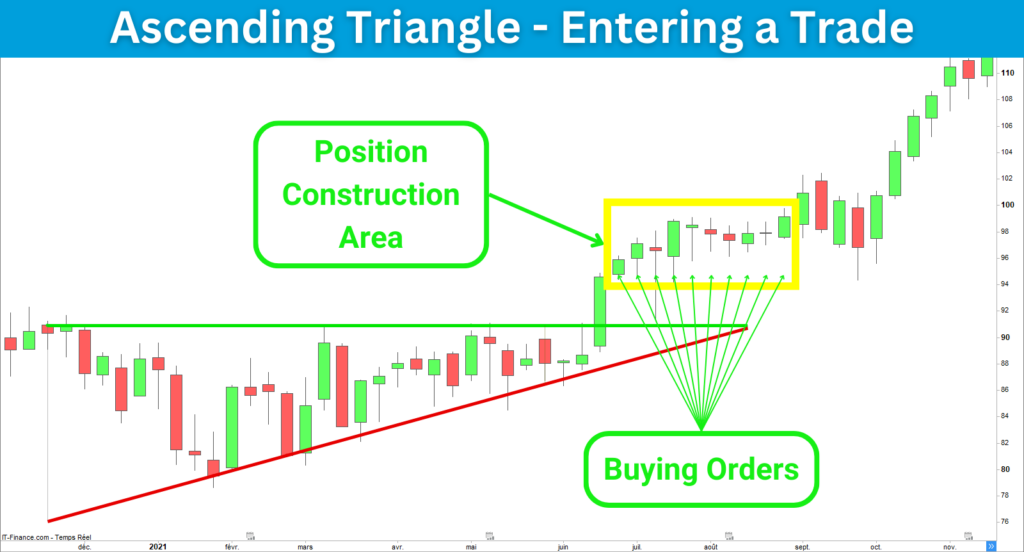
Another approach could be to open an entry after each signal: breakout, validated breakout, retest, and validated retest. In this way, you master your risk while being sure to seize the opportunity.
5. Set the stop-loss
Placing a stop-loss on an ascending triangle is delicate. The shrinking price will incite you to put your stop-loss too close to the resistance. That is why numerous traders get trapped.
⚠️ Beware of the stop hunting! ⚠️
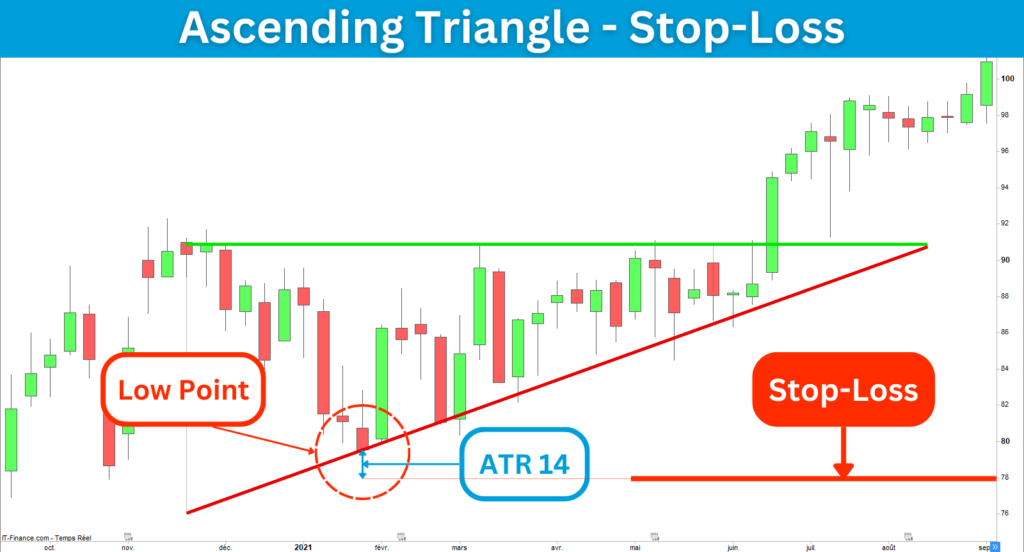
I often observed the market drawing a deep wick just after the breakout. Even if the ascending triangle is a triangle, the best way to place the stoploss is to consider this figure as a range. That means you should set your stoploss under the bottom of the triangle’s low point. This position can seem too low, but it can be acceptable depending on where you will set the target. You will raise the stoploss after the confirmation of the uptrend restarting.
The following image shows where you should put your stop-loss:
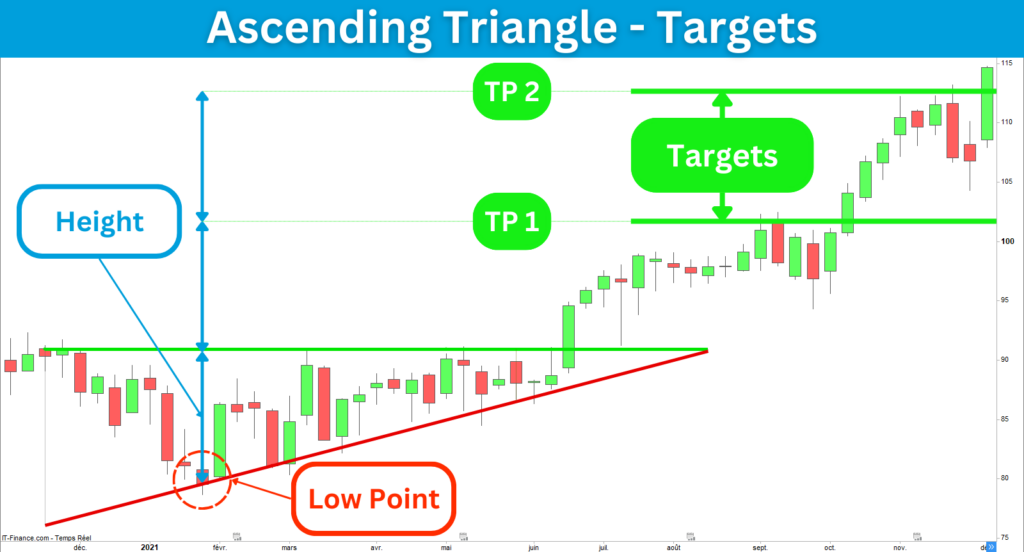
6. Set the profit targets
Finding the best target level is easier than setting the stop-loss. As with the stop-loss, you must consider the triangle a range to determine the target. If you have ensured the trend is bullish before entering a trade, you will easily target two times the triangle height. In this case, placing the stop-loss under the low will not be a problem. The risk-to-reward ratio will be approximately 2.
The triangle height corresponds to the distance between the low and the resistance. You will report this distance from the resistance level to find the target.
The following image shows where you should put your targets:
7. Monitor your position
After entering the trade comes monitoring. It is a critical phase you have to master. Monitoring a position involves several key activities: confirming the position, implementing risk management, and determining the exit strategy.
a. Confirming the position
You must ensure the market confirms the trend restarting. It can be delicate due to the increased volatility. That is one of the particularities of the ascending triangle. That is why it can be judicious to check strength and momentum indicators. You can employ the volumes, RSI, MACD, and Stochastic to monitor your position. While the market stays strong and bullish, you can keep your entry until the initial target.
b. Risk management
You can progressively increase your stoploss while the price rises to secure your position. After a while, your latent profit will be secured. In an intraday position case, that guarantees you will make a profit, whatever happens. In a swing trading case, your latent profit is partially secured because of the bearish gap risk.
c. Position exit
You have two possibilities to exit your position: close your entire position or partially close the position:
Entire closing
When the price touches the final target, you must evaluate whether the market could go further or not. If you don’t reach a decision, you could place the stop-loss some points below the last candle’s closing price. In this case, if the market continues to rise, you will make more money, and if it decreases, you will take your profits.
Repeat this operation until the market touches the stop-loss and closes your entry. Sometimes, you will have good news. I practiced this way many times in day trading, and I already saw the market take 200 points on one alone candle after I had raised the stop-loss.
Partial closing
When the market reaches an intermediate target or resistance, it may be justified to close your position partially. First, you must evaluate whether the market will break this intermediate level. If you think the market will break this price, keep your position. If not, you can sell half of your position to secure the latent profit.
Four common mistakes to avoid
Trading requires discipline. Only one mistake can destroy your capital. Here are the common mistakes you should avoid:
Seven tips to improve your performance
Not all breakouts are created equal. Each situation is specific. You can improve your performance by analyzing the technical configuration. Here are some tips that will help you better trade the ascending triangles:
Ascending Triangle Summary
Breakouts of ascending triangles give profitable signals for trend continuation and resumption.
However, you must be aware of the increase in volatility following the breakout.
Positioning your stop-loss well will determine the outcome of your trade.
Building a position will allow you to profit from the signal while reducing risk.
If you are interested in trading ascending triangles, I have created an indicator to help you. It displays the triangles, the breakout signals with their targets, and the stop-losses. It also implements volume, trend, and strength filters.
This indicator is available on the Prorealcode website at this address:
https://market.prorealcode.com/product/ultimate-breaker
I wish you good trades 😊
Vivien