Elastic N.V. and Asana, Inc. are two prominent players in the software application industry, each carving a unique niche with innovative cloud-based solutions. Elastic specializes in advanced search and data analytics platforms, while Asana focuses on work management and team collaboration tools. Their overlapping markets and forward-thinking strategies make them compelling candidates for comparison. In this article, I will help you decide which company stands out as the more attractive investment opportunity.
Table of contents
Companies Overview
I will begin the comparison between Elastic N.V. and Asana, Inc. by providing an overview of these two companies and their main differences.
Elastic N.V. Overview
Elastic N.V. is a search company that provides technology solutions designed for multi-cloud environments. Its flagship offering, the Elastic Stack, includes products for data ingestion, storage, search, analysis, and visualization, such as Elasticsearch and Kibana. The company focuses on enabling real-time search and analytics across diverse data types, serving global clients from its headquarters in Mountain View, California.
Asana, Inc. Overview
Asana, Inc. operates a work management platform aimed at helping teams and executives orchestrate tasks and strategic initiatives. Its software supports diverse industries, including technology, healthcare, and finance, facilitating project management from daily activities to organization-wide goals. Headquartered in San Francisco, California, Asana emphasizes collaboration and productivity enhancement through its cloud-based solutions.
Key similarities and differences
Both Elastic and Asana operate in the software application industry with cloud-based platforms but serve distinct market needs. Elastic focuses on search and data analytics technology, while Asana specializes in work management and team collaboration tools. Despite these differences, both companies leverage cloud technology to support enterprise users and maintain headquarters in California, sharing similar technology sector characteristics.
Income Statement Comparison
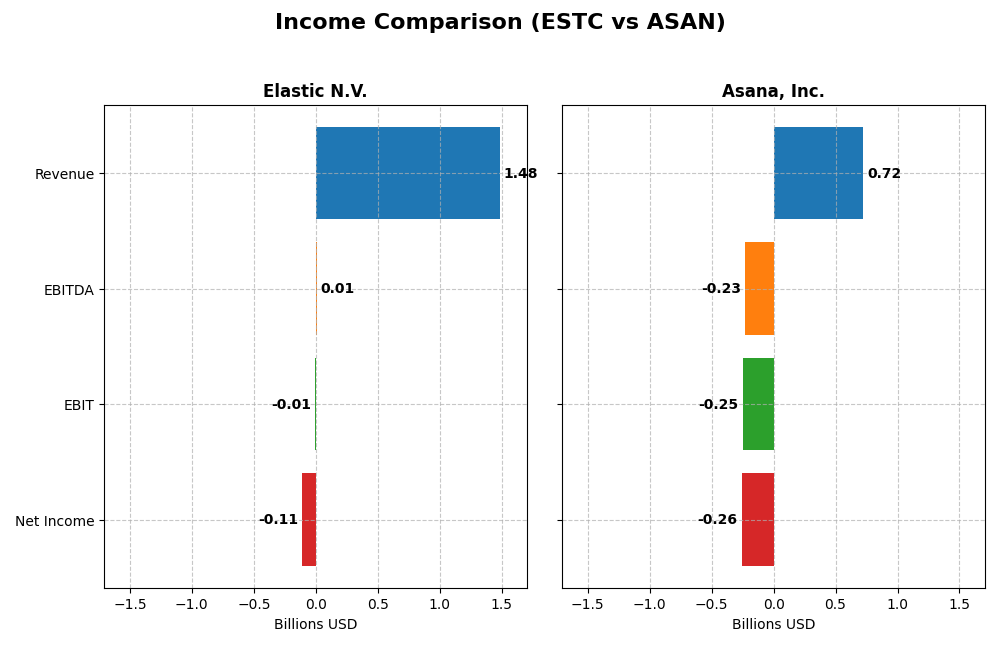
The table below presents a side-by-side comparison of key income statement metrics for Elastic N.V. and Asana, Inc. for the most recent fiscal year.
| Metric | Elastic N.V. (ESTC) | Asana, Inc. (ASAN) |
|---|---|---|
| Market Cap | 7.5B | 2.6B |
| Revenue | 1.48B | 724M |
| EBITDA | 6.1M | -230M |
| EBIT | -6.3M | -247M |
| Net Income | -108M | -256M |
| EPS | -1.04 | -1.11 |
| Fiscal Year | 2025 | 2025 |
Income Statement Interpretations
Elastic N.V.
Elastic N.V. showed strong revenue growth from 2021 to 2025, increasing from $608M to $1.48B, with a gross margin consistently favorable at 74.39%. However, net income remains negative in 2025 at -$108M, despite overall net income growth over the period. The latest year saw improved EBIT margin and a 17% revenue increase, but net margin declined sharply.
Asana, Inc.
Asana’s revenue also grew significantly, from $227M in 2021 to $724M in 2025, with an excellent gross margin of 89.34%. Net income remains negative, at -$256M in 2025, though net margin and EPS showed favorable growth recently. Operating expenses grew in line with revenue, and EBIT margin remained deeply negative but stable in the last year.
Which one has the stronger fundamentals?
Both companies exhibit strong revenue growth and favorable gross margins, but Elastic N.V. achieved positive net income growth overall despite a recent setback, whereas Asana’s net income has declined over the period. Elastic’s EBIT margin improved more markedly, though both report negative net margins. Elastic’s income statement fundamentals appear slightly stronger due to better net income trends.
Financial Ratios Comparison
The table below compares key financial ratios for Elastic N.V. and Asana, Inc. based on their latest fiscal year data, providing a snapshot of profitability, liquidity, leverage, and market valuation.
| Ratios | Elastic N.V. (ESTC) | Asana, Inc. (ASAN) |
|---|---|---|
| ROE | -11.7% | -112.3% |
| ROIC | -3.4% | -53.0% |
| P/E | -82.7 | -19.2 |
| P/B | 9.64 | 21.5 |
| Current Ratio | 1.92 | 1.44 |
| Quick Ratio | 1.92 | 1.44 |
| D/E (Debt-to-Equity) | 0.64 | 1.18 |
| Debt-to-Assets | 23.0% | 30.1% |
| Interest Coverage | -2.17 | -72.4 |
| Asset Turnover | 0.57 | 0.81 |
| Fixed Asset Turnover | 51.3 | 2.76 |
| Payout ratio | 0 | 0 |
| Dividend yield | 0 | 0 |
Interpretation of the Ratios
Elastic N.V.
Elastic N.V. shows a mixed ratio profile with notable weaknesses in profitability, including negative net margin (-7.29%) and return on equity (-11.66%), signaling challenges in generating earnings from shareholders’ investments. Liquidity ratios are strong, with a current ratio of 1.92 indicating good short-term financial health. The company does not pay dividends, reflecting a possible reinvestment strategy or growth focus.
Asana, Inc.
Asana, Inc. presents weaker financial ratios overall, with deeply negative profitability indicators such as a net margin of -35.3% and return on equity of -112.31%, suggesting significant losses relative to equity. Liquidity is moderate, with a current ratio of 1.44 and a favorable quick ratio. The absence of dividends likely stems from ongoing investment in growth and development, typical for a high-growth technology firm.
Which one has the best ratios?
Comparing both companies, Elastic N.V. displays a more balanced financial profile with several favorable liquidity and valuation metrics, despite profitability concerns. Asana, Inc. shows more pronounced weaknesses in profitability and leverage, with fewer favorable ratios. Overall, Elastic N.V.’s ratios appear more stable and less unfavorable relative to Asana’s.
Strategic Positioning
This section compares the strategic positioning of Elastic N.V. and Asana, Inc., focusing on market position, key segments, and exposure to technological disruption:
Elastic N.V.
- Established player in software application with a $7.5B market cap, facing moderate competitive pressure.
- Key revenue from subscription services ($1.38B in 2025) and professional services, driving growth.
- Technology focus on multi-cloud data ingestion, search, and analytics with Elastic Stack products.
Asana, Inc.
- Smaller market cap of $2.6B, competing in software application with higher competitive pressure.
- Operates a work management platform across diverse industries without detailed revenue segmentation.
- Focus on work orchestration platform managing tasks and strategic initiatives across various sectors.
Elastic N.V. vs Asana, Inc. Positioning
Elastic demonstrates a more diversified revenue base with subscription and professional services, leveraging cloud search technology. Asana concentrates on work management software across industries but lacks disclosed revenue segmentation, indicating a more focused approach.
Which has the best competitive advantage?
Both companies are shedding value relative to their cost of capital, but Elastic shows an improving ROIC trend, indicating a slightly less unfavorable competitive position compared to Asana’s declining profitability and very unfavorable moat status.
Stock Comparison
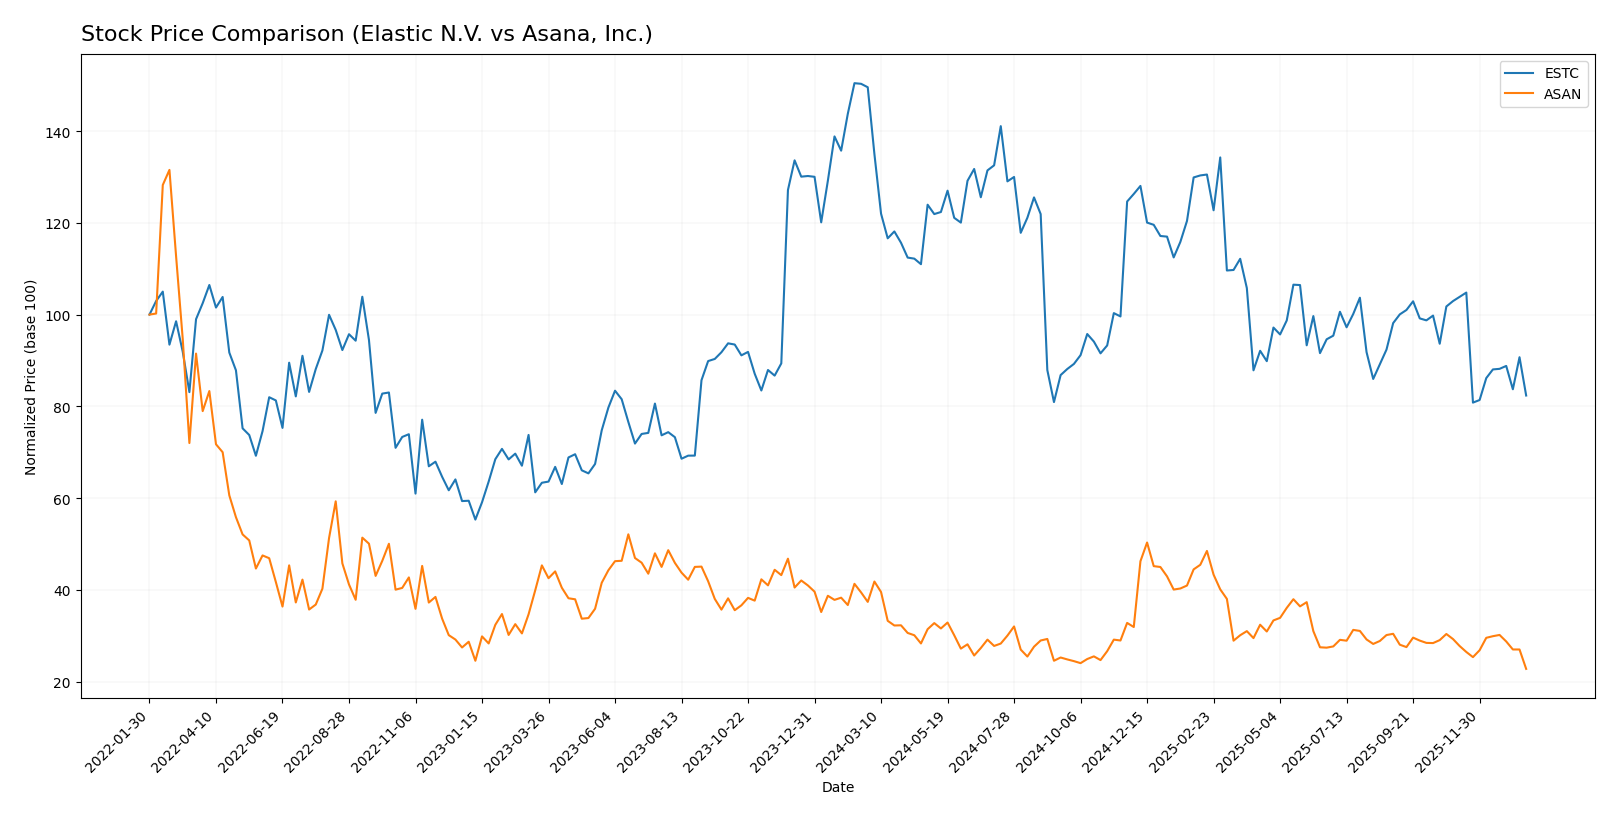
The stock prices of Elastic N.V. (ESTC) and Asana, Inc. (ASAN) have both exhibited significant declines over the past year, with distinct trading volume dynamics shaping their respective trajectories.
Trend Analysis
Elastic N.V. (ESTC) shows a bearish trend with a 44.93% price decrease over the past 12 months, accompanied by decelerating losses and high volatility (14.08 std deviation). The stock ranged between 129.62 and 70.04.
Asana, Inc. (ASAN) also experienced a bearish trend, declining 39.07% over the last year with deceleration and lower volatility (2.87 std deviation). Its price fluctuated between 24.15 and 10.93.
Comparing the two, ESTC delivered the larger market decline, indicating weaker performance than ASAN during this period.
Target Prices
The current analyst consensus suggests moderate upside potential for both Elastic N.V. and Asana, Inc.
| Company | Target High | Target Low | Consensus |
|---|---|---|---|
| Elastic N.V. | 134 | 76 | 108 |
| Asana, Inc. | 18 | 14 | 15.75 |
Elastic N.V.’s consensus target of 108 is significantly above its current price of 71.38, indicating expected growth. Asana’s target consensus of 15.75 also suggests upside from its current 10.93 price, reflecting positive analyst outlooks.
Analyst Opinions Comparison
This section compares analysts’ ratings and grades for Elastic N.V. and Asana, Inc.:
Rating Comparison
Elastic N.V. Rating
- Rating: C-, classified as Very Favorable
- Discounted Cash Flow Score: 3, Moderate
- ROE Score: 1, Very Unfavorable
- ROA Score: 1, Very Unfavorable
- Debt To Equity Score: 1, Very Unfavorable
- Overall Score: 1, Very Unfavorable
Asana, Inc. Rating
- Rating: D+, classified as Very Favorable
- Discounted Cash Flow Score: 1, Very Unfavorable
- ROE Score: 1, Very Unfavorable
- ROA Score: 1, Very Unfavorable
- Debt To Equity Score: 1, Very Unfavorable
- Overall Score: 1, Very Unfavorable
Which one is the best rated?
Elastic N.V. holds a better rating (C-) compared to Asana’s (D+), mainly due to a higher Discounted Cash Flow Score. Both companies share similarly low overall and profitability scores.
Scores Comparison
Here is a comparison of the Altman Z-Score and Piotroski Score for Elastic N.V. and Asana, Inc.:
Elastic N.V. Scores
- Altman Z-Score: 3.51, indicating a safe financial zone.
- Piotroski Score: 4, reflecting average financial health.
Asana, Inc. Scores
- Altman Z-Score: -0.27, indicating financial distress.
- Piotroski Score: 4, reflecting average financial health.
Which company has the best scores?
Elastic N.V. shows stronger financial stability with an Altman Z-Score in the safe zone, while Asana, Inc. falls in the distress zone. Both companies have the same average Piotroski Score of 4.
Grades Comparison
Here is an overview of the recent grades assigned to Elastic N.V. and Asana, Inc. by reputable grading companies:
Elastic N.V. Grades
This table summarizes recent grades assigned to Elastic N.V. by major financial institutions.
| Grading Company | Action | New Grade | Date |
|---|---|---|---|
| Barclays | Maintain | Overweight | 2026-01-12 |
| RBC Capital | Maintain | Outperform | 2026-01-05 |
| Jefferies | Maintain | Buy | 2026-01-05 |
| Citigroup | Maintain | Buy | 2025-11-24 |
| Wedbush | Maintain | Outperform | 2025-11-21 |
| B of A Securities | Maintain | Neutral | 2025-11-21 |
| Guggenheim | Maintain | Buy | 2025-11-21 |
| Wells Fargo | Maintain | Equal Weight | 2025-11-21 |
| RBC Capital | Maintain | Outperform | 2025-11-21 |
| Canaccord Genuity | Maintain | Buy | 2025-11-21 |
Overall, Elastic N.V. maintains a predominantly positive outlook with multiple “Buy” and “Outperform” ratings and no recent downgrades.
Asana, Inc. Grades
This table summarizes recent grades assigned to Asana, Inc. by major financial institutions.
| Grading Company | Action | New Grade | Date |
|---|---|---|---|
| Citigroup | Upgrade | Buy | 2026-01-15 |
| RBC Capital | Maintain | Underperform | 2026-01-05 |
| Keybanc | Upgrade | Overweight | 2025-12-15 |
| DA Davidson | Maintain | Neutral | 2025-12-04 |
| Citigroup | Maintain | Neutral | 2025-12-03 |
| RBC Capital | Maintain | Underperform | 2025-12-03 |
| UBS | Maintain | Neutral | 2025-12-03 |
| Baird | Maintain | Neutral | 2025-09-04 |
| Morgan Stanley | Maintain | Underweight | 2025-09-04 |
| Piper Sandler | Maintain | Overweight | 2025-09-04 |
Asana, Inc.’s ratings show mixed sentiments, with upgrades to “Buy” and “Overweight” offset by several “Underperform” and “Neutral” ratings, indicating varied analyst opinions.
Which company has the best grades?
Elastic N.V. has received more consistent and favorable grades, predominantly “Buy” and “Outperform,” compared to Asana, Inc., which shows a mixed rating profile. This contrast may influence investors seeking more confident analyst support.
Strengths and Weaknesses
Below is a comparative table highlighting the key strengths and weaknesses of Elastic N.V. (ESTC) and Asana, Inc. (ASAN) based on recent financial and strategic data.
| Criterion | Elastic N.V. (ESTC) | Asana, Inc. (ASAN) |
|---|---|---|
| Diversification | Moderate diversification: strong subscription revenue (~$1.38B in 2025) plus professional services (~$99M in 2025) | Limited diversification; mainly focused on collaboration software with no significant revenue segmentation data available |
| Profitability | Unfavorable profitability metrics: negative net margin (-7.29%), negative ROIC (-3.45%), but improving ROIC trend | Poor profitability: deep negative net margin (-35.3%), sharply negative ROIC (-53.03%), and declining profitability trend |
| Innovation | Investment in product innovation reflected in growing ROIC trend despite current value destruction | Innovation impact weak; value destruction with decreasing ROIC trend suggests challenges in translating innovation into profits |
| Global presence | Established global footprint supported by steady subscription growth | Global presence less clear; growth and profitability challenges may limit expansion capability |
| Market Share | Solid position in enterprise search and observability markets with increasing subscription revenue | Market share under pressure due to financial struggles and unfavorable ratios |
Key takeaway: Elastic N.V. shows signs of improving profitability and stable subscription revenue growth, indicating potential value creation in the future despite current losses. In contrast, Asana faces significant profitability challenges with declining returns and unfavorable financial ratios, posing higher investment risks.
Risk Analysis
Below is a comparative table summarizing key risks for Elastic N.V. (ESTC) and Asana, Inc. (ASAN) based on the most recent 2025 financial and operational data.
| Metric | Elastic N.V. (ESTC) | Asana, Inc. (ASAN) |
|---|---|---|
| Market Risk | Moderate (Beta 0.925) | Moderate (Beta 0.916) |
| Debt Level | Moderate (D/E 0.64, Favorable) | High (D/E 1.18, Unfavorable) |
| Regulatory Risk | Moderate (Tech sector, US) | Moderate (Tech sector, US) |
| Operational Risk | Moderate (Negative margins) | High (Heavy losses, negative margins) |
| Environmental Risk | Low to Moderate | Low to Moderate |
| Geopolitical Risk | Moderate (US-based, global cloud services) | Moderate (US-based, global platform) |
Elastic faces moderate market and operational risks with negative profitability but maintains a manageable debt level and favorable liquidity ratios. Asana presents higher financial risk due to significant losses and elevated debt, placing it in a distress zone with lower financial stability. Both companies share similar regulatory and geopolitical exposure typical of US-based tech firms operating globally. The most impactful risks are Asana’s financial distress and Elastic’s ongoing unprofitability, which could affect investor returns and valuation stability.
Which Stock to Choose?
Elastic N.V. (ESTC) shows favorable income growth with 17% revenue increase in 2025 and a solid gross margin of 74%. However, profitability ratios remain negative, with ROE at -11.66% and net margin at -7.29%. Debt levels are moderate and liquidity strong. The company’s overall rating is very favorable despite some weak financial ratios.
Asana, Inc. (ASAN) reports a 10.9% revenue growth with a higher gross margin at 89%, but suffers from more severe profitability challenges, including a net margin of -35.3% and ROE at -112%. Its debt ratios are less favorable, and liquidity is moderate. Ratings indicate a slightly unfavorable financial ratio profile and a very favorable overall rating despite operational struggles.
For investors, ESTC might appear more suitable for those valuing improving profitability and stable liquidity, while ASAN could attract those focused on growth potential despite higher risk and weaker profitability. The choice could depend on an investor’s risk tolerance and preference for quality versus speculative growth.
Disclaimer: Investment carries a risk of loss of initial capital. The past performance is not a reliable indicator of future results. Be sure to understand risks before making an investment decision.
Go Further
I encourage you to read the complete analyses of Elastic N.V. and Asana, Inc. to enhance your investment decisions: