In the ever-evolving semiconductor industry, two companies stand out: Applied Materials, Inc. (AMAT) and Onto Innovation Inc. (ONTO). Both are pivotal players in manufacturing equipment and process control tools, yet they employ different strategies for innovation and market penetration. With overlapping markets and a shared focus on technology advancement, this comparison will delve into their performance and potential. Join me as I evaluate which company could be the most compelling investment opportunity for you.
Table of contents
Company Overview
Applied Materials, Inc. Overview
Applied Materials, Inc. is a leader in the semiconductor industry, offering advanced manufacturing equipment, services, and software essential for the production of semiconductor chips and displays. With a market capitalization of approximately $193B, the company operates through three segments: Semiconductor Systems, Applied Global Services, and Display and Adjacent Markets. Its diverse technological portfolio supports various fabrication processes, including chemical vapor deposition and ion implantation. Established in 1967 and headquartered in Santa Clara, California, Applied Materials’ global presence spans key markets in the U.S., China, Korea, and Europe, making it a pivotal player in enabling technological advancements across multiple sectors.
Onto Innovation Inc. Overview
Onto Innovation Inc. specializes in process control tools and metrology solutions for the semiconductor and advanced packaging industries. With a market capitalization of around $6.7B, Onto focuses on macro defect inspection and optical metrology, providing essential tools for manufacturers. Founded in 1940, the company, headquartered in Wilmington, Massachusetts, serves a variety of applications, including CMOS sensors and LED technologies. This focus on precision and innovation positions Onto as a critical partner for device manufacturers looking to enhance yield and product quality.
Key Similarities and Differences
Both companies operate within the semiconductor industry, but Applied Materials offers a broader range of manufacturing equipment and services, while Onto Innovation specializes in process control and metrology solutions. Applied Materials is more diversified in its product offerings, whereas Onto Innovation is concentrated on enhancing manufacturing efficiency through precision tools.
Income Statement Comparison
In the following table, I present a comparison of key income statement metrics for Applied Materials, Inc. (AMAT) and Onto Innovation Inc. (ONTO) for their most recent fiscal years.
| Metric | AMAT | ONTO |
|---|---|---|
| Revenue | 28.37B | 0.99B |
| EBITDA | 9.65B | 0.25B |
| EBIT | 9.54B | 0.19B |
| Net Income | 6.99B | 0.20B |
| EPS | 8.71 | 4.09 |
Interpretation of Income Statement
In FY2025, Applied Materials (AMAT) demonstrated significant revenue growth to 28.37B, up from 27.18B in FY2024, indicating stable demand within the semiconductor sector. Conversely, Onto Innovation (ONTO) has shown a modest increase in revenue to 0.99B in FY2024, up from 0.82B in FY2023, reflecting steady growth. AMAT maintained strong margins, with EBITDA margin at approximately 34%, while ONTO’s EBITDA margin was around 25%. Notably, AMAT’s net income slightly declined from the previous year, possibly due to increased operational costs. Overall, AMAT continues to lead in scale and profitability, while ONTO is steadily carving out its niche in the market.
Financial Ratios Comparison
The table below presents a comparative analysis of the most recent financial ratios for Applied Materials, Inc. (AMAT) and Onto Innovation Inc. (ONTO).
| Metric | AMAT | ONTO |
|---|---|---|
| ROE | 34.3% | 10.5% |
| ROIC | 22.0% | 8.7% |
| P/E | 26.8 | 41.8 |
| P/B | 9.2 | 4.4 |
| Current Ratio | 2.61 | 8.69 |
| Quick Ratio | 1.87 | 7.00 |
| D/E | 0.32 | 0.01 |
| Debt-to-Assets | 18.1% | 1.0% |
| Interest Coverage | 30.8 | N/A |
| Asset Turnover | 0.78 | 0.47 |
| Fixed Asset Turnover | 6.15 | 7.16 |
| Payout Ratio | 19.3% | 0% |
| Dividend Yield | 0.72% | 0% |
Interpretation of Financial Ratios
In comparing the financial ratios, Applied Materials shows stronger profitability metrics, including a higher ROE and ROIC, indicating effective use of equity and capital. The P/E ratio suggests AMAT is relatively cheaper than ONTO, despite higher growth expectations for ONTO. The notably high current and quick ratios for ONTO reflect exceptional liquidity, but the low debt levels may suggest underutilization of leverage. Both companies exhibit strengths, but investors should consider their growth strategies and market conditions.
Dividend and Shareholder Returns
Applied Materials, Inc. (AMAT) pays a dividend, with a yield of 0.72% and a payout ratio of approximately 19%. This indicates sustainable distributions, supported by strong free cash flow coverage. Conversely, Onto Innovation Inc. (ONTO) does not offer dividends, opting instead to reinvest profits for growth, which is typical for a company in a high-growth phase. Although it doesn’t distribute cash, ONTO engages in share buybacks, signaling a commitment to enhancing shareholder value. Overall, AMAT’s approach appears more aligned with immediate shareholder returns, while ONTO’s strategy may foster long-term growth potential.
Strategic Positioning
Applied Materials, Inc. (AMAT) commands a substantial market share in the semiconductor equipment sector, bolstered by its diverse product offerings across semiconductor systems and display technologies. In contrast, Onto Innovation Inc. (ONTO), while smaller with a market cap of $6.71B, focuses on niche process control tools, creating competitive pressure. Both companies face technological disruptions as they adapt to advancements in semiconductor fabrication and inspection technologies, necessitating ongoing innovation and strategic agility.
Stock Comparison
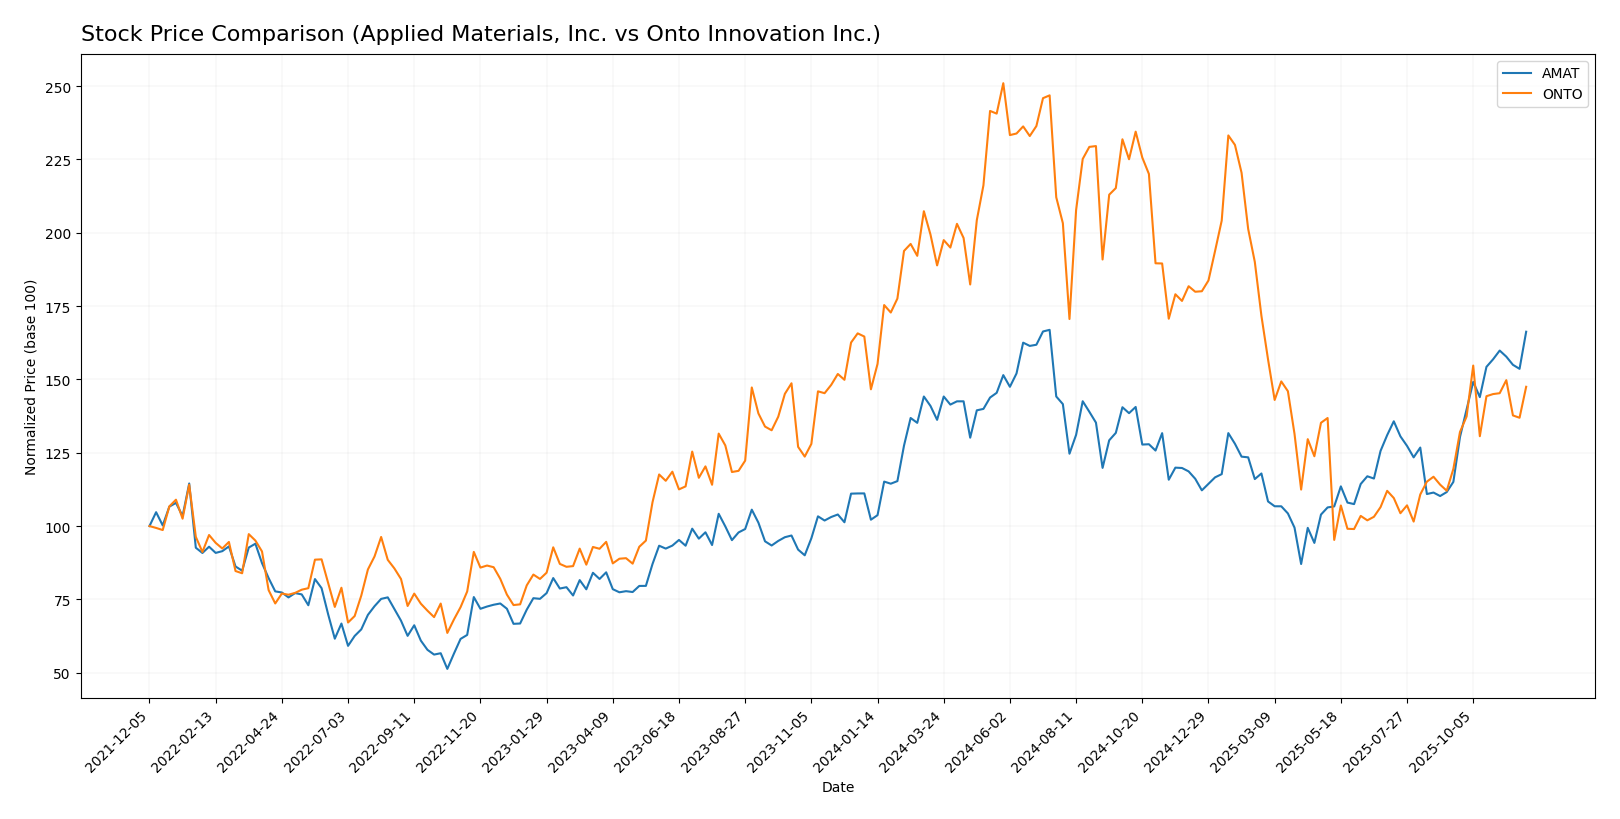
In the past year, both Applied Materials, Inc. (AMAT) and Onto Innovation Inc. (ONTO) have exhibited notable stock price movements, showcasing dynamic trading patterns that warrant careful analysis.
Trend Analysis
For Applied Materials, Inc. (AMAT), the stock has experienced a significant price increase of 62.72% over the past year. This reflects a bullish trend, with the stock currently showing signs of acceleration. The highest price recorded was $243.4, while the lowest was $126.95, indicating a considerable range of volatility with a standard deviation of 26.33. In the recent trend from September 14 to November 30, 2025, the stock rose 44.49% with a standard deviation of 19.94, further reinforcing the bullish sentiment.
For Onto Innovation Inc. (ONTO), the stock has seen a modest price change of 0.59% over the past year, resulting in a bullish trend as well, albeit with less momentum than AMAT. The highest price reached was $233.14, with a low of $88.5, and it has a standard deviation of 42.36. The recent trend from September 14 to November 30, 2025, shows an increase of 23.44% and a standard deviation of 8.61, signaling an acceleration in price movements, albeit at a more subdued rate compared to AMAT.
Both stocks demonstrate increasing volume trends, with AMAT showing a buyer dominance of 51.62% overall and 63.54% in the recent period, while ONTO reflects a buyer percentage of 55.16% overall, rising to 79.35% in recent trading.
Analyst Opinions
Recent analyst recommendations for Applied Materials, Inc. (AMAT) show a consensus rating of B+, indicating a buy. Analysts highlight its strong return on equity and assets, though some concerns about its debt-to-equity ratio persist. Onto Innovation Inc. (ONTO) has a slightly lower rating of B, with analysts favoring a hold position. They cite solid operational performance but note that the market challenges could limit growth. Overall, the consensus for AMAT leans towards buy, while ONTO suggests a more cautious approach with a hold recommendation.
Stock Grades
In the current market landscape, it’s essential to stay informed about stock ratings to make educated investment decisions. Below, I present the latest grades for Applied Materials, Inc. (AMAT) and Onto Innovation Inc. (ONTO), based on reliable data from established grading companies.
Applied Materials, Inc. Grades
| Grading Company | Action | New Grade | Date |
|---|---|---|---|
| UBS | upgrade | Buy | 2025-11-25 |
| Citigroup | maintain | Buy | 2025-11-14 |
| Mizuho | maintain | Neutral | 2025-11-14 |
| Needham | maintain | Buy | 2025-11-14 |
| Craig-Hallum | downgrade | Hold | 2025-11-14 |
| JP Morgan | maintain | Overweight | 2025-11-14 |
| Wells Fargo | maintain | Overweight | 2025-11-14 |
| B. Riley Securities | maintain | Buy | 2025-11-14 |
| Cantor Fitzgerald | maintain | Overweight | 2025-11-14 |
| Morgan Stanley | maintain | Overweight | 2025-11-14 |
Onto Innovation Inc. Grades
| Grading Company | Action | New Grade | Date |
|---|---|---|---|
| B. Riley Securities | maintain | Buy | 2025-11-18 |
| Needham | maintain | Buy | 2025-11-18 |
| Evercore ISI Group | maintain | Outperform | 2025-11-05 |
| Oppenheimer | maintain | Outperform | 2025-10-14 |
| Stifel | maintain | Hold | 2025-10-13 |
| B. Riley Securities | maintain | Buy | 2025-10-10 |
| Jefferies | upgrade | Buy | 2025-09-23 |
| B. Riley Securities | maintain | Buy | 2025-08-08 |
| Benchmark | maintain | Buy | 2025-08-08 |
| Cantor Fitzgerald | maintain | Neutral | 2025-06-24 |
Overall, the trend for AMAT indicates a mixed outlook with a recent upgrade to “Buy” by UBS, while ONTO shows a consistent “Buy” sentiment maintained by several firms. Investors may want to consider the stability of ONTO as a potential opportunity in their portfolios.
Target Prices
The current consensus among analysts for Applied Materials, Inc. (AMAT) and Onto Innovation Inc. (ONTO) suggests a positive outlook for both companies.
| Company | Target High | Target Low | Consensus |
|---|---|---|---|
| Applied Materials, Inc. | 290 | 205 | 249.27 |
| Onto Innovation Inc. | 180 | 120 | 153.33 |
For AMAT, the consensus target price of 249.27 is slightly above the current price of 242.46, indicating moderate growth potential. ONTO’s target consensus of 153.33 also exceeds its current price of 136.99, suggesting favorable expectations from analysts.
Strengths and Weaknesses
The following table summarizes the strengths and weaknesses of Applied Materials, Inc. (AMAT) and Onto Innovation Inc. (ONTO) based on recent financial data.
| Criterion | Applied Materials, Inc. (AMAT) | Onto Innovation Inc. (ONTO) |
|---|---|---|
| Diversification | Strong presence in semiconductor and display equipment | Focused on niche process control tools |
| Profitability | Net profit margin of 24.67% | Net profit margin of 20.43% |
| Innovation | High investment in R&D | Continuous development of advanced metrology tools |
| Global presence | Operates in multiple countries | Primarily US-focused but expanding globally |
| Market Share | Significant share in semiconductor equipment | Smaller, growing market presence |
| Debt level | Low debt-to-equity ratio of 0.32 | Minimal debt levels, high solvency |
Key takeaways show that while AMAT boasts a broader market presence and higher profitability, ONTO demonstrates impressive innovation and low debt levels, making it an attractive option for risk-averse investors.
Risk Analysis
The following table outlines key risks associated with Applied Materials, Inc. (AMAT) and Onto Innovation Inc. (ONTO):
| Metric | Applied Materials, Inc. | Onto Innovation Inc. |
|---|---|---|
| Market Risk | High | Moderate |
| Regulatory Risk | Moderate | Low |
| Operational Risk | Moderate | High |
| Environmental Risk | Low | Moderate |
| Geopolitical Risk | High | Moderate |
In synthesizing the risks, I observe that both companies face significant market risk due to the volatile semiconductor industry. Additionally, Applied Materials has a higher exposure to geopolitical risks, especially related to trade tensions, while Onto Innovation’s operational risks stem from its reliance on specific technologies.
Which one to choose?
When comparing Applied Materials, Inc. (AMAT) and Onto Innovation Inc. (ONTO), both companies show promising fundamentals. AMAT boasts a higher gross profit margin of 49% and a robust current ratio of 2.61, indicating strong liquidity. Its stock trend is bullish, with a price change of 62.72% over the past year, reflecting investor confidence. Conversely, ONTO’s gross profit margin stands at 52%, but it has a significantly higher P/E ratio of 41.76, suggesting it may be overvalued compared to AMAT.
Analysts rate AMAT with a B+ and a target price reflecting ongoing growth potential, while ONTO has a B rating, slightly lower, reflecting more modest expectations. For growth-oriented investors, AMAT appears favorable due to its strong revenue growth and solid margins. However, those prioritizing stability might find ONTO’s consistent performance appealing.
Investors should consider the risks associated with AMAT’s exposure to market volatility and competition in the tech sector.
Disclaimer: This article is not financial advice. Each investor is responsible for their own investment decisions.
Go further
I encourage you to read the complete analyses of Applied Materials, Inc. and Onto Innovation Inc. to enhance your investment decisions: