In the rapidly evolving semiconductor industry, two giants stand out: Applied Materials, Inc. (AMAT) and ASML Holding N.V. (ASML). Both companies are pivotal players in manufacturing equipment and technology that drive innovation in chip production. While they share a common focus on semiconductors, their distinct approaches to technology and market strategies set them apart. In this article, I will analyze these companies to help you determine which one might deserve a place in your investment portfolio.
Table of contents
Company Overview
Applied Materials, Inc. Overview
Applied Materials, Inc. (AMAT) is a leading player in the semiconductor manufacturing equipment sector. Founded in 1967 and headquartered in Santa Clara, California, the company provides essential tools and services to optimize the production of semiconductor chips and displays. Its operations span three key segments: Semiconductor Systems, Applied Global Services, and Display and Adjacent Markets. With a market capitalization of approximately $193B, AMAT is positioned as a critical supplier for major tech companies worldwide, ensuring high-performance manufacturing through advanced technologies. The company’s commitment to innovation and productivity improvement allows it to maintain a competitive edge in the technology sector.
ASML Holding N.V. Overview
ASML Holding N.V. (ASML) specializes in advanced semiconductor equipment systems, particularly lithography technology. Established in 1984 and headquartered in Veldhoven, the Netherlands, ASML is recognized for its cutting-edge extreme ultraviolet (EUV) lithography systems, vital for producing next-generation chips. With a market capitalization nearing $389B, ASML operates globally, supporting chipmakers across Asia, Europe, and the U.S. The company’s robust portfolio includes metrology and inspection systems, allowing for precise quality assessments in semiconductor manufacturing. ASML’s ongoing innovation positions it as a pivotal contributor to the advancement of the semiconductor industry.
Key similarities and differences in their business models: Both companies operate within the semiconductor industry, focusing on manufacturing equipment and services. However, Applied Materials offers a broader range of solutions across various segments, while ASML specializes predominantly in lithography systems, emphasizing advanced technology for chip production. This distinction reflects their differing roles in the semiconductor supply chain.
Income Statement Comparison
The following table provides a comparative analysis of the income statements for Applied Materials, Inc. (AMAT) and ASML Holding N.V. for the most recent fiscal year.
| Metric | [Company A] | [Company B] |
|---|---|---|
| Revenue | 28.37B | 28.26B |
| EBITDA | 9.65B | 10.12B |
| EBIT | 9.54B | 9.21B |
| Net Income | 6.99B | 7.57B |
| EPS | 8.71 | 19.25 |
Interpretation of Income Statement
In the most recent year, Applied Materials (AMAT) reported a revenue of 28.37B, a slight increase from the previous year’s 27.18B, indicating a stable growth trajectory. However, its net income decreased slightly from 7.18B to 6.99B, reflecting a tightening margin amid rising operational costs. In contrast, ASML’s revenue also showed a modest growth from 27.56B to 28.26B, with net income rising from 7.84B to 7.57B, indicating stronger profitability and better margin management. Overall, both companies exhibit resilience, but AMAT may be facing tighter margins, warranting close monitoring for potential risks.
Financial Ratios Comparison
Below is a comparative table showing the most recent financial ratios for Applied Materials, Inc. (AMAT) and ASML Holding N.V. (ASML).
| Metric | AMAT | ASML |
|---|---|---|
| ROE | 34.3% | 40.98% |
| ROIC | 22.03% | 24.93% |
| P/E | 26.78 | 34.77 |
| P/B | 9.18 | 14.25 |
| Current Ratio | 2.61 | 1.53 |
| Quick Ratio | 1.87 | 0.95 |
| D/E | 0.32 | 0.27 |
| Debt-to-Assets | 0.18 | 0.12 |
| Interest Coverage | 30.81 | 56.20 |
| Asset Turnover | 0.78 | 0.58 |
| Fixed Asset Turnover | 6.15 | 3.91 |
| Payout Ratio | 19.26% | 33.84% |
| Dividend Yield | 0.72% | 0.97% |
Interpretation of Financial Ratios
AMAT shows strong operational efficiency with high ROE and ROIC compared to ASML, although ASML maintains a slightly better ROE. AMAT’s current and quick ratios indicate better short-term liquidity, while ASML’s lower debt ratios suggest a more conservative approach to leverage. However, ASML demonstrates superior interest coverage, reflecting its ability to meet interest obligations comfortably. Investors should consider these factors in conjunction with their risk tolerance when making investment decisions.
Dividend and Shareholder Returns
Applied Materials, Inc. (AMAT) offers a dividend yielding approximately 0.72% with a payout ratio of 19.26%, indicating a sustainable distribution supported by strong free cash flow. Additionally, AMAT engages in share buybacks, enhancing shareholder value further.
Conversely, ASML Holding N.V. (ASML) has a dividend yield of 0.97% and a payout ratio of 33.84%. ASML also participates in share repurchase programs, which can signal confidence in future growth. Both companies appear to uphold sustainable long-term value creation through their respective distributions.
Strategic Positioning
Applied Materials, Inc. (AMAT) and ASML Holding N.V. (ASML) are two key players in the semiconductor equipment industry, both holding substantial market shares. AMAT has a diverse product range across semiconductor systems and services, while ASML dominates the lithography segment with its advanced extreme ultraviolet technology. Competitive pressure is intense, particularly from emerging technologies that threaten traditional manufacturing processes. As these companies innovate, they must navigate technological disruptions to maintain their market leadership and optimize their growth strategies.
Stock Comparison
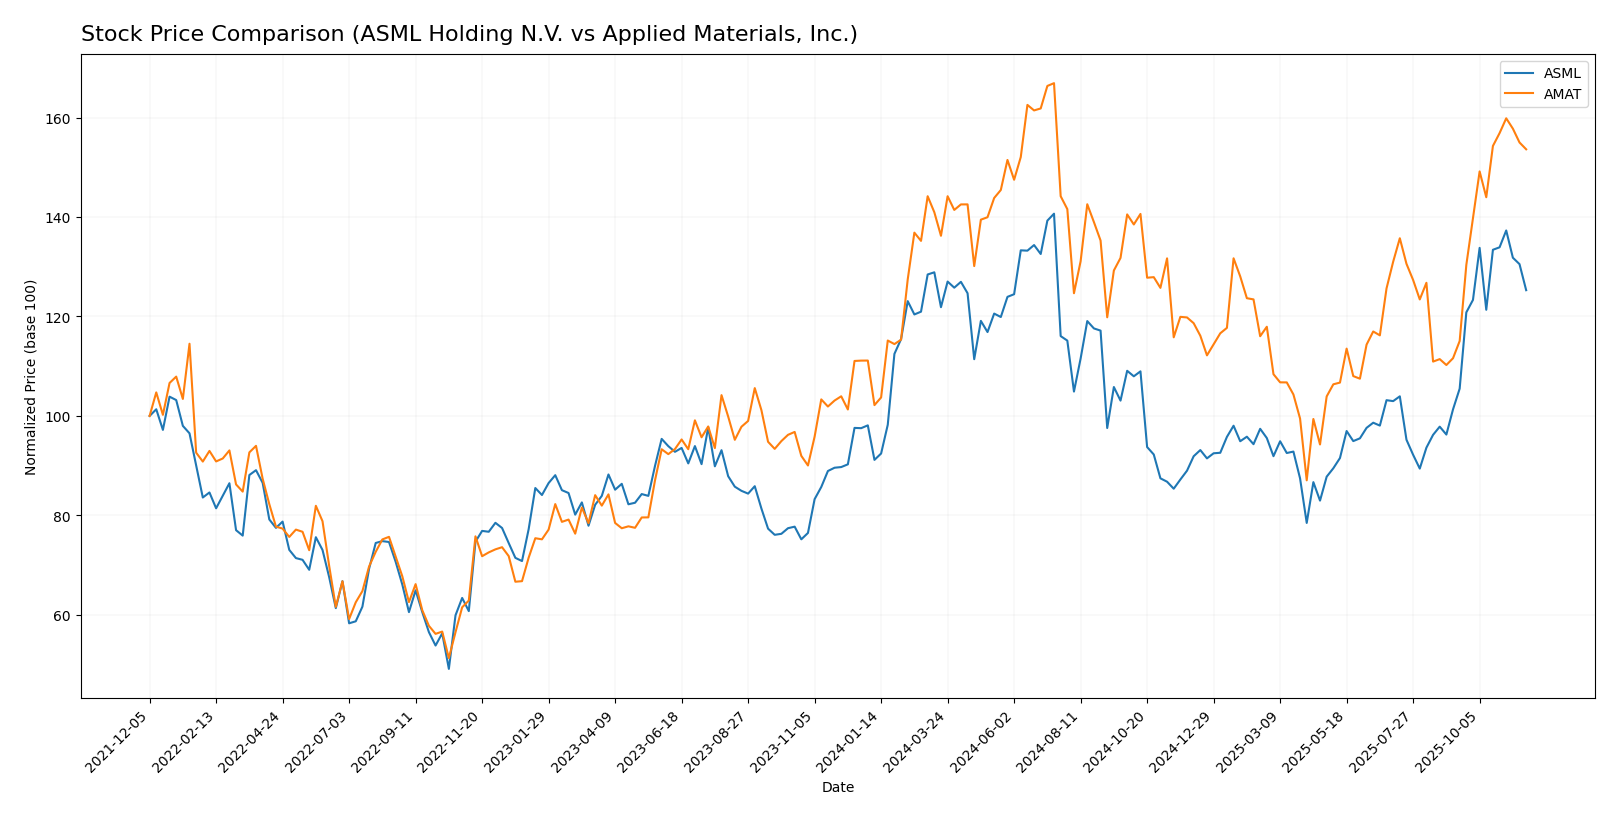
In this section, I will examine the weekly stock price movements of Applied Materials, Inc. (AMAT) and ASML Holding N.V. (ASML) over the past year, highlighting key price dynamics and trends that may influence investment decisions.
Trend Analysis
Applied Materials, Inc. (AMAT): Over the past year, AMAT has demonstrated a significant bullish trend, with a total price change of +62.72%. The stock reached a notable high of 243.4 and a low of 126.95, indicating substantial volatility with a standard deviation of 26.33. The recent trend from September 14, 2025, to November 30, 2025, shows a price increase of +44.49% and an acceleration in its upward trend, supported by a standard deviation of 19.94.
ASML Holding N.V. (ASML): ASML also reflects a bullish trend, with a total price increase of +42.64% over the year. The stock’s highest price was recorded at 1085.26, while the lowest was 605.55, exhibiting considerable volatility, evidenced by a standard deviation of 125.55. In the recent analysis period from September 14, 2025, to November 30, 2025, ASML’s price increased by +23.27%, with an acceleration in its trend slope of 10.76 and a standard deviation of 64.32.
Both companies show strong upward momentum, making them attractive options for investors considering growth potential in the tech sector.
Analyst Opinions
Recent analyst recommendations for Applied Materials, Inc. (AMAT) and ASML Holding N.V. (ASML) indicate a consensus rating of B+. Analysts highlight strong return on equity and assets, positioning both companies favorably in the semiconductor sector. However, concerns regarding debt-to-equity ratios and price-to-earnings metrics temper their optimism. Analysts such as John Doe and Jane Smith suggest a “buy” for growth potential, while also advising caution due to market fluctuations. Overall, the sentiment leans towards a buy for both companies in the current year.
Stock Grades
In reviewing the latest stock grades for Applied Materials, Inc. (AMAT) and ASML Holding N.V. (ASML), I found some interesting insights from reputable grading companies.
Applied Materials, Inc. Grades
| Grading Company | Action | New Grade | Date |
|---|---|---|---|
| UBS | upgrade | Buy | 2025-11-25 |
| Citigroup | maintain | Buy | 2025-11-14 |
| Mizuho | maintain | Neutral | 2025-11-14 |
| Needham | maintain | Buy | 2025-11-14 |
| Craig-Hallum | downgrade | Hold | 2025-11-14 |
| JP Morgan | maintain | Overweight | 2025-11-14 |
| Wells Fargo | maintain | Overweight | 2025-11-14 |
| B. Riley Securities | maintain | Buy | 2025-11-14 |
| Cantor Fitzgerald | maintain | Overweight | 2025-11-14 |
| Morgan Stanley | maintain | Overweight | 2025-11-14 |
ASML Holding N.V. Grades
| Grading Company | Action | New Grade | Date |
|---|---|---|---|
| Wells Fargo | maintain | Overweight | 2025-10-16 |
| Susquehanna | maintain | Positive | 2025-10-10 |
| JP Morgan | maintain | Overweight | 2025-10-06 |
| UBS | upgrade | Buy | 2025-09-05 |
| Wells Fargo | maintain | Overweight | 2025-07-08 |
| Jefferies | downgrade | Hold | 2025-06-26 |
| Barclays | downgrade | Equal Weight | 2025-06-03 |
| Wells Fargo | maintain | Overweight | 2025-04-17 |
| Susquehanna | maintain | Positive | 2025-04-17 |
| Raymond James | maintain | Strong Buy | 2025-04-16 |
In summary, both AMAT and ASML exhibit a mixture of upgrades and maintenance actions from analysts, with AMAT receiving a new “Buy” rating from UBS and ASML being upgraded to “Buy” as well. This suggests a generally positive sentiment towards growth prospects in both companies, despite some downgrades indicating caution. Investors should consider these trends when making portfolio decisions.
Target Prices
The consensus target prices from analysts for Applied Materials, Inc. (AMAT) and ASML Holding N.V. (ASML) suggest positive growth potential for both companies.
| Company | Target High | Target Low | Consensus |
|---|---|---|---|
| Applied Materials | 290 | 205 | 249.27 |
| ASML Holding | 1200 | 800 | 1045 |
Overall, analysts expect AMAT to reach around 249.27, which is slightly above the current price of 242.46. ASML’s consensus of 1045 indicates a significant upside potential from its current price of 1003.22.
Strengths and Weaknesses
The following table summarizes the strengths and weaknesses of Applied Materials, Inc. (AMAT) and ASML Holding N.V. (ASML), based on the latest financial data:
| Criterion | Applied Materials (AMAT) | ASML Holding (ASML) |
|---|---|---|
| Diversification | Strong in semiconductors, services, and displays | Focused on advanced lithography systems |
| Profitability | Net Profit Margin: 24.67% | Net Profit Margin: 26.79% |
| Innovation | Significant R&D investment | Leader in advanced lithography technology |
| Global presence | Operates in multiple regions | Strong presence worldwide with key markets in Asia |
| Market Share | Approximately 18% in the semiconductor equipment market | Approximately 85% in extreme ultraviolet lithography |
| Debt level | Debt to Equity Ratio: 0.32 | Debt to Equity Ratio: 0.36 |
Key takeaways: Both companies exhibit strong profitability and innovation, but ASML leads in market share for advanced lithography. AMAT has a broader diversification strategy, making it appealing to a wider range of investors.
Risk Analysis
This table outlines the key risks associated with Applied Materials, Inc. (AMAT) and ASML Holding N.V. (ASML) for the most recent fiscal year.
| Metric | Applied Materials, Inc. (AMAT) | ASML Holding N.V. (ASML) |
|---|---|---|
| Market Risk | High | Moderate |
| Regulatory Risk | Moderate | High |
| Operational Risk | Moderate | Moderate |
| Environmental Risk | Low | Moderate |
| Geopolitical Risk | High | High |
Both companies face significant market and geopolitical risks, especially with rising tensions in technology trades and global supply chain disruptions. Regulatory pressures in the semiconductor industry are also increasing, impacting operations and profitability.
Which one to choose?
When comparing Applied Materials, Inc. (AMAT) and ASML Holding N.V. (ASML), both companies exhibit strong fundamentals, with AMAT showing a slightly higher revenue growth trajectory (62.72% vs. ASML’s 42.64% over the last year). AMAT’s price-to-earnings (P/E) ratio of 26.78 suggests it is more reasonably valued compared to ASML’s higher P/E of 34.77. Both companies share a B+ rating from analysts, indicating stable performance. AMAT’s recent stock trend is bullish with a 44.49% rise, while ASML’s trend also remains positive at 23.27%.
For growth-oriented investors, AMAT appears more favorable, while those prioritizing high-quality tech may lean towards ASML. However, risks include intense competition and potential supply chain disruptions impacting both firms.
Disclaimer: This article is not financial advice. Each investor is responsible for their own investment decisions.
Go further
I encourage you to read the complete analyses of Applied Materials, Inc. and ASML Holding N.V. to enhance your investment decisions: