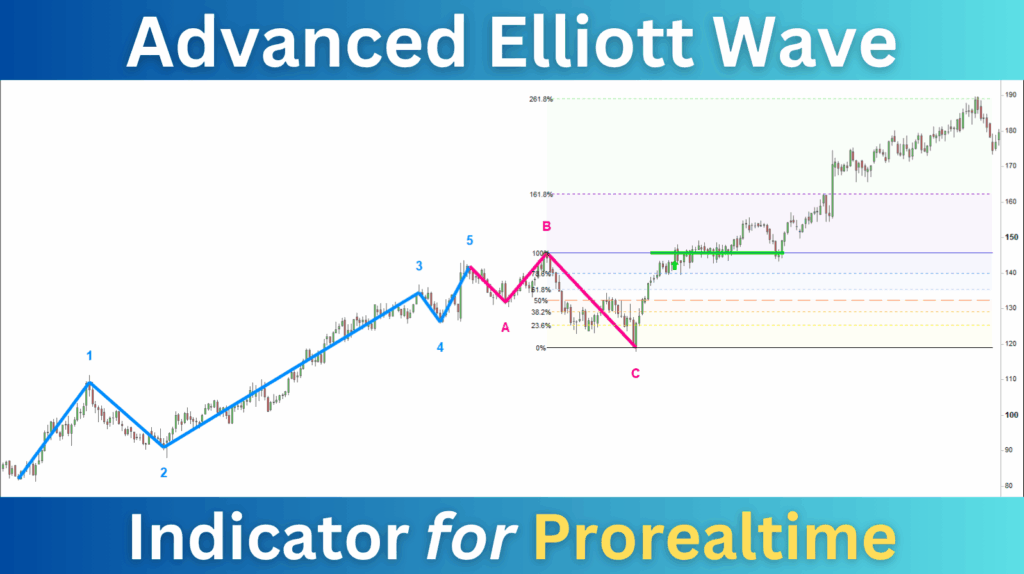
The Advanced Elliott Wave Indicator for ProRealTime automatically identifies Elliott impulsive and corrective waves in real-time. It highlights key market turning points and Fibonacci-based targets — helping you anticipate new bullish trends and upcoming corrections with precision.
✅ Benefit from powerful market movements while improving your timing and risk management.
Try the indicator for Free
Start a FREE TRIAL with the Advanced Elliott Wave indicator today. You will access the indicator’s complete functionalities for two weeks.
Get instant access to the Advanced Elliott Wave indicator and its real-time screener on your ProRealTime platform. Acquire your license today and start detecting market cycles with precision.
Automatically detect impulsive and corrective Elliott Waves on any chart. You’ll identify market phases instantly without manual labeling.
Fibonacci Level Display
Visualize Fibonacci retracements and extensions for each wave. Anticipate correction depth and set accurate profit targets.
Cycle Anticipation
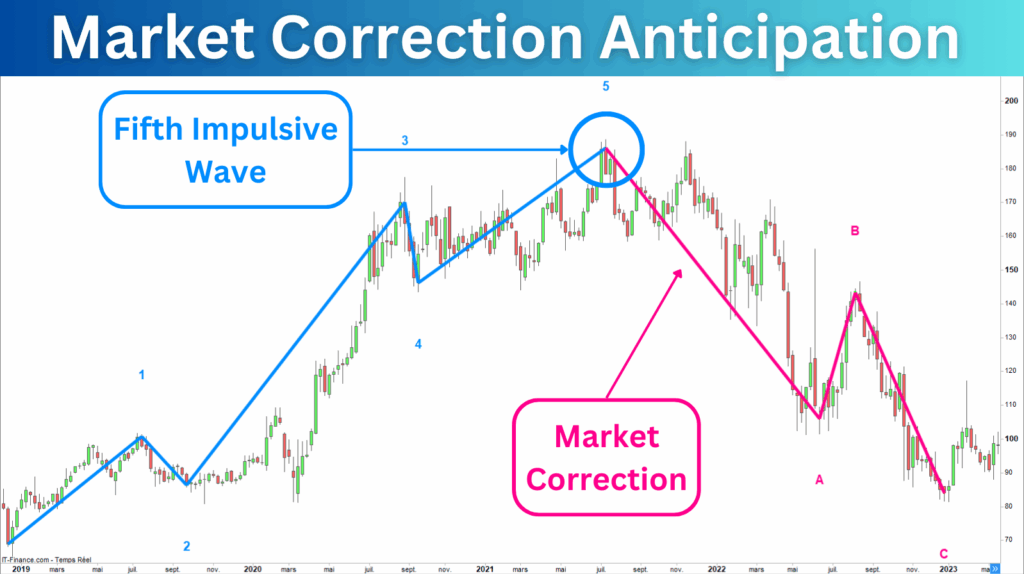
When wave 5 appears, a correction phase often follows. You’ll anticipate market reversals before most traders react.
Buying Signals
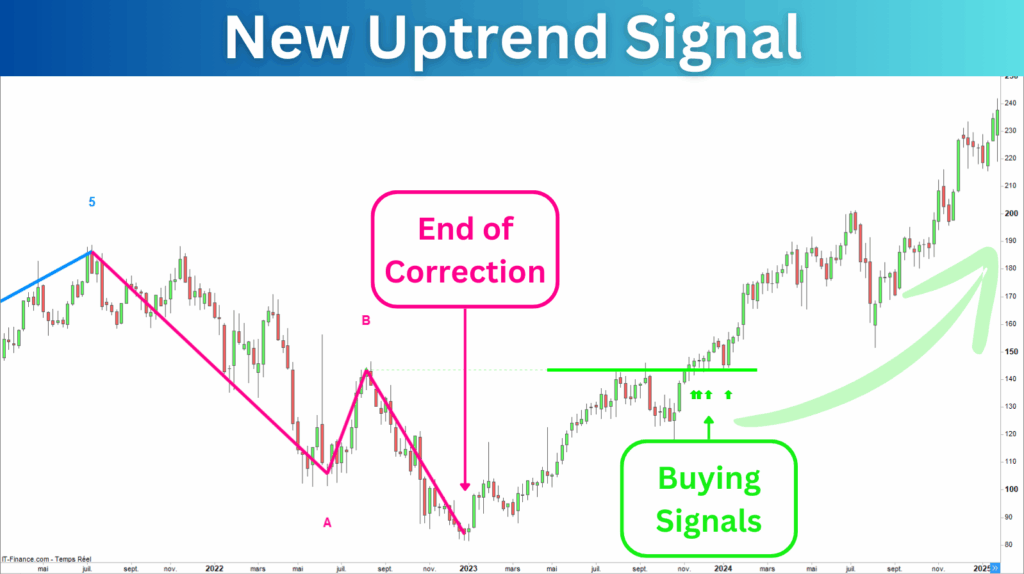
Detect the beginning of new bullish cycles — including wave (C) and post-correction breakouts — to capture the entire uptrend.
Signal Confirmation
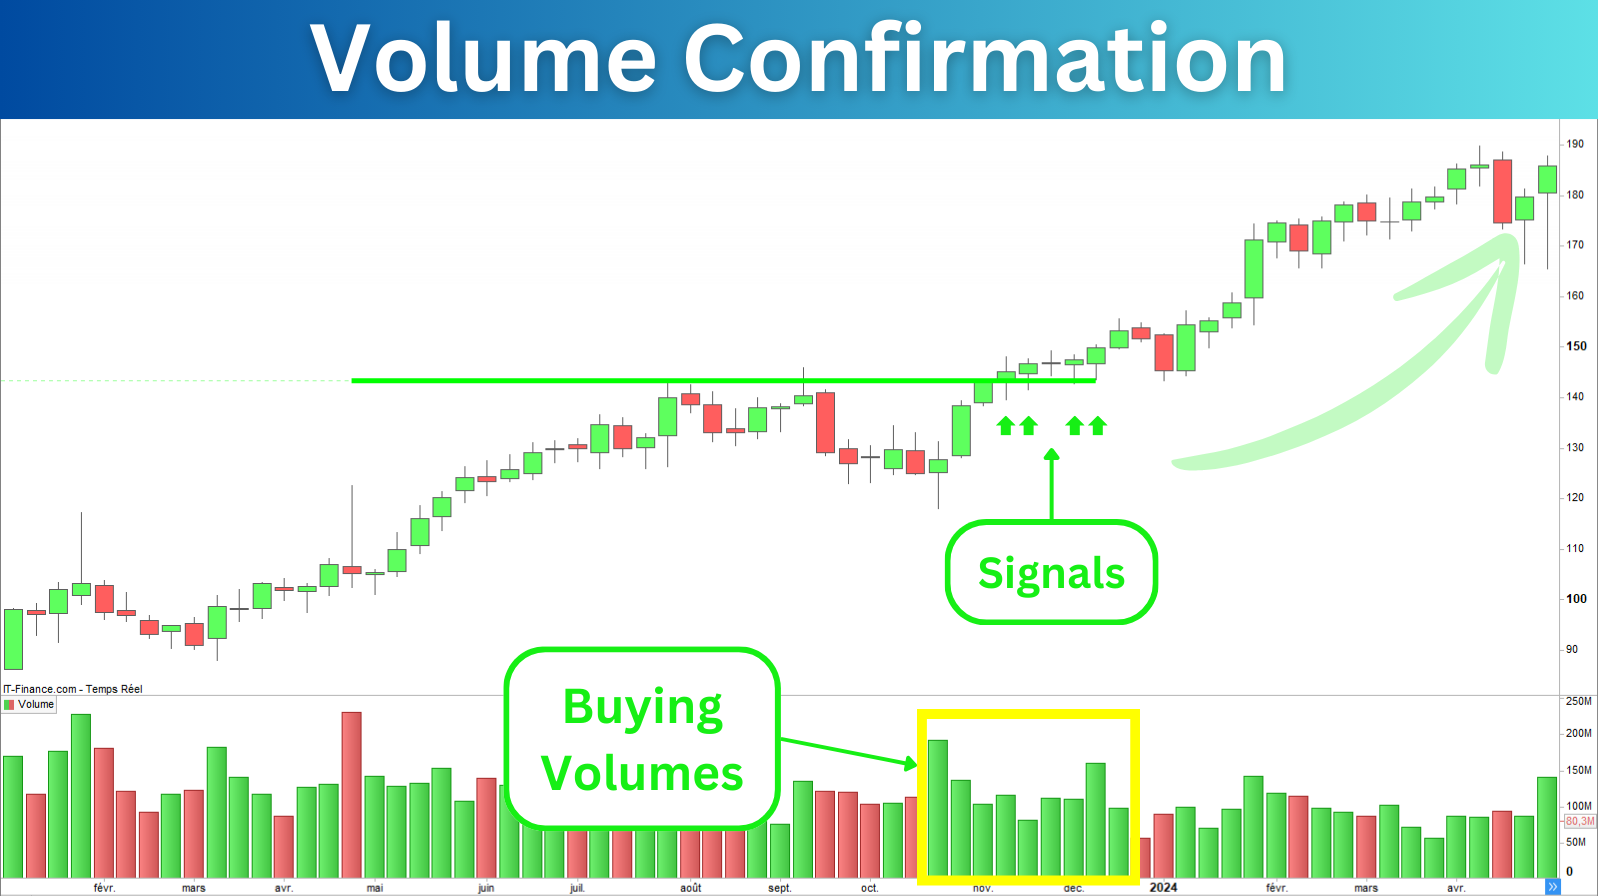
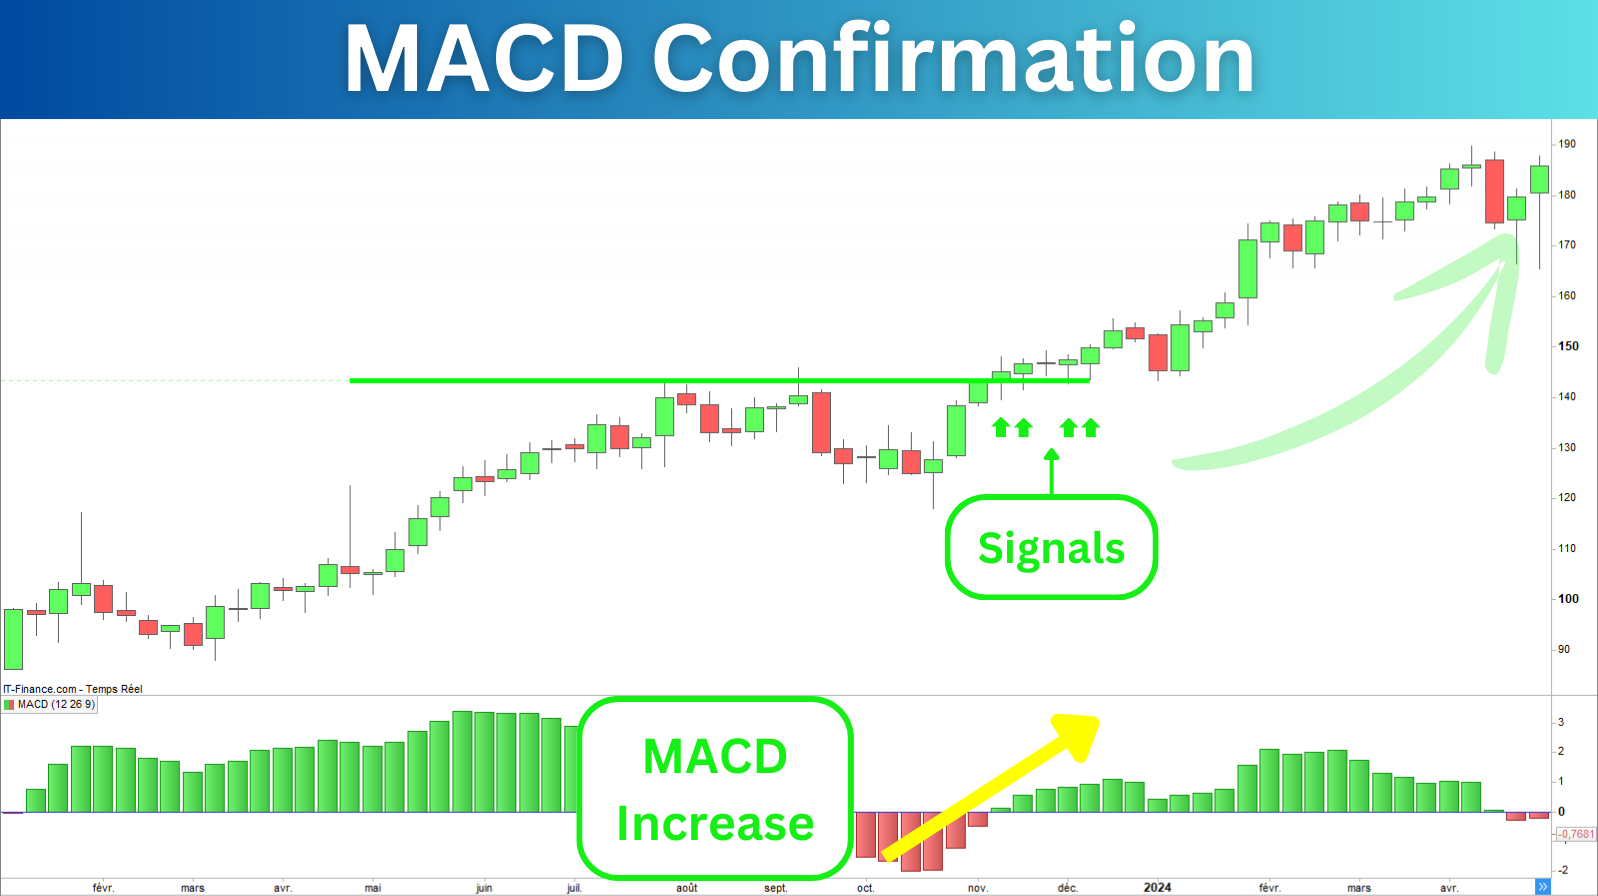
Activate validation filters based on volume, trend strength, or divergence to focus only on high-probability trades.
Risk Management
The indicator automatically displays targets and stop-loss levels on your chart, helping you secure profits and control losses.
Trading Alerts
Set custom alerts on ProRealTime for wave completions or breakout signals. You’ll never miss a setup again — on any market or timeframe.
Full Customization
Adjust wave colors, pattern types, signal triggers, Fibonacci zones, or stop-loss levels. Adapt the indicator entirely to your strategy.
Automated Trading
Integrate the indicator into your ProBuilder backtests to validate and automate your Elliott-based strategies.
Why Use Elliott Waves?
The Elliott Wave Theory, developed by Ralph Nelson Elliott in the 1930s, reveals how markets move in repetitive psychological cycles. Understanding these cycles helps you anticipate the beginning and end of major trends — whether bullish or corrective.
Detect the End of Bullish Cycles
When the fifth impulsive wave completes, a market correction is often imminent. Use this signal to secure profits or hedge positions.
Identify the Start of New Trends
The formation of wave (C) typically marks the end of a correction and the start of a new uptrend. Take advantage of early entries on major reversals.
The following image shows the three Elliott cycles, consisting of a bullish cycle, a correction phase, and the emergence of a new uptrend:
Why use the Advanced Elliott Wave indicator?
Trading Elliott Waves manually requires deep expertise and time. The Advanced Elliott Wave Indicator automates detection, confirmation, and visualization — providing a clear structure to your charts.
It’s ideal for swing traders, position traders, and algorithmic strategies.
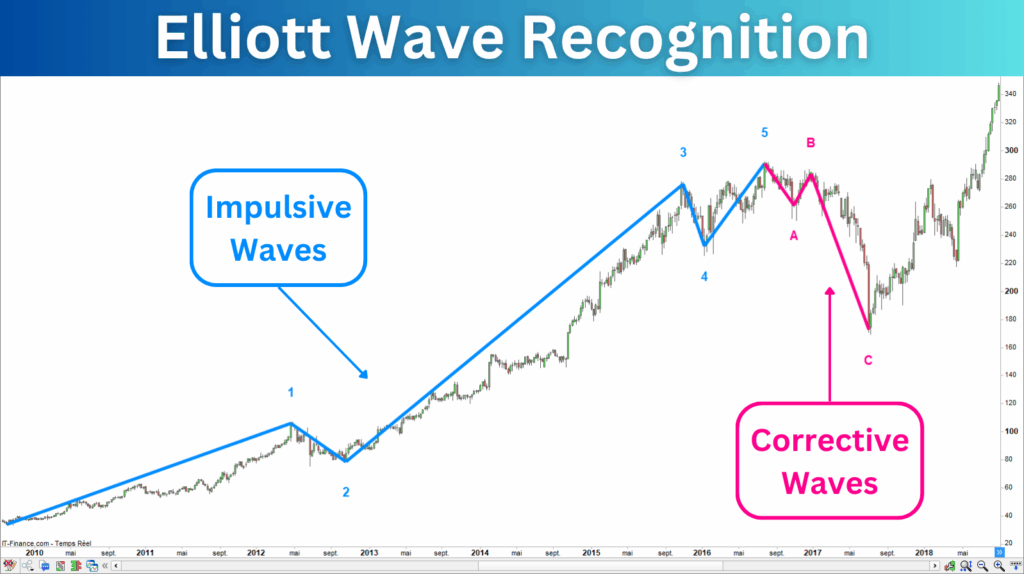
1. Automatic Elliott Wave Recognition
Any trader who has ever used the Elliott Wave method knows it can be time-consuming to plot waves on a chart correctly.
Automatically displaying Elliott Waves will save you valuable time. You’ll detect the beginning of corrective phases and new bullish cycles at a glance:
You will spot Elliott Waves at a glance on your charts
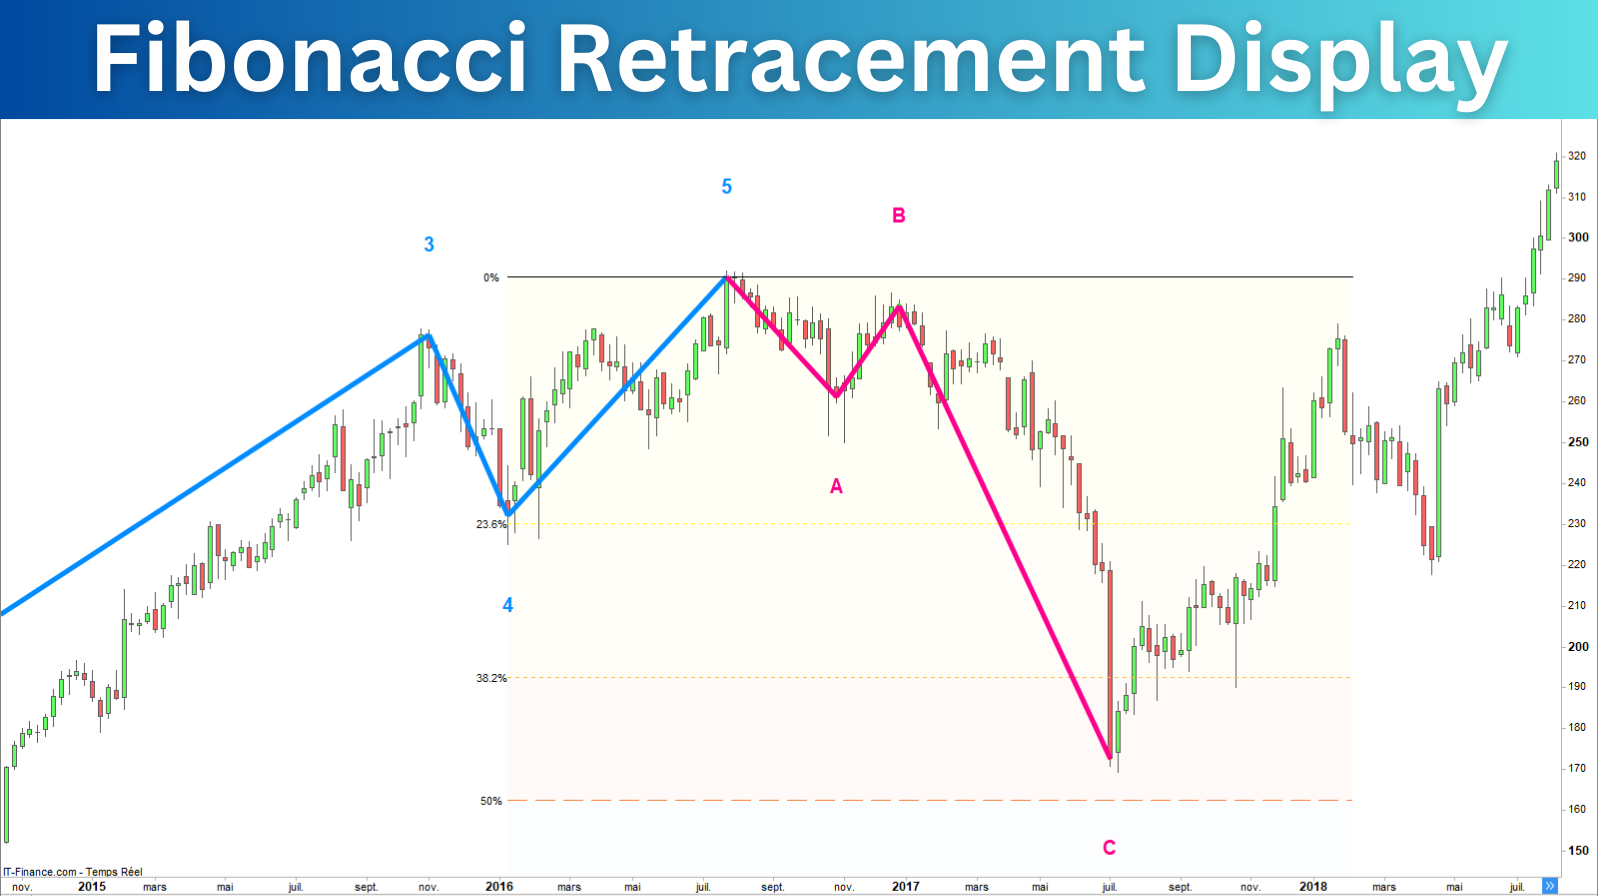
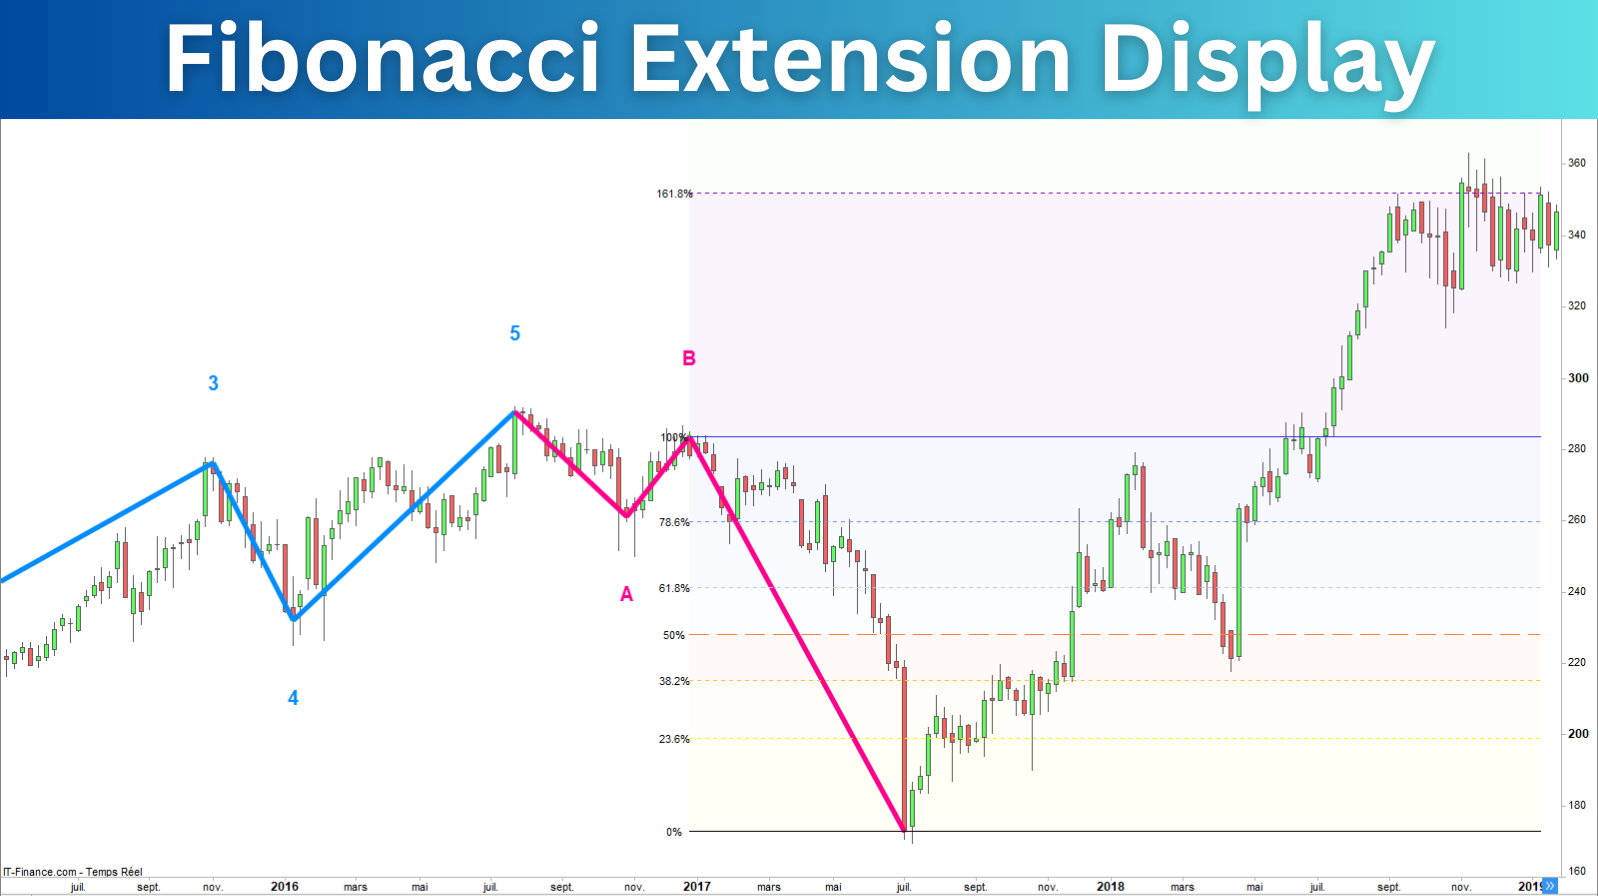
2. Fibonacci Levels Display
The indicator allows the display of Fibonacci retracements and extensions on each wave. The retracements will help you anticipate the depth of the correction. The extensions will help you set your price target.
You will evaluate the coming key price levels
3. Anticipate the Market Corrections
A market correction often follows five impulsive waves. The Advanced Elliott Wave indicator displays the waves when the algorithm recognizes a complete impulsive cycle.
When you see the indicator drawing the fifth impulsive wave, you can consider that a correction may occur.
You will cover or secure your long positions
4. Profit from the Start of the Uptrend
Bear markets can provide opportunities, but no one can say how far they will fall. Even if the third corrective wave often indicates the correction’s end, this is insufficient to buy the market.
The Advanced Elliott Wave indicator provides consistent buying signals. It detects the breakout and retest of waves (5) and (B) and displays the signal on your chart.
You will benefit from the whole coming uptrend
5. Improve your Performance
Although key-level breakouts provide excellent signals, you can improve the performance of this strategy. The Advanced Elliott Wave indicator allows for signal confirmation.
You will activate breakout and retest validation or apply volume and divergence filters. Thanks to these built-in filters, you will increase the success rate of your trades.
You will focus on the best trade opportunities
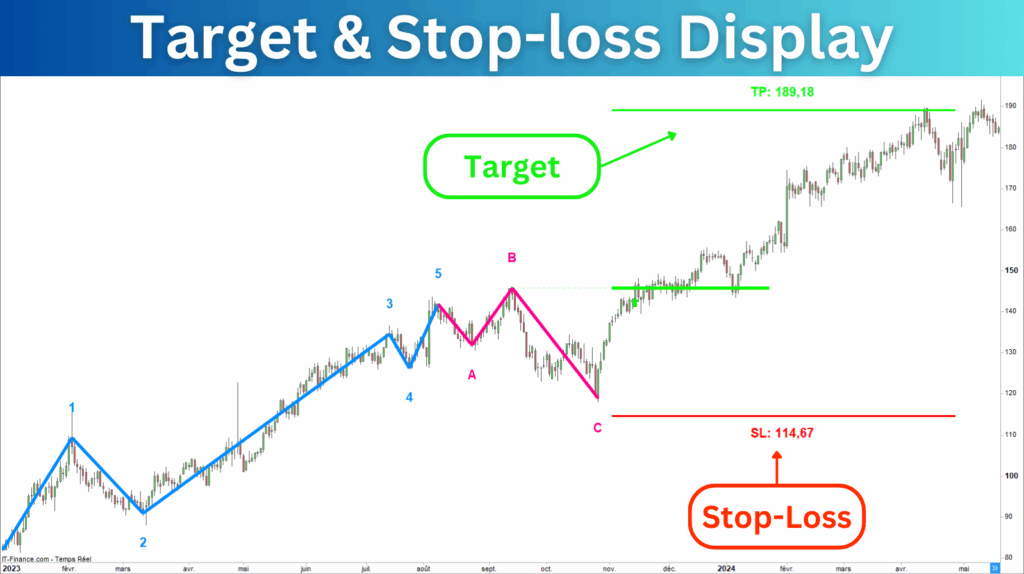
6. Manage Risk with Target and Stop-loss
Risk management is essential in trading. Often neglected by traders, limiting losses and securing profits will determine your trading performance.
The Advanced Elliott Wave indicator displays the targets and stop-losses on the price chart.
You will maximize your profits and control your risk
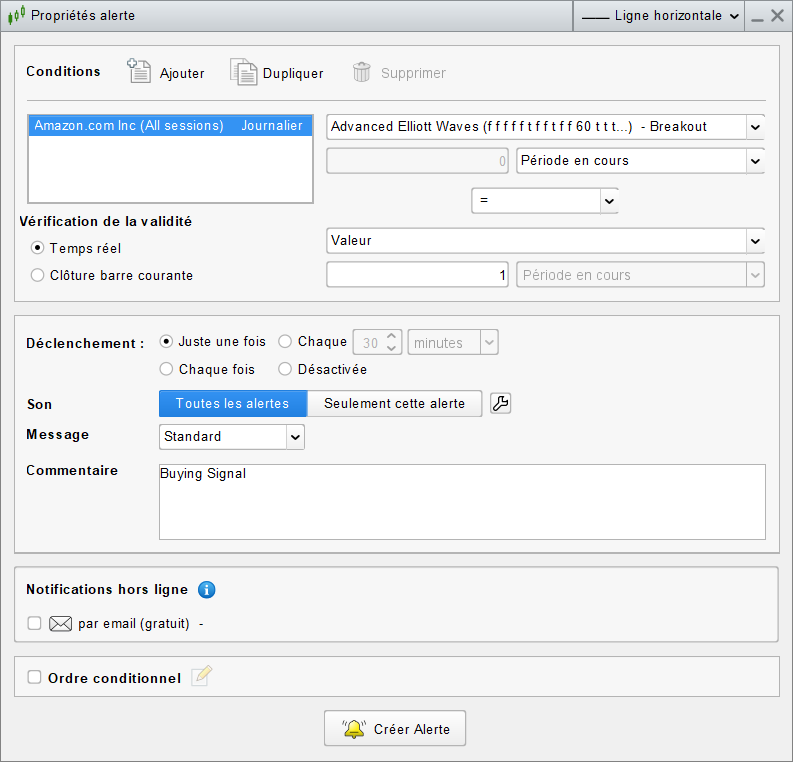
7. Trading Alerts
The Advanced Elliott Wave indicator allows for trading alert activations. The Prorealtime platform will notify you when the price breaks a key level.
You will create an alert on all assets in all timeframes.
You will never miss a trade opportunity again
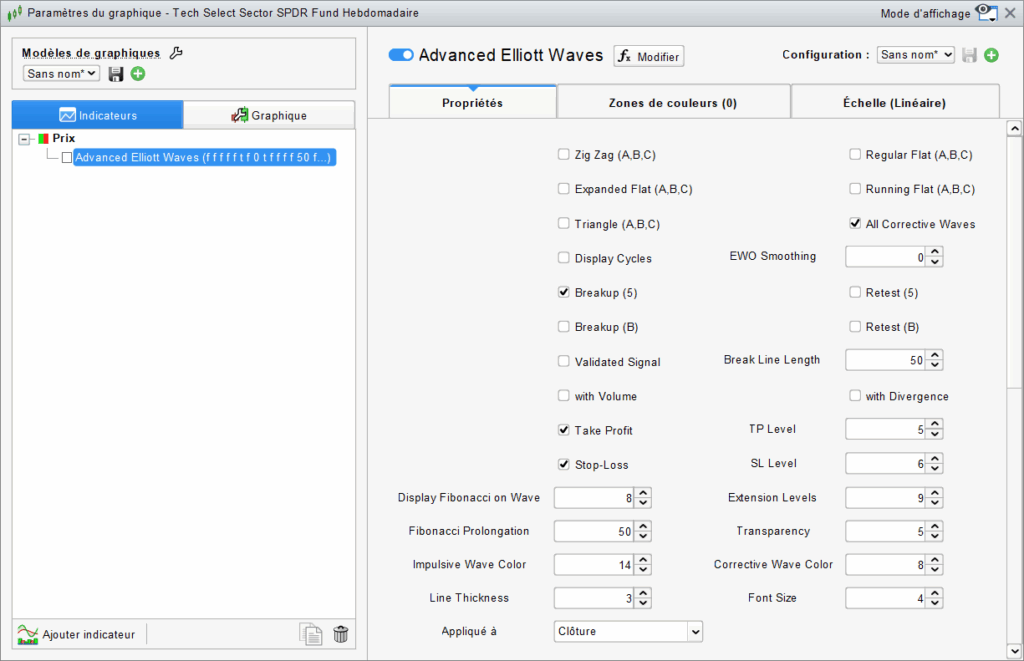
8. Adapt the Indicator to Your Needs
The indicator is fully customizable. You can select the type of corrective waves, choose the signals, apply filters, display Fibonacci levels, and customize the display.
Type of Corrective Waves
Zig Zag
Regular Flat
Expanded Flat
Running Flat
Triangle
All Corrective Waves
Type of Signals
Breakup of Wave 5
Retest of Wave 5
Breakup of Wave B
Retest of Wave B
Signal Confirmation
Signal Validation
Volume Confirmation
Strength Confirmation
Fibonacci Display
Select the Wave for Display
Determine the Extension Levels
Length of Fibonacci Lines
Transparency of Fibonacci Area
Risks Management
Target Display
Target Level Setting
Stop Loss Display
Stop Loss Level Setting
Waves Display
Impulsive Wave Colors
Corrective Wave Colors
Line Thickness
Elliott Wave Oscillator Smoothing
You will adapt the indicator to your trading style
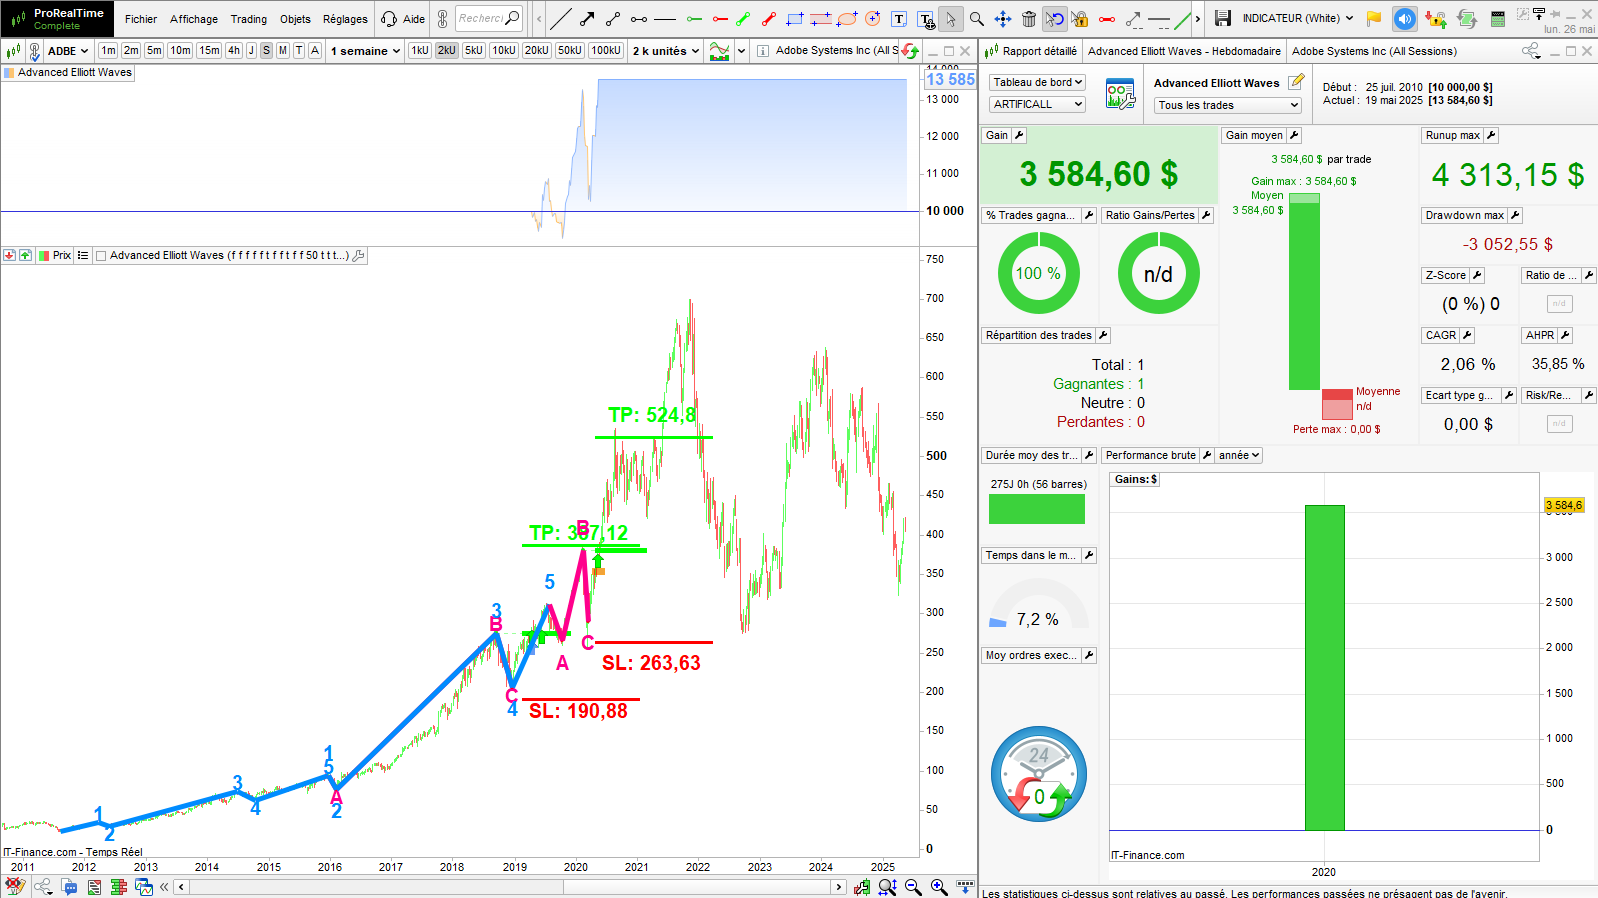
9. Backtest and Automated trading
The Advanced Elliott Wave indicator is perfectly integrable in a backtest.
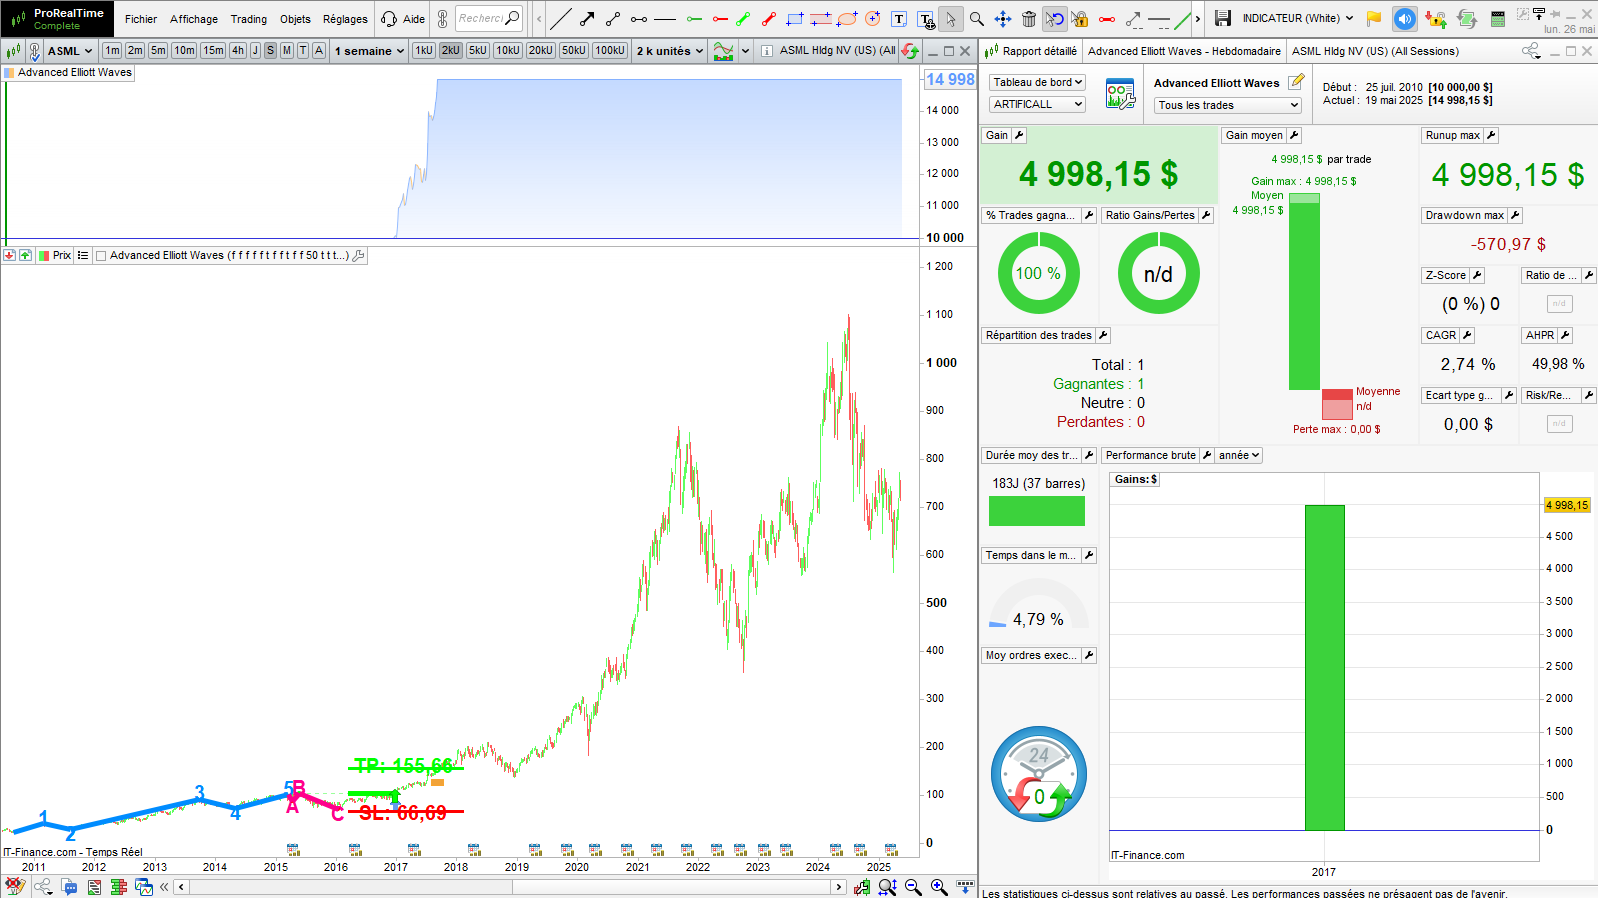
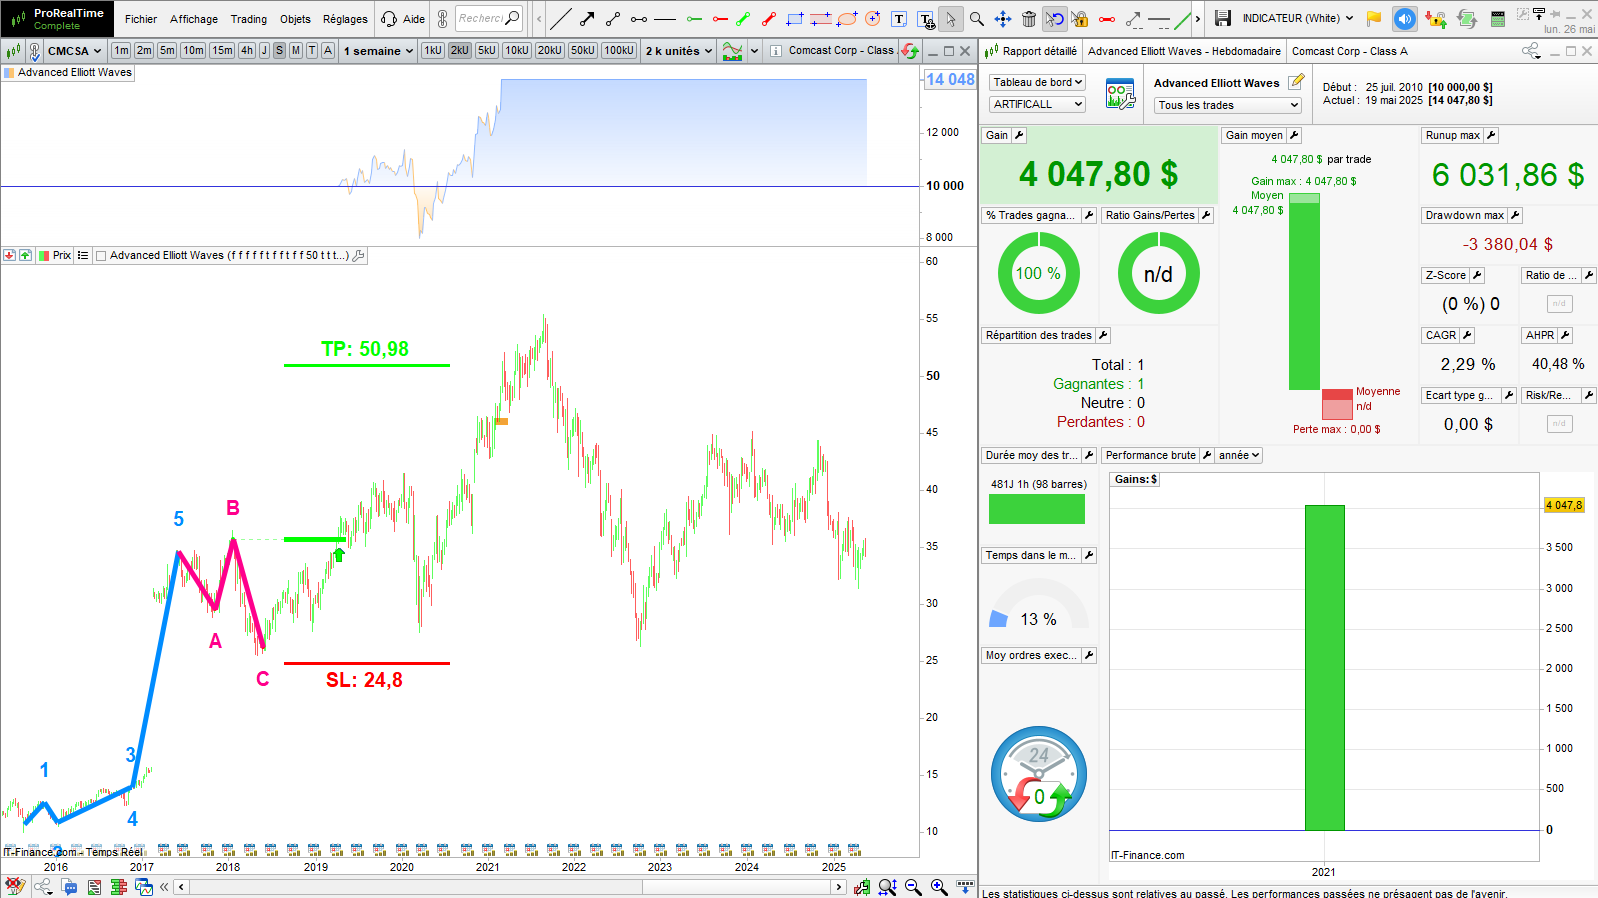
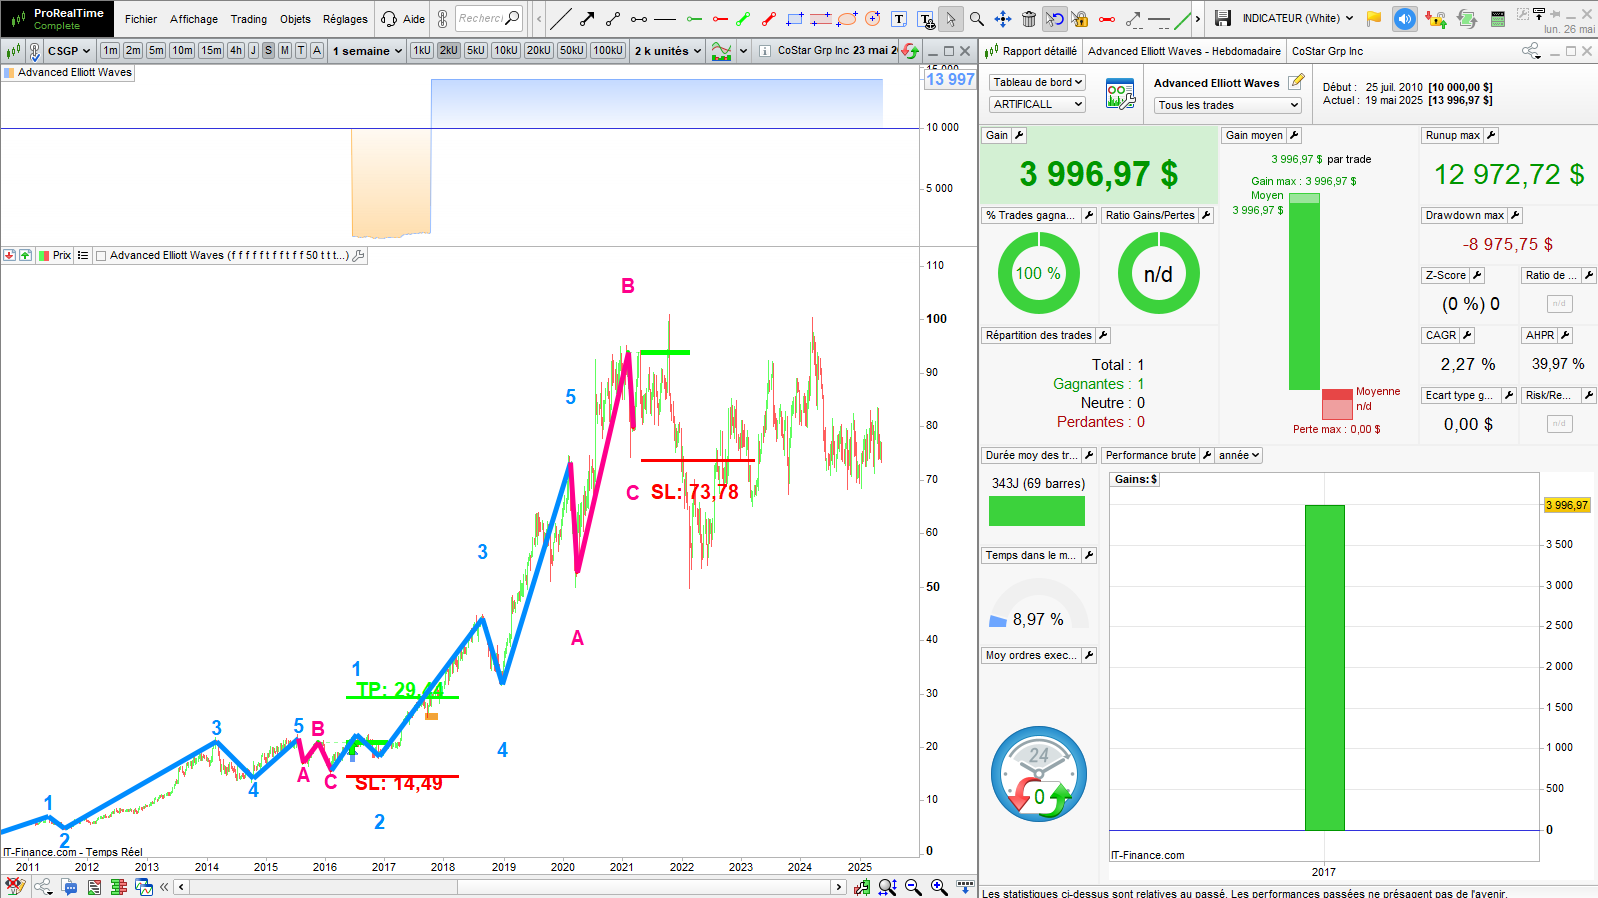
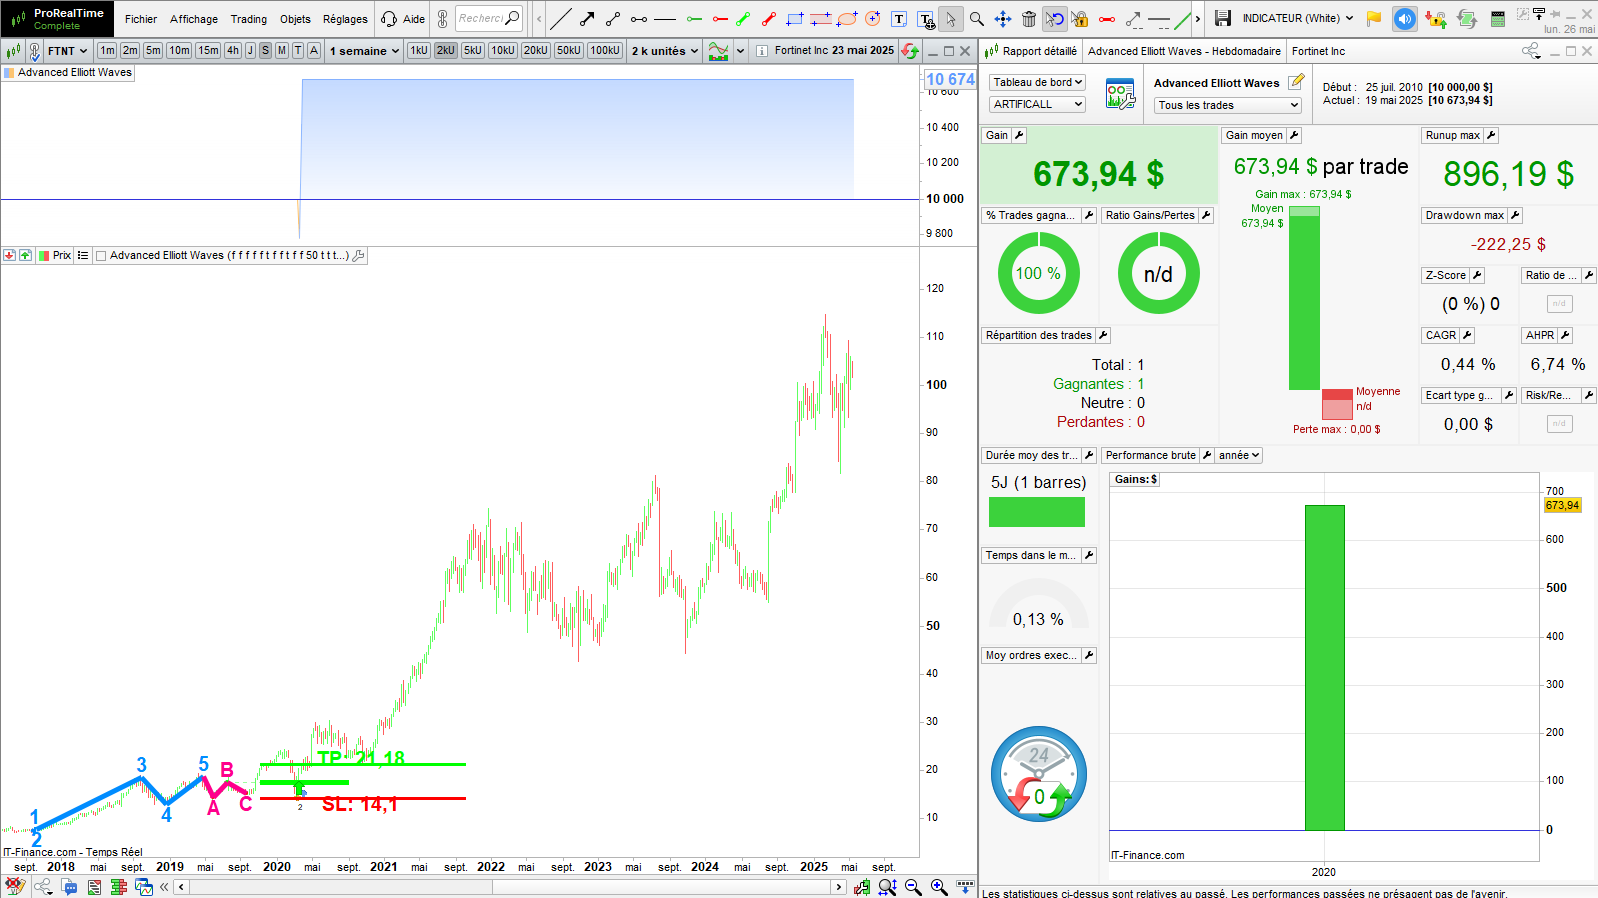
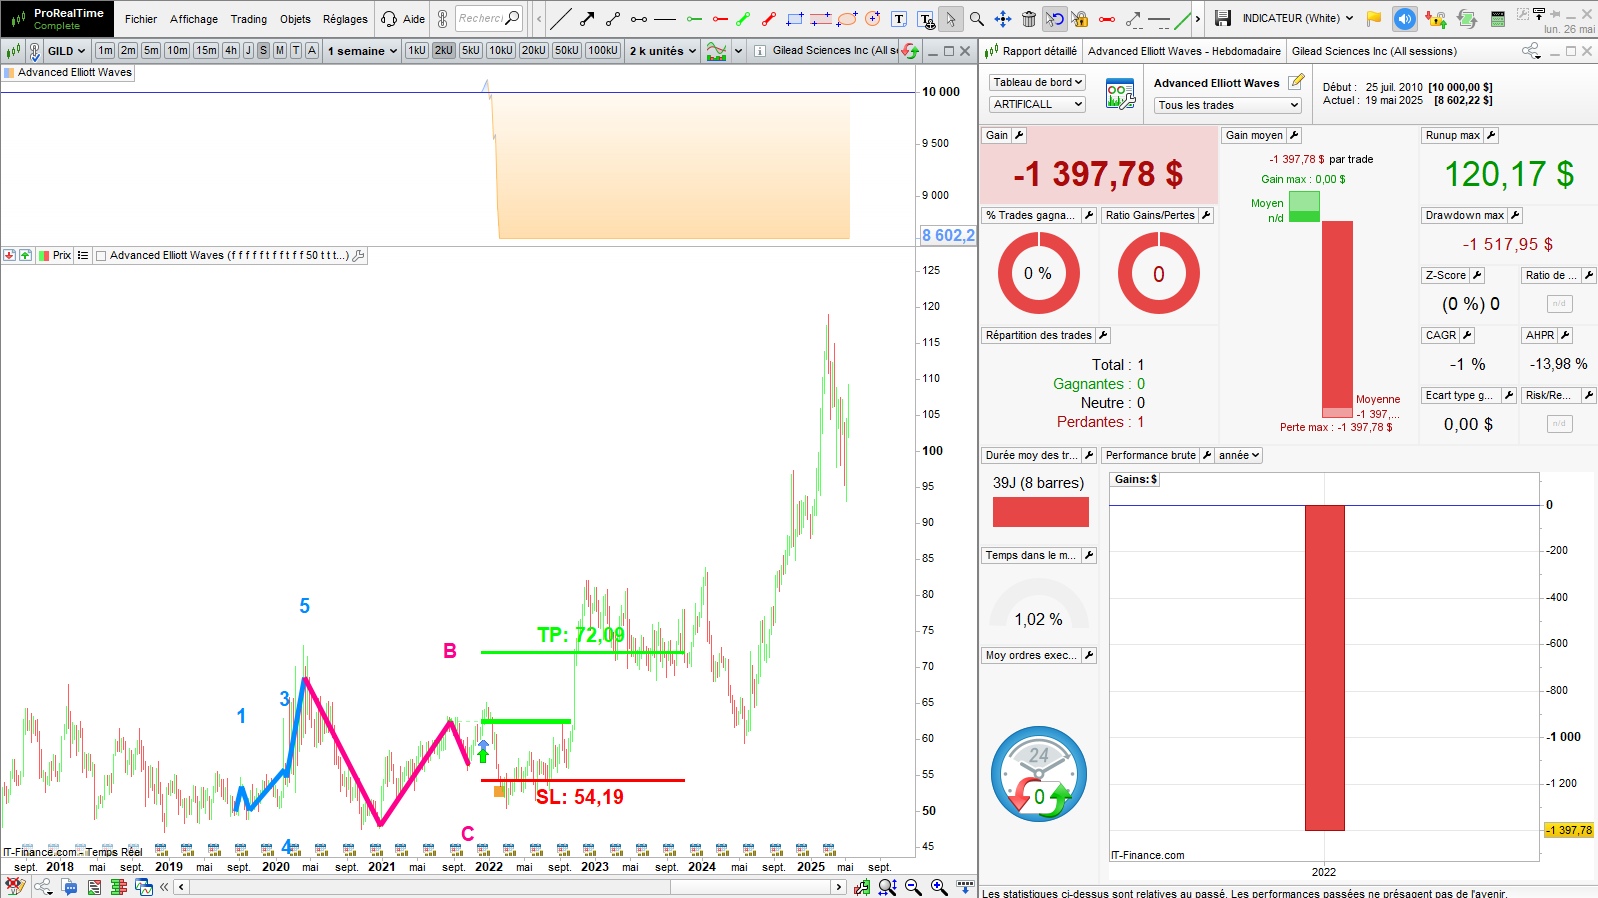
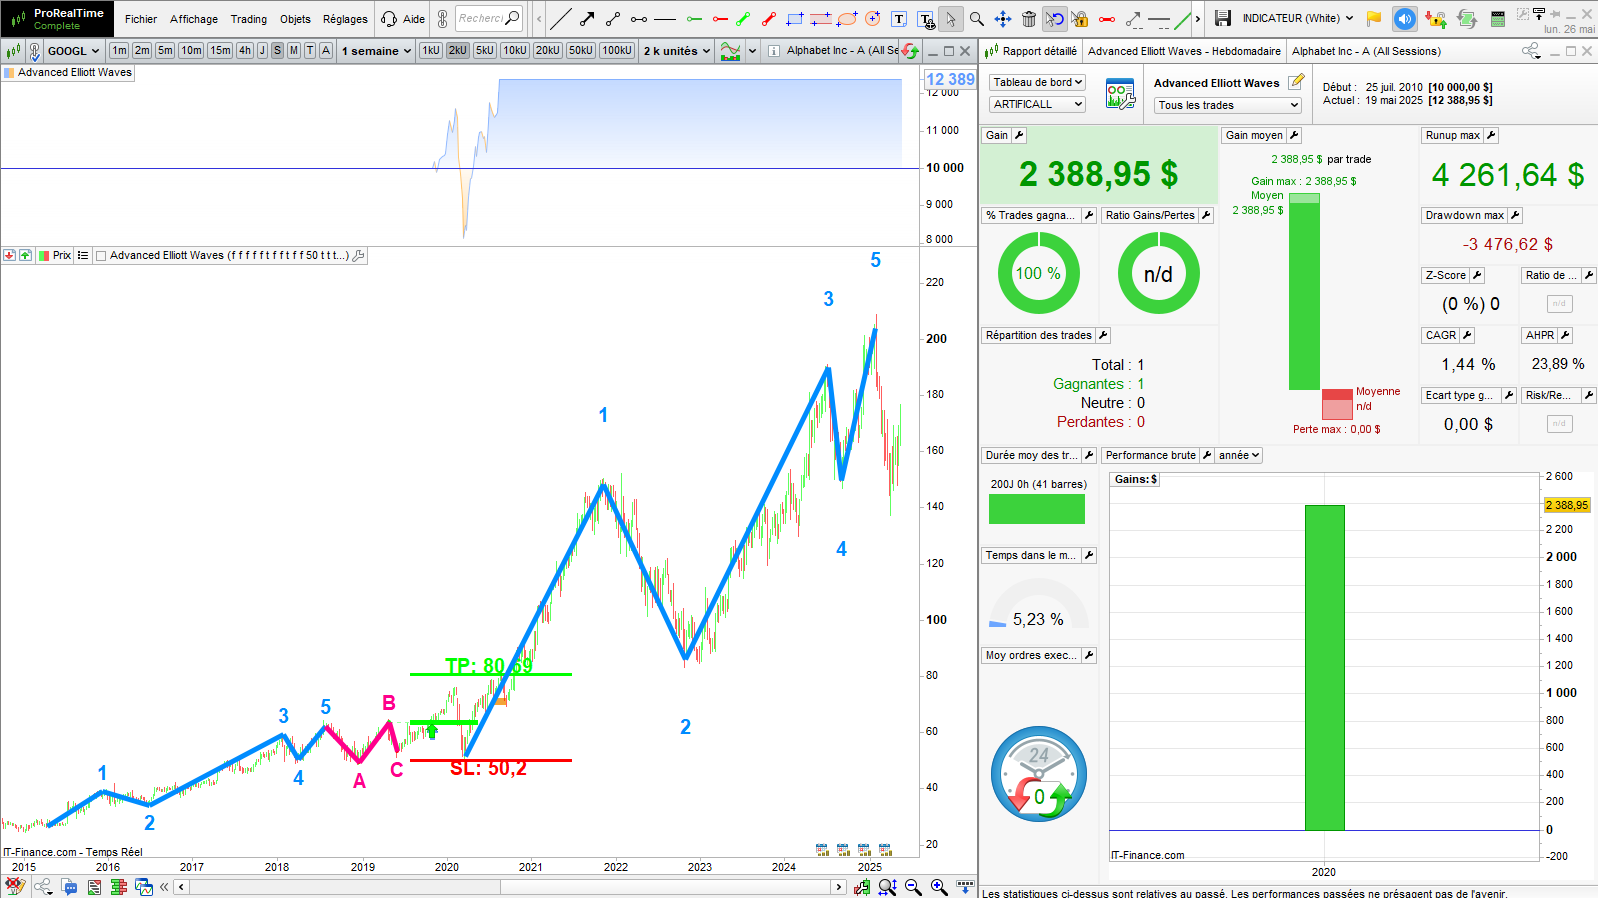
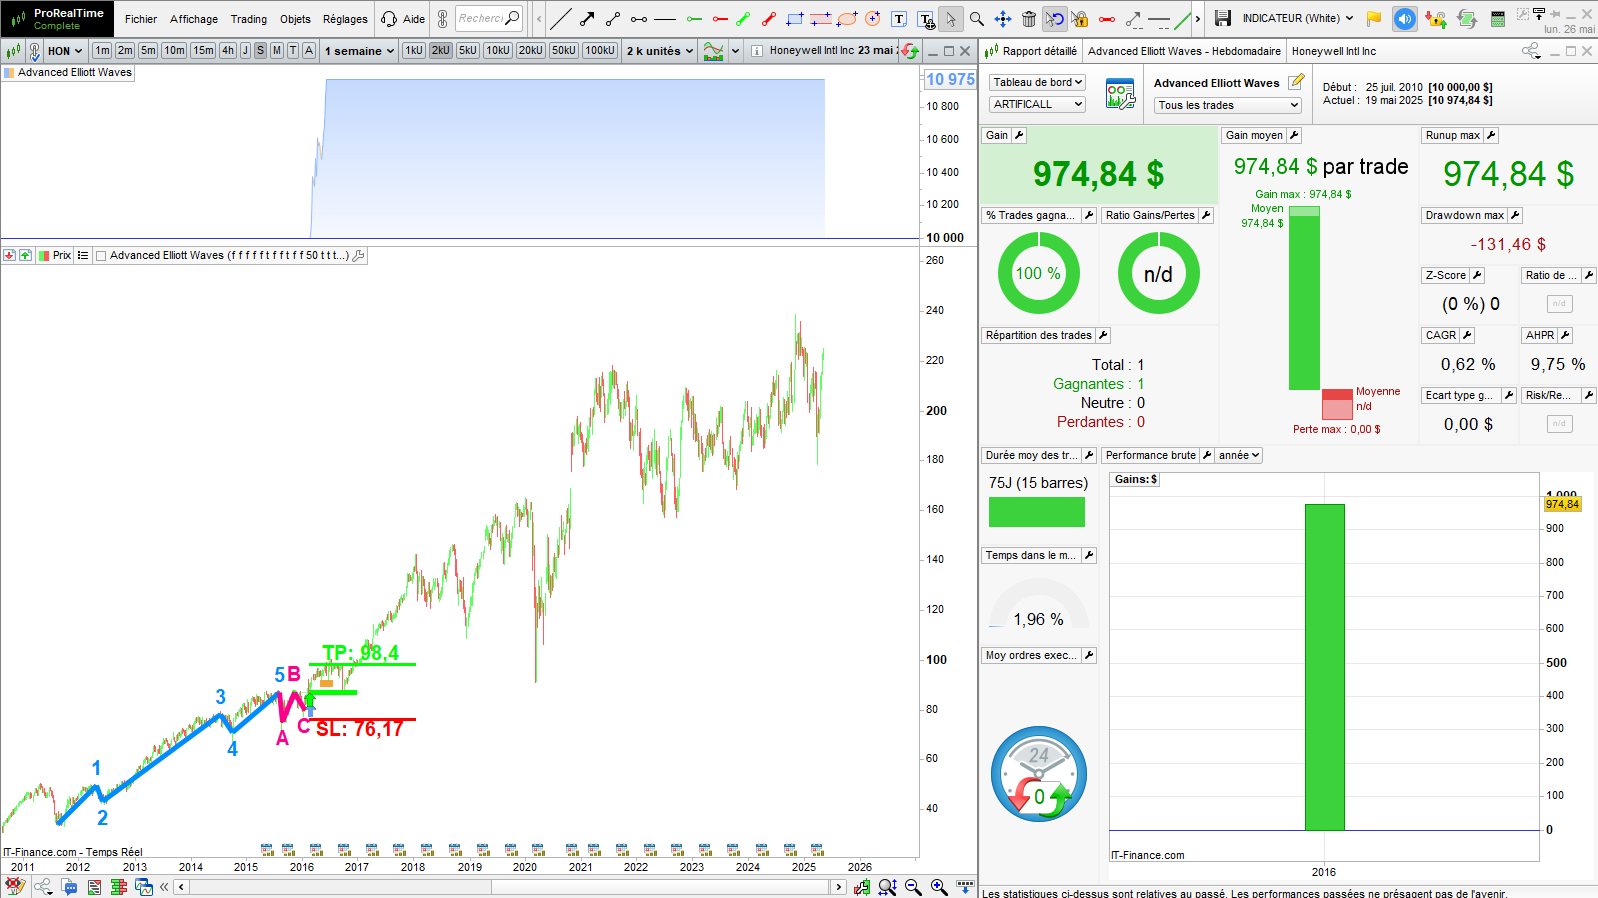
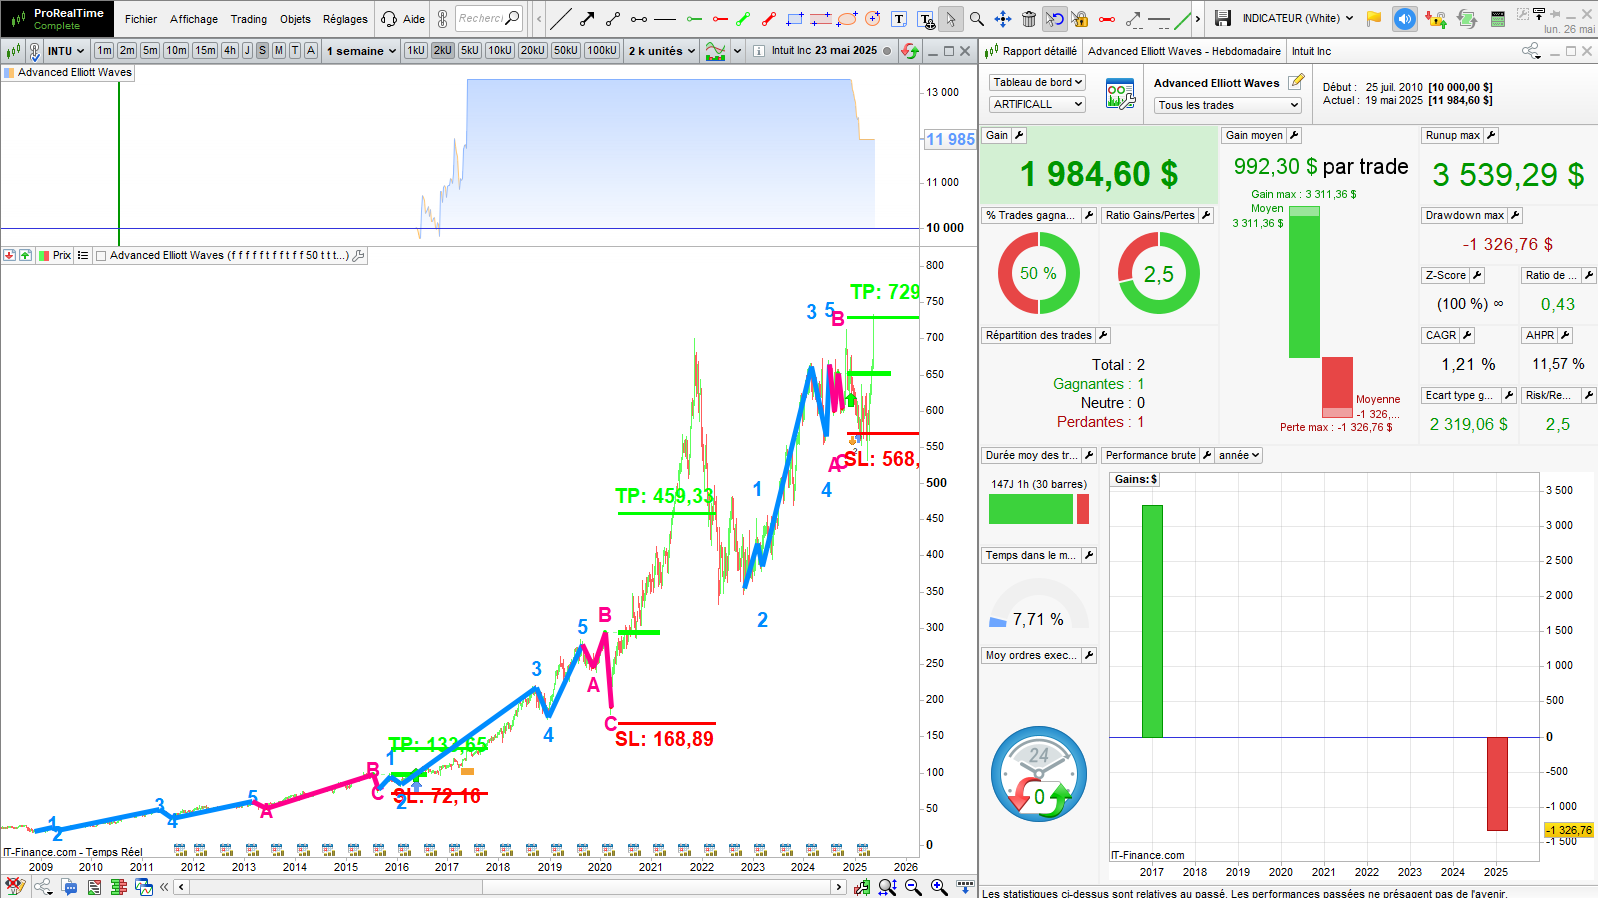
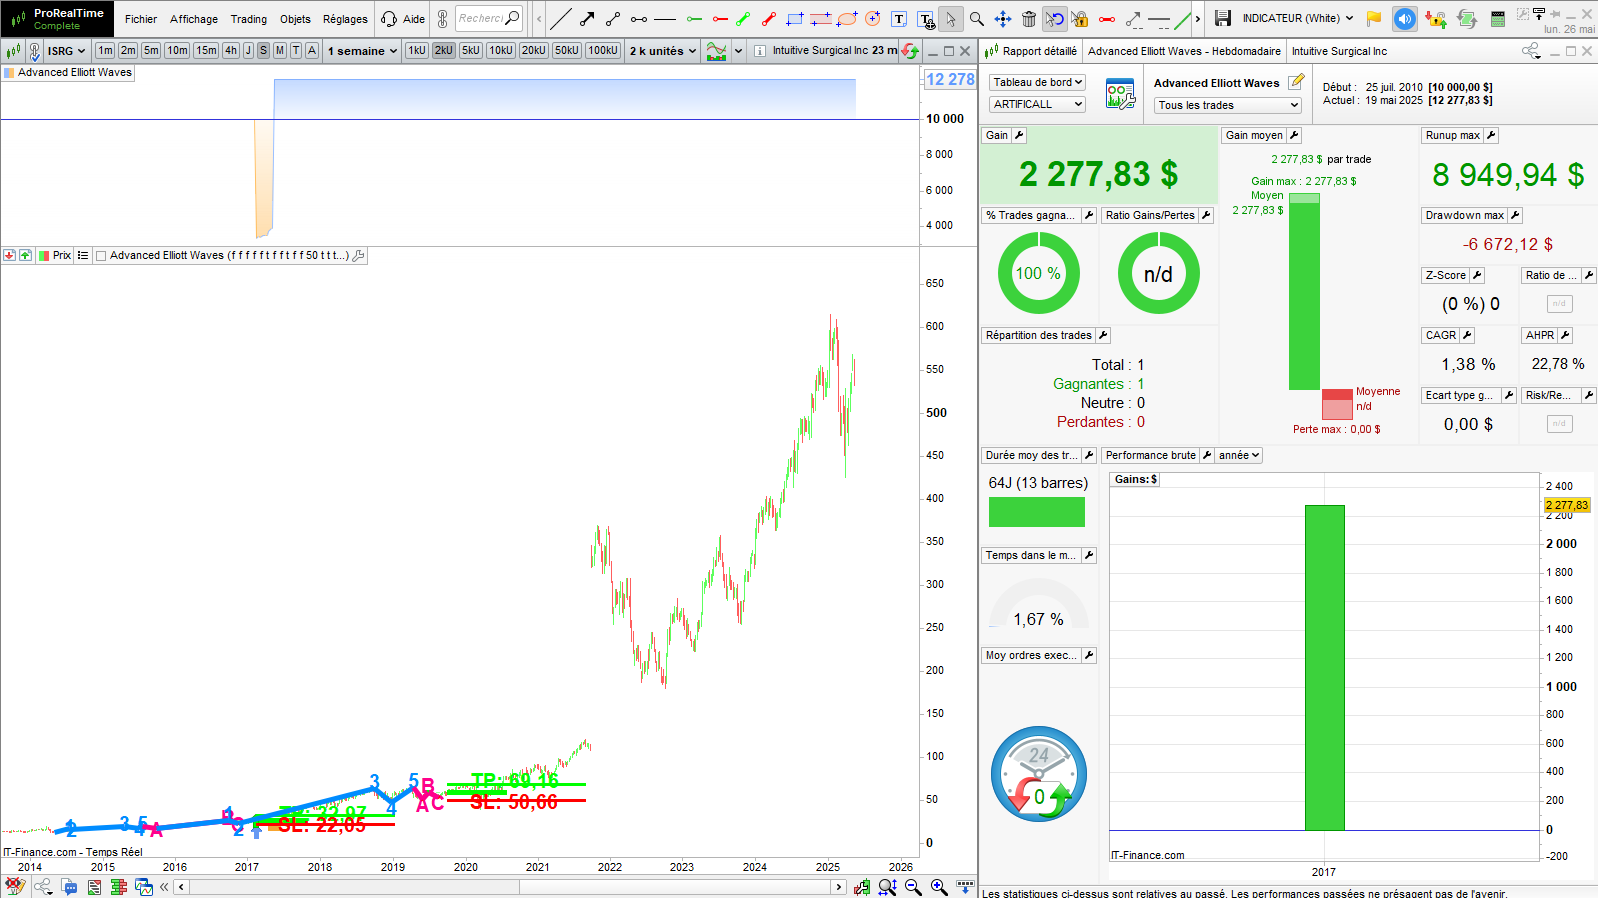
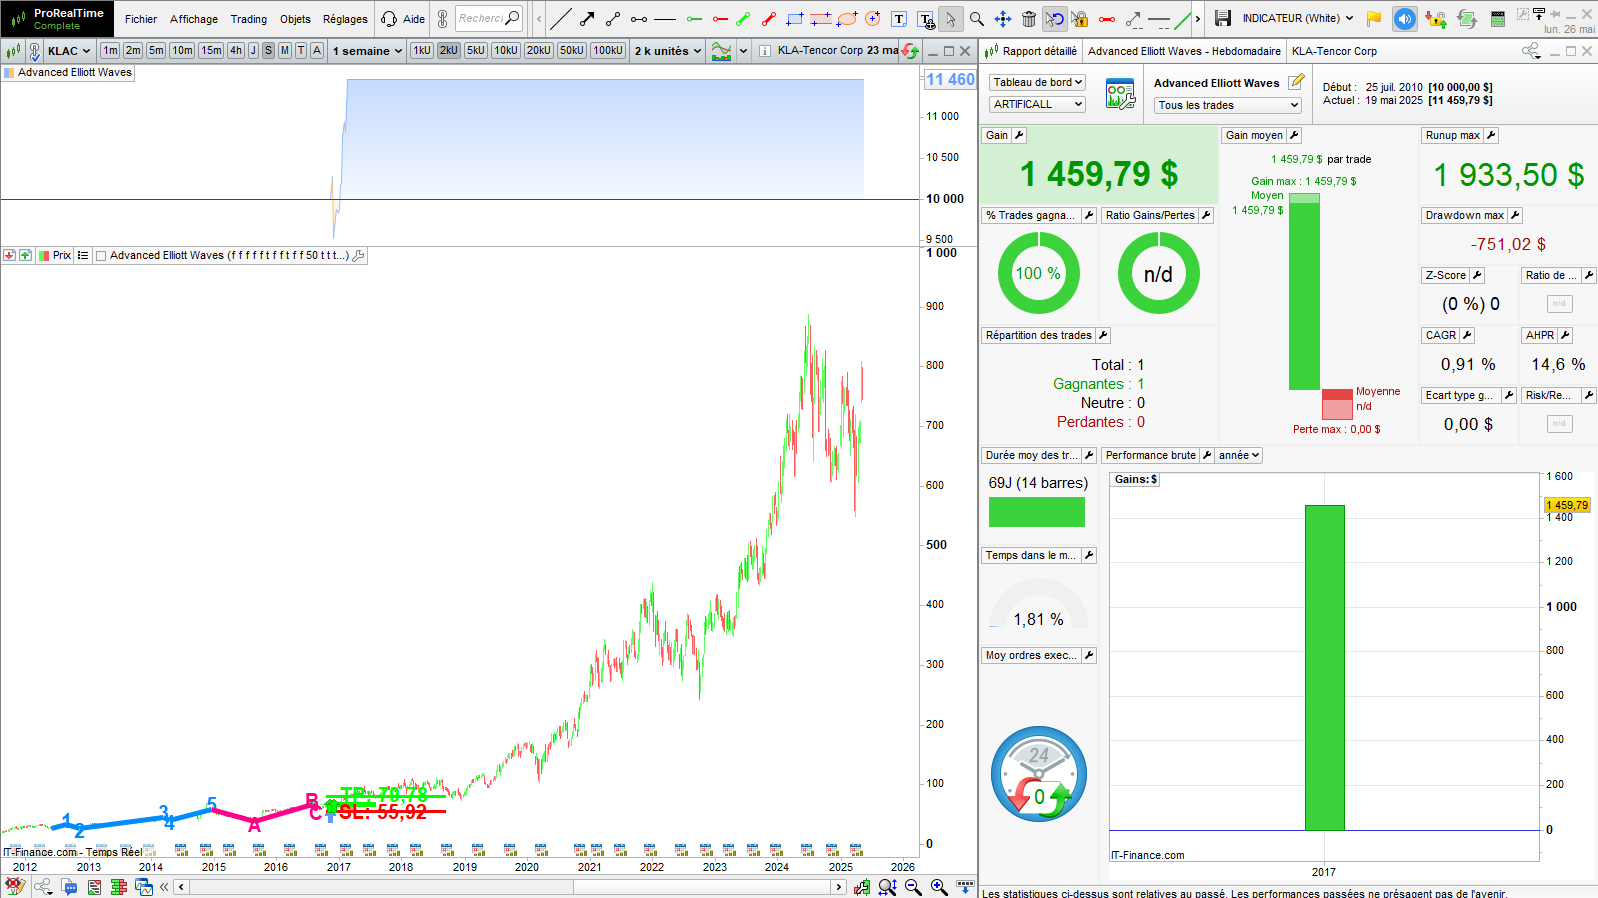
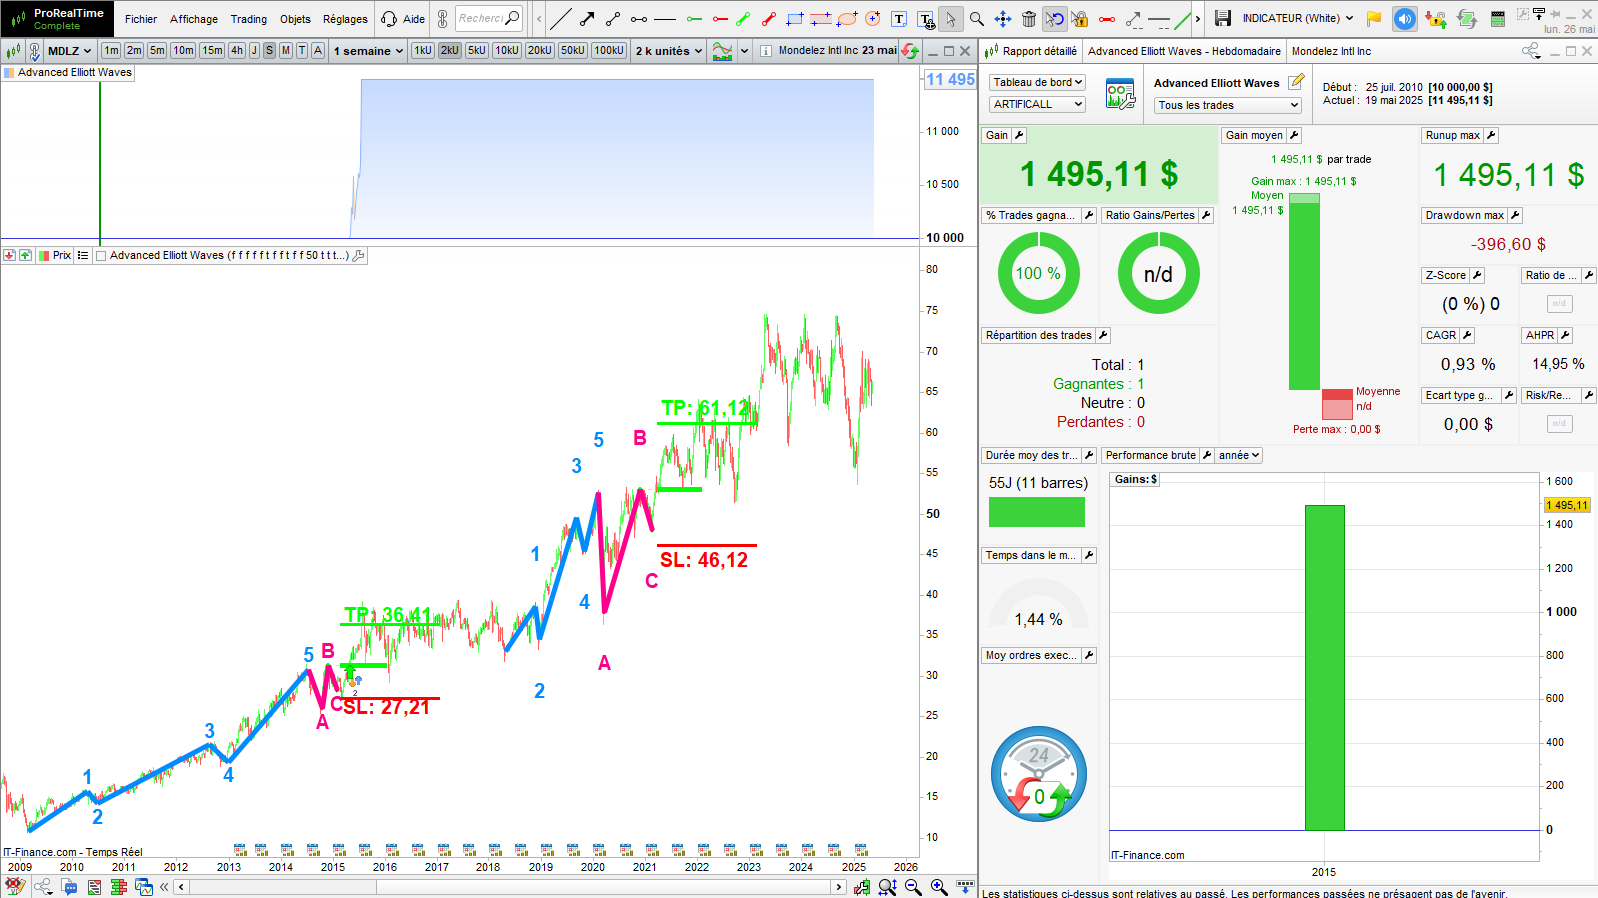
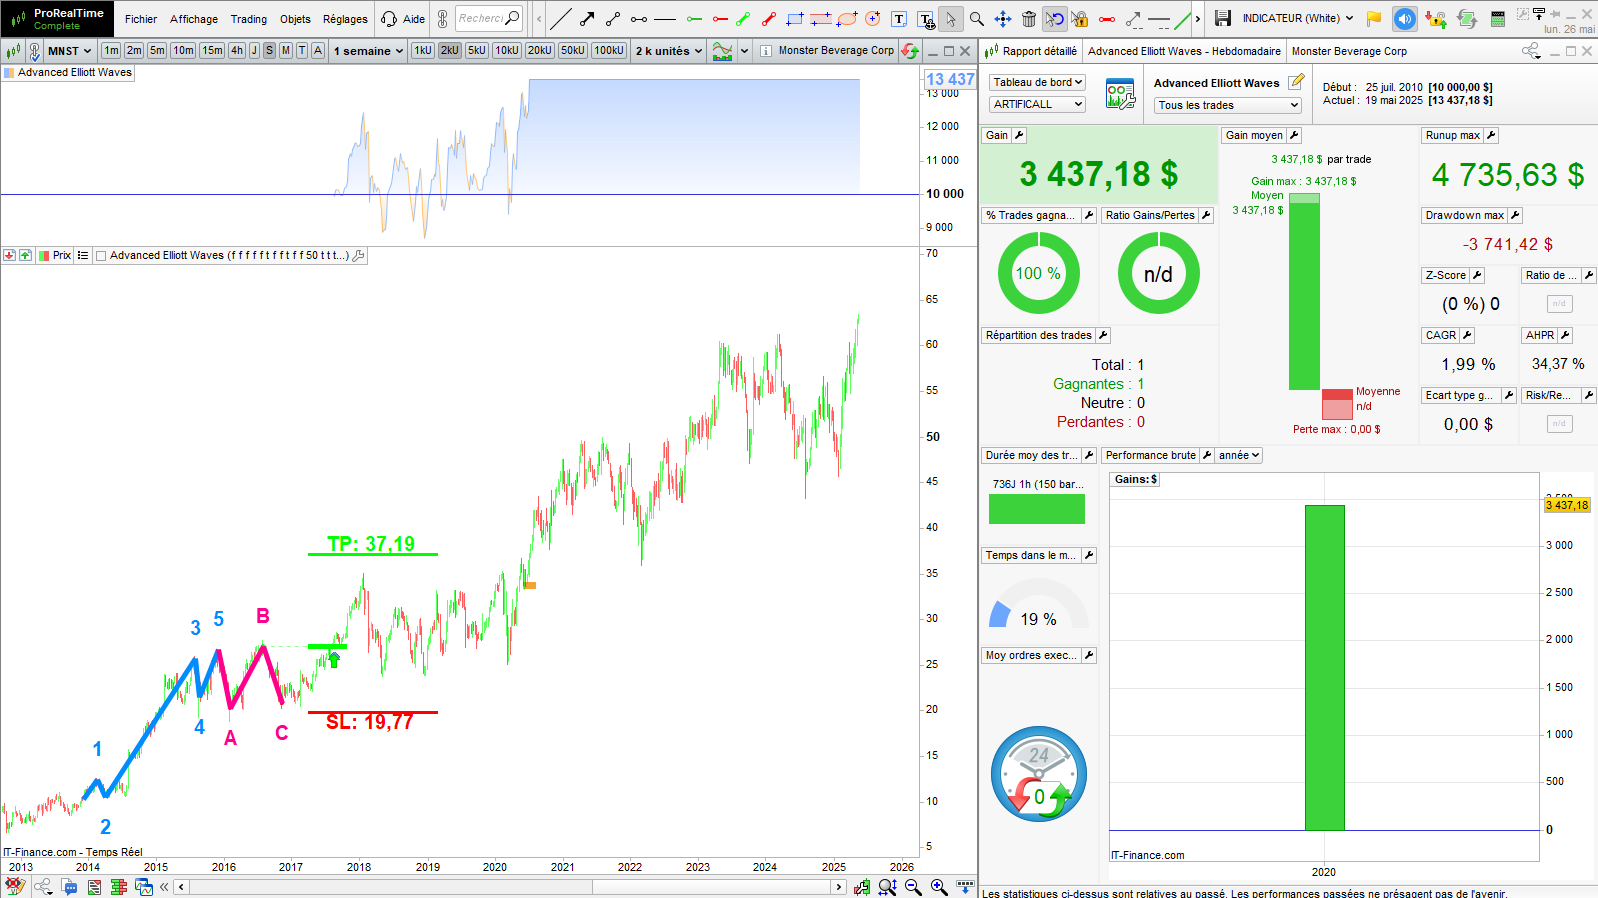
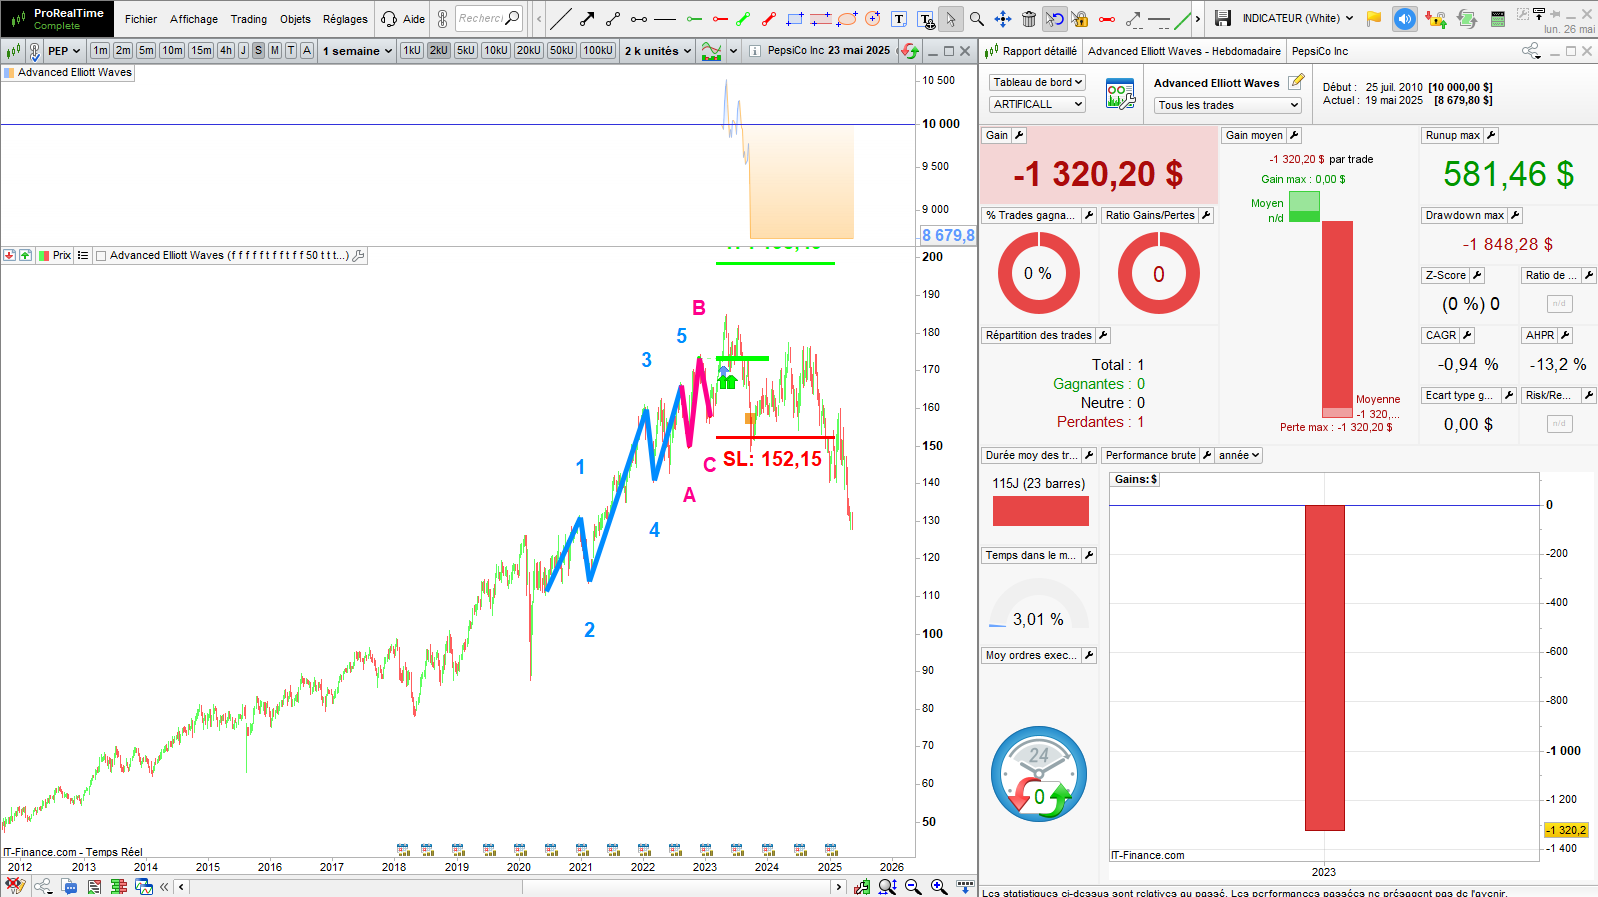
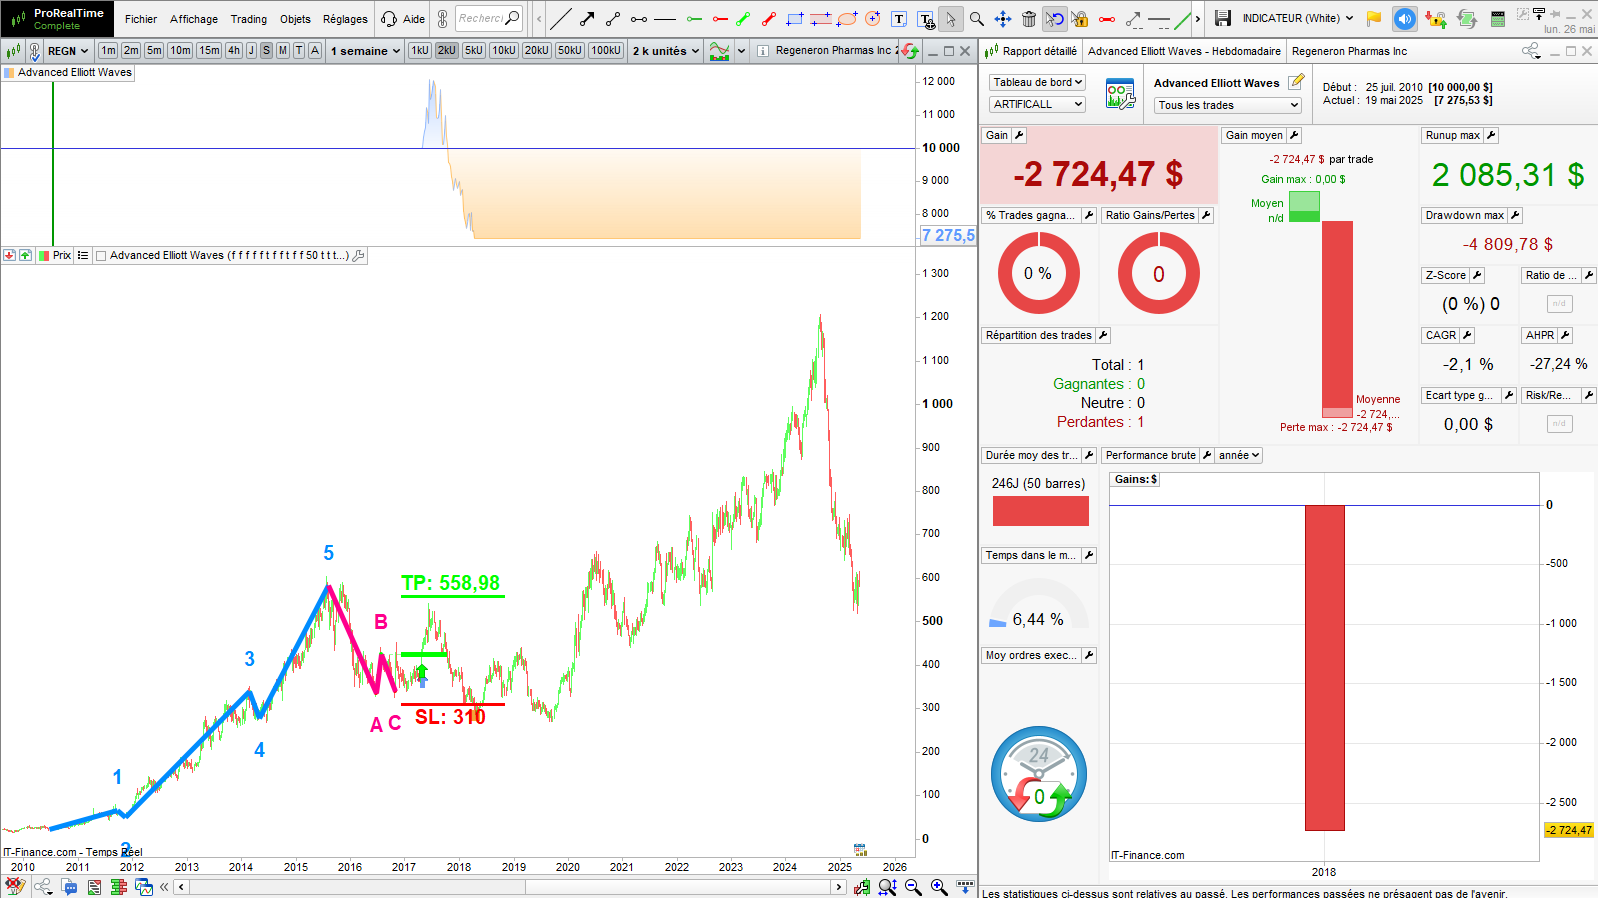
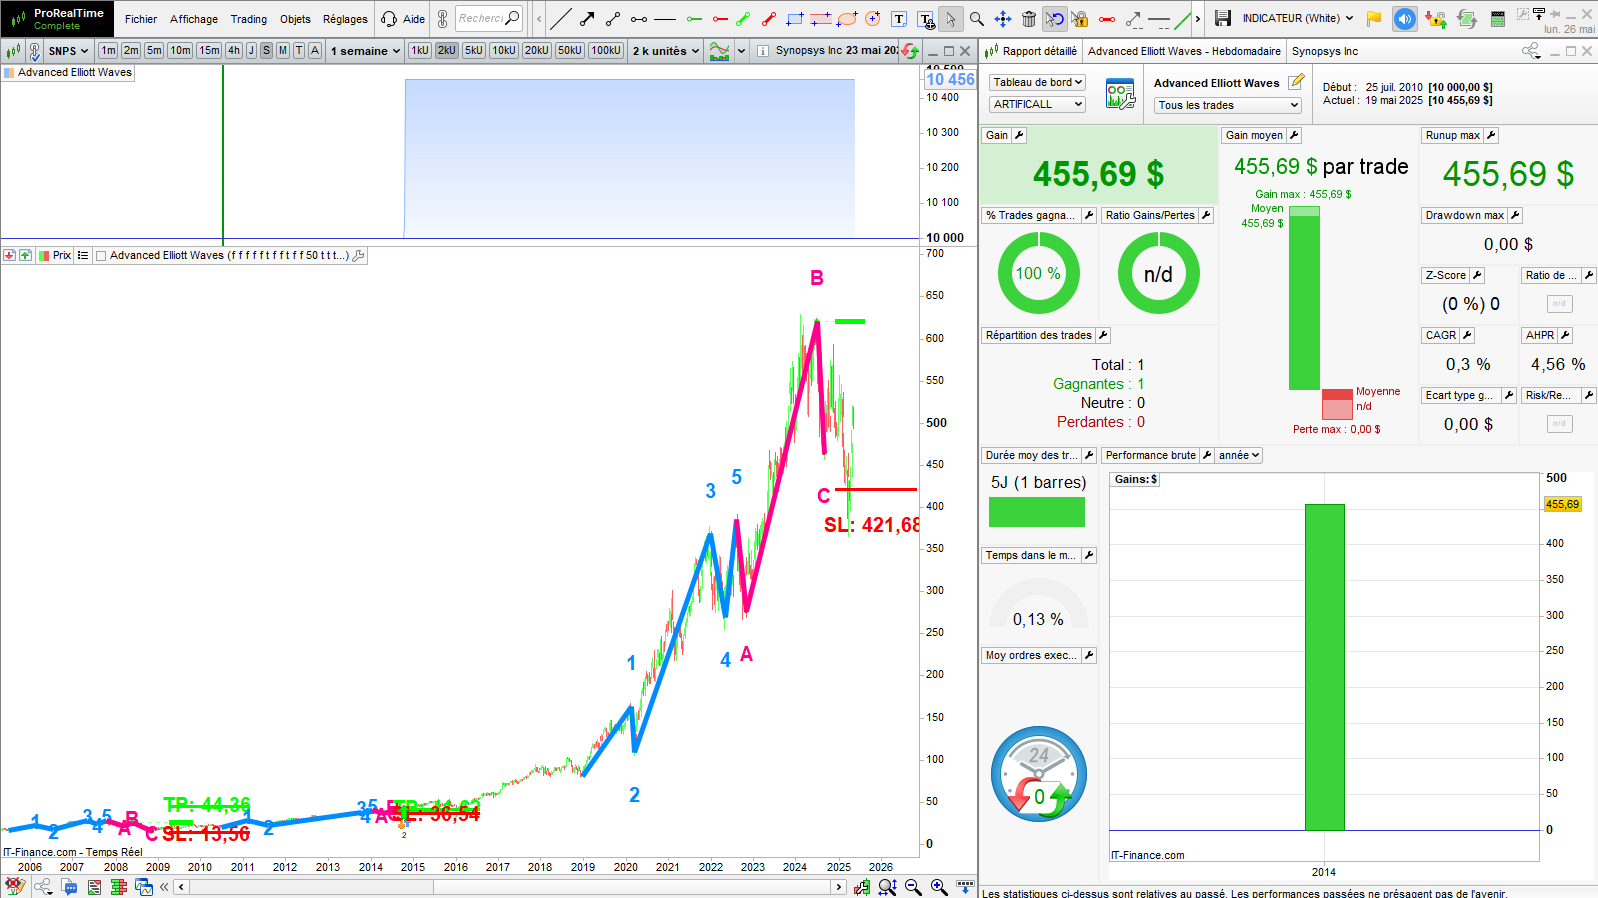
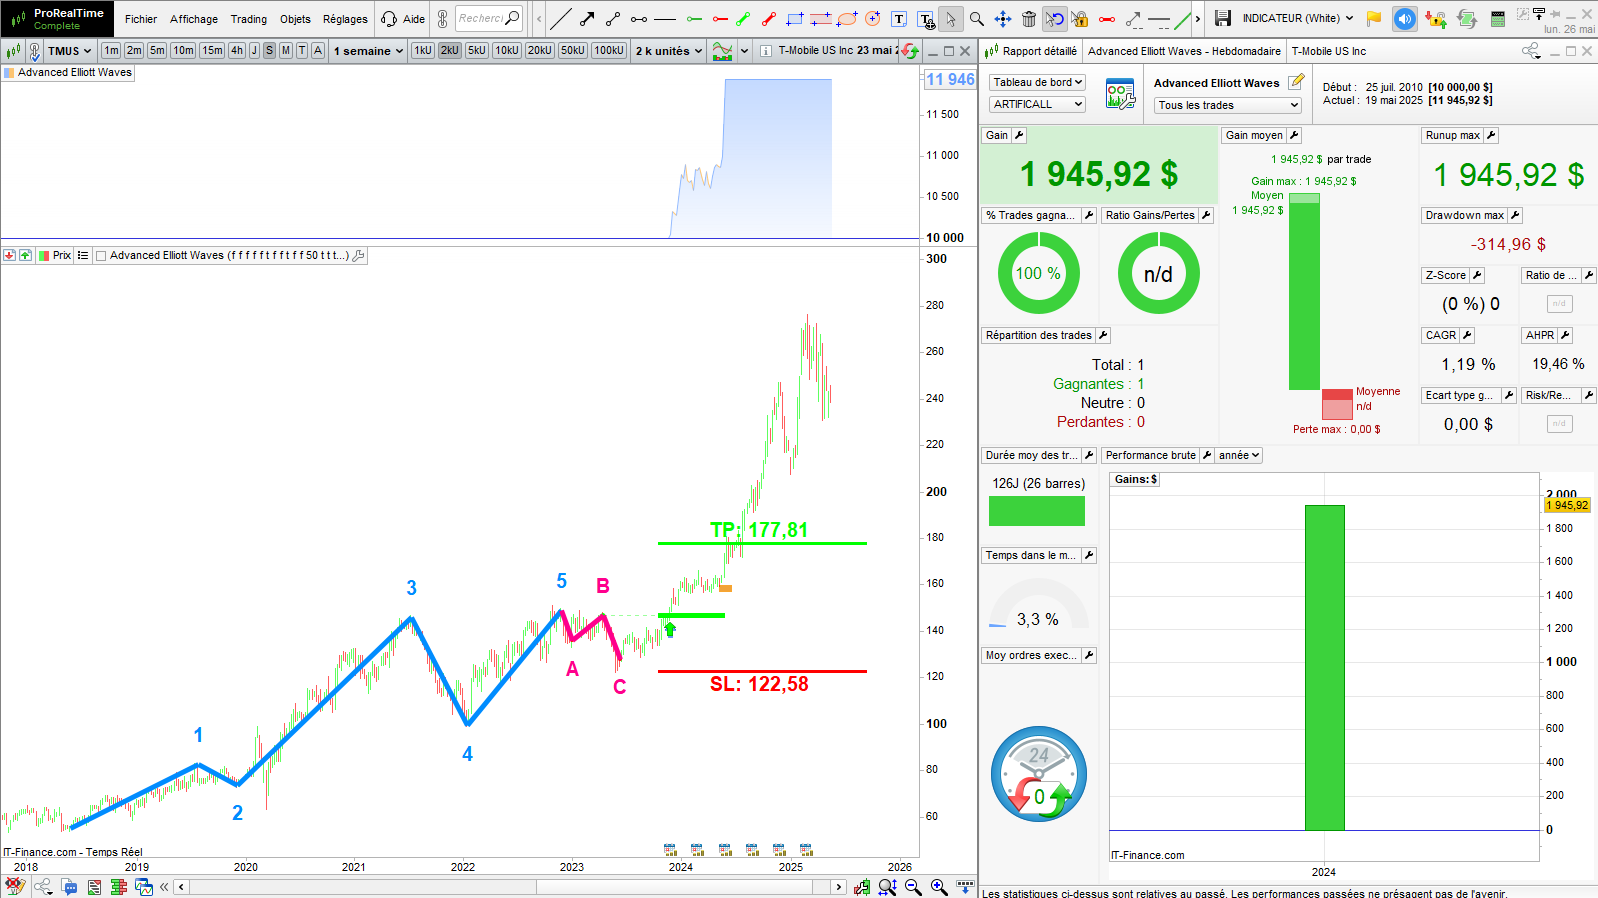
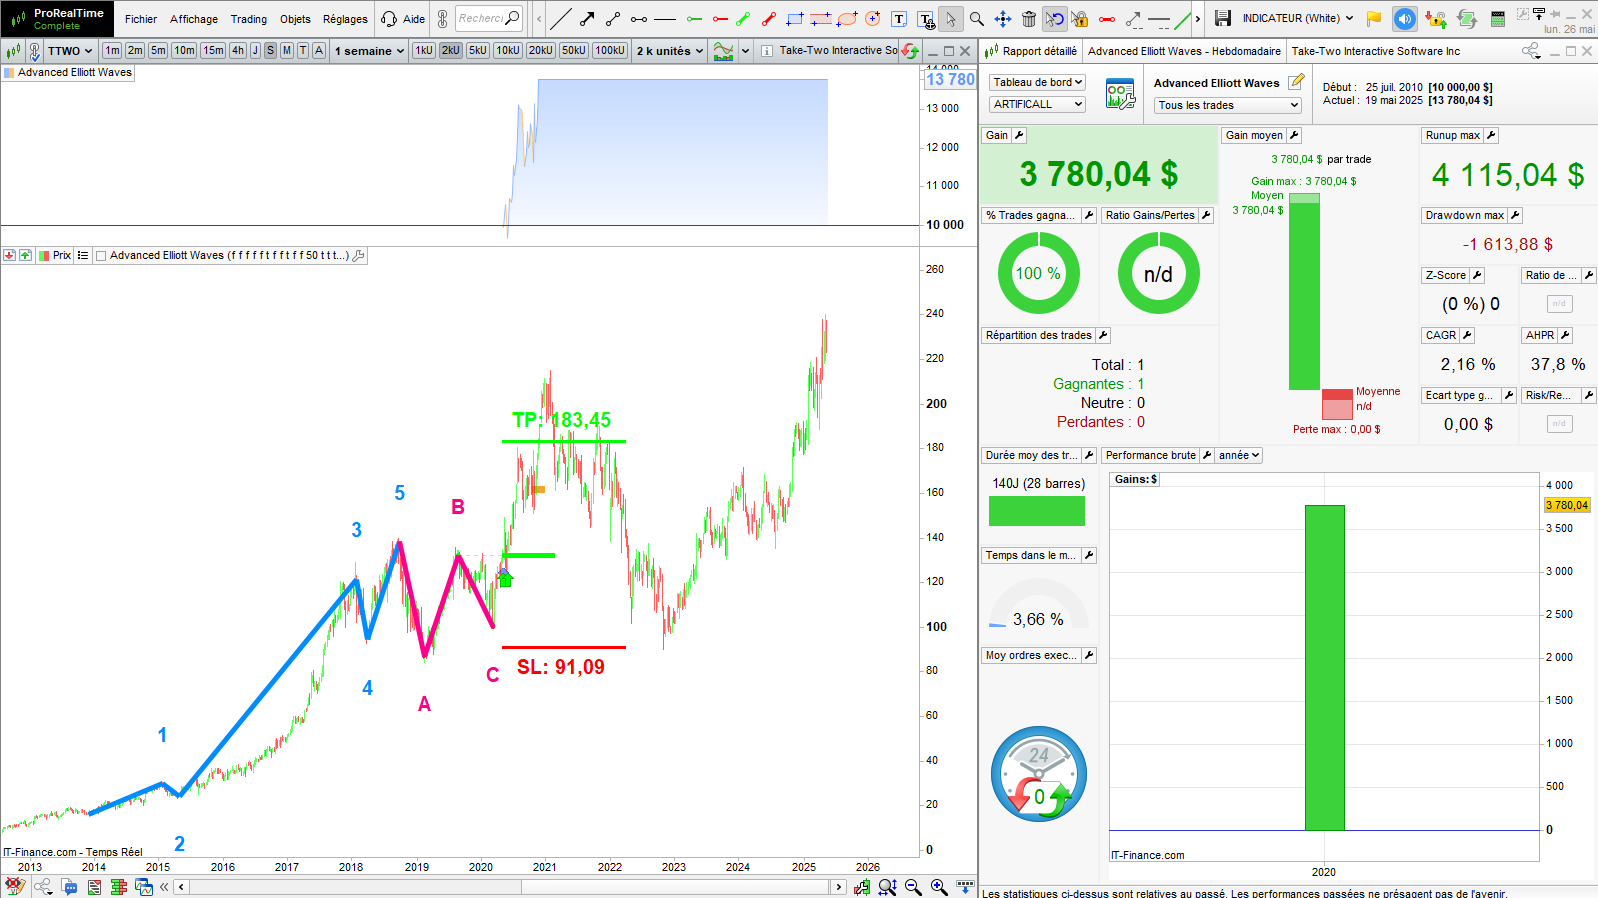
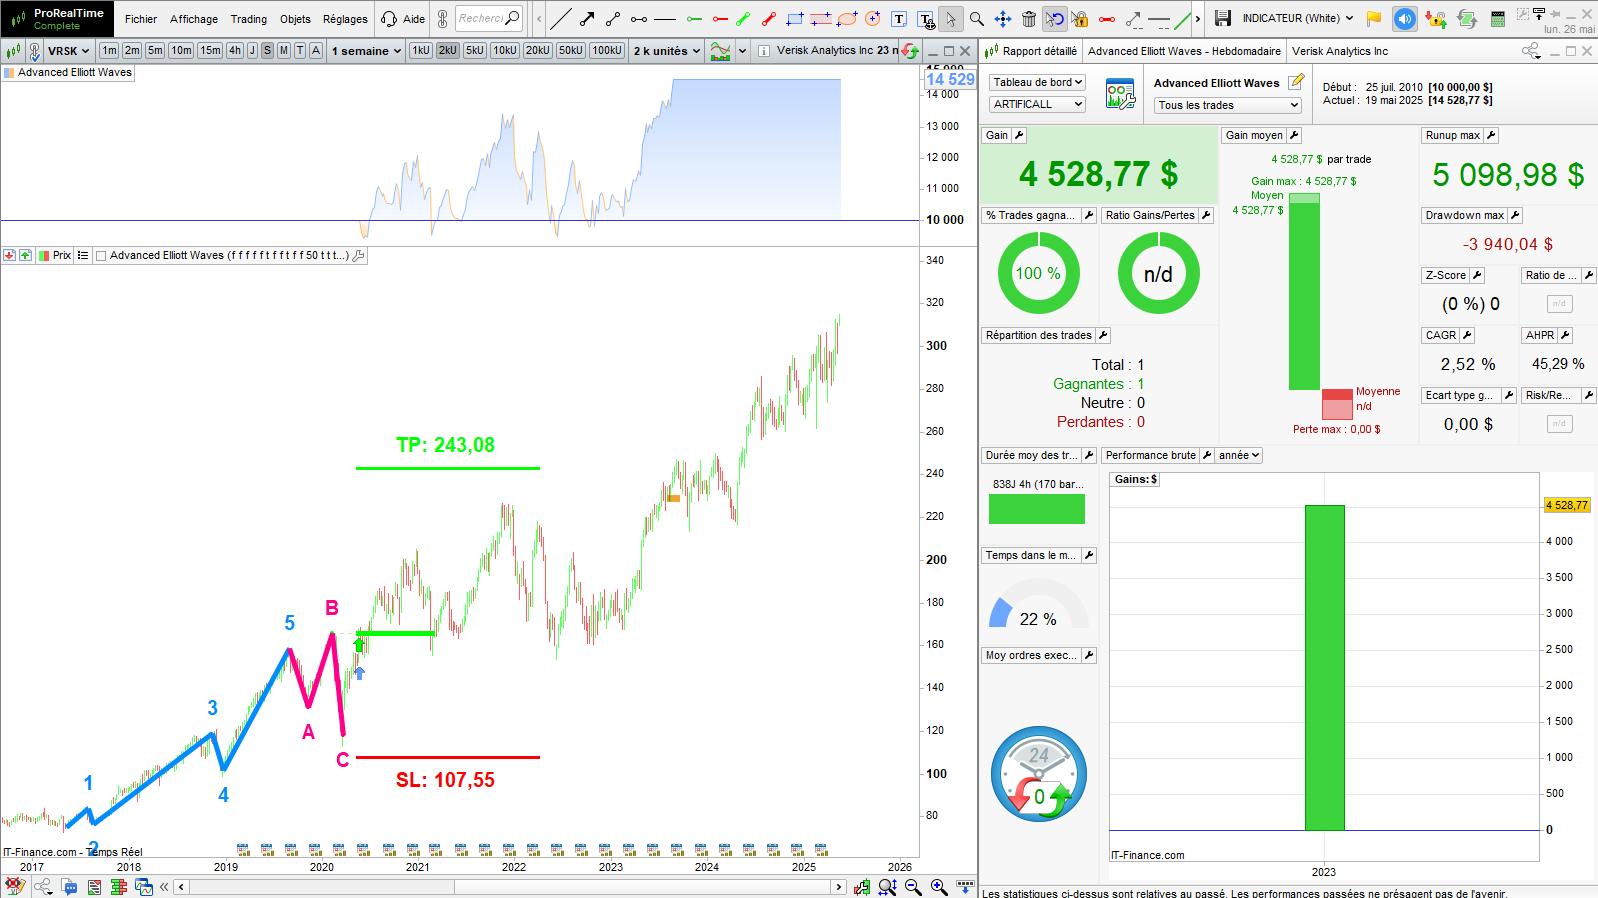
The following strategy opens a long entry after the breakout of the B Wave with volumes and strength. It closes the entry on the 261.8% Fibonacci level:
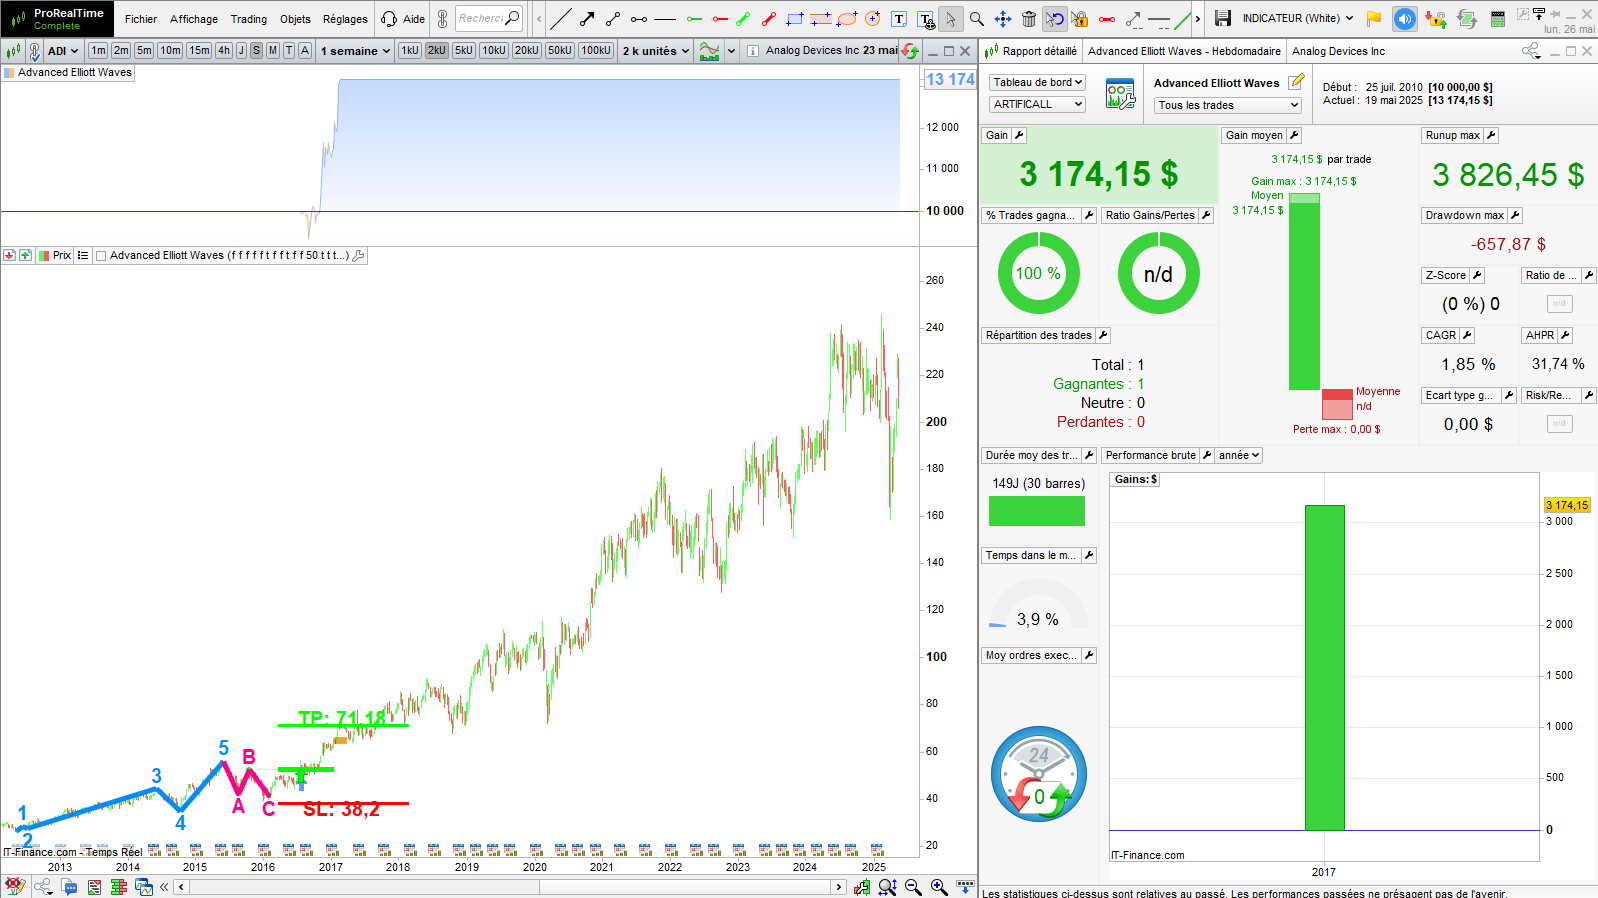
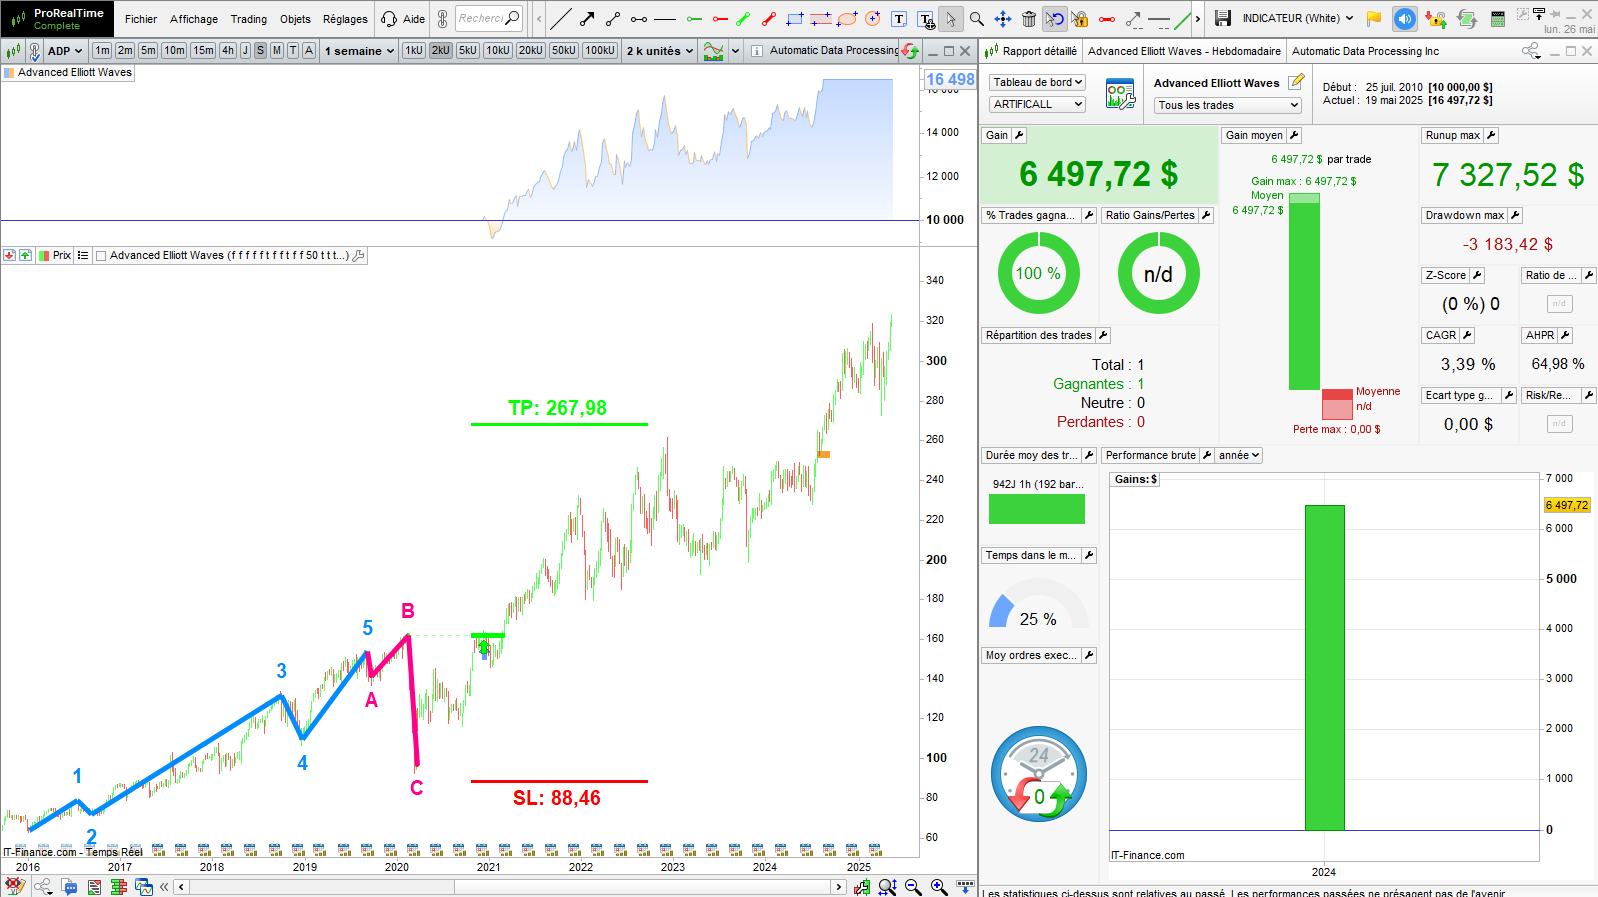
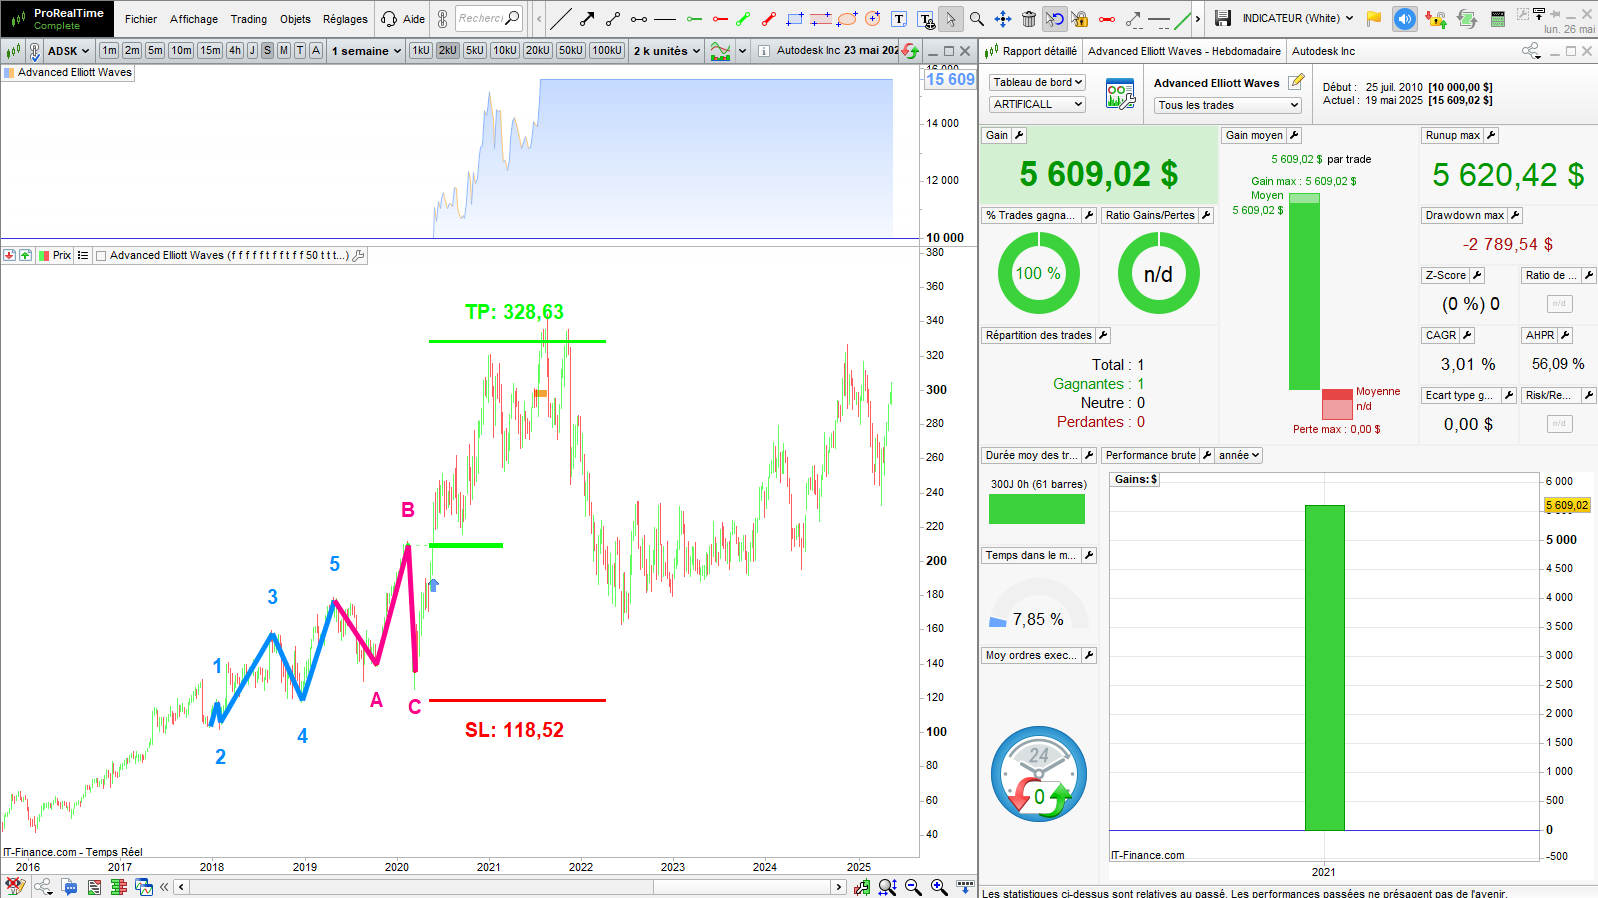
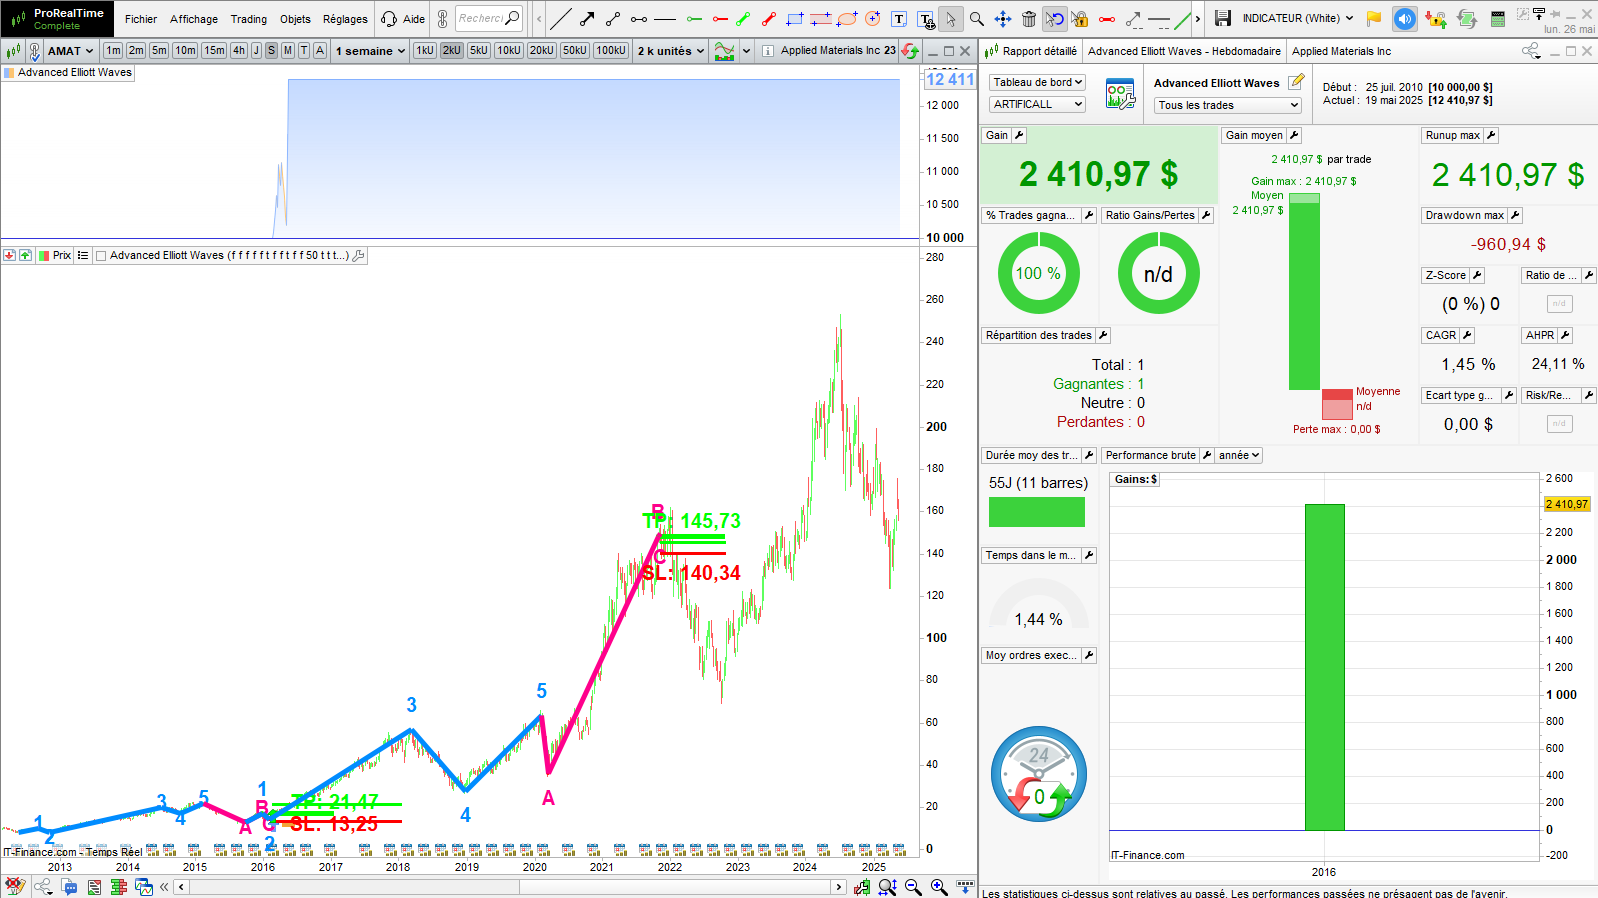
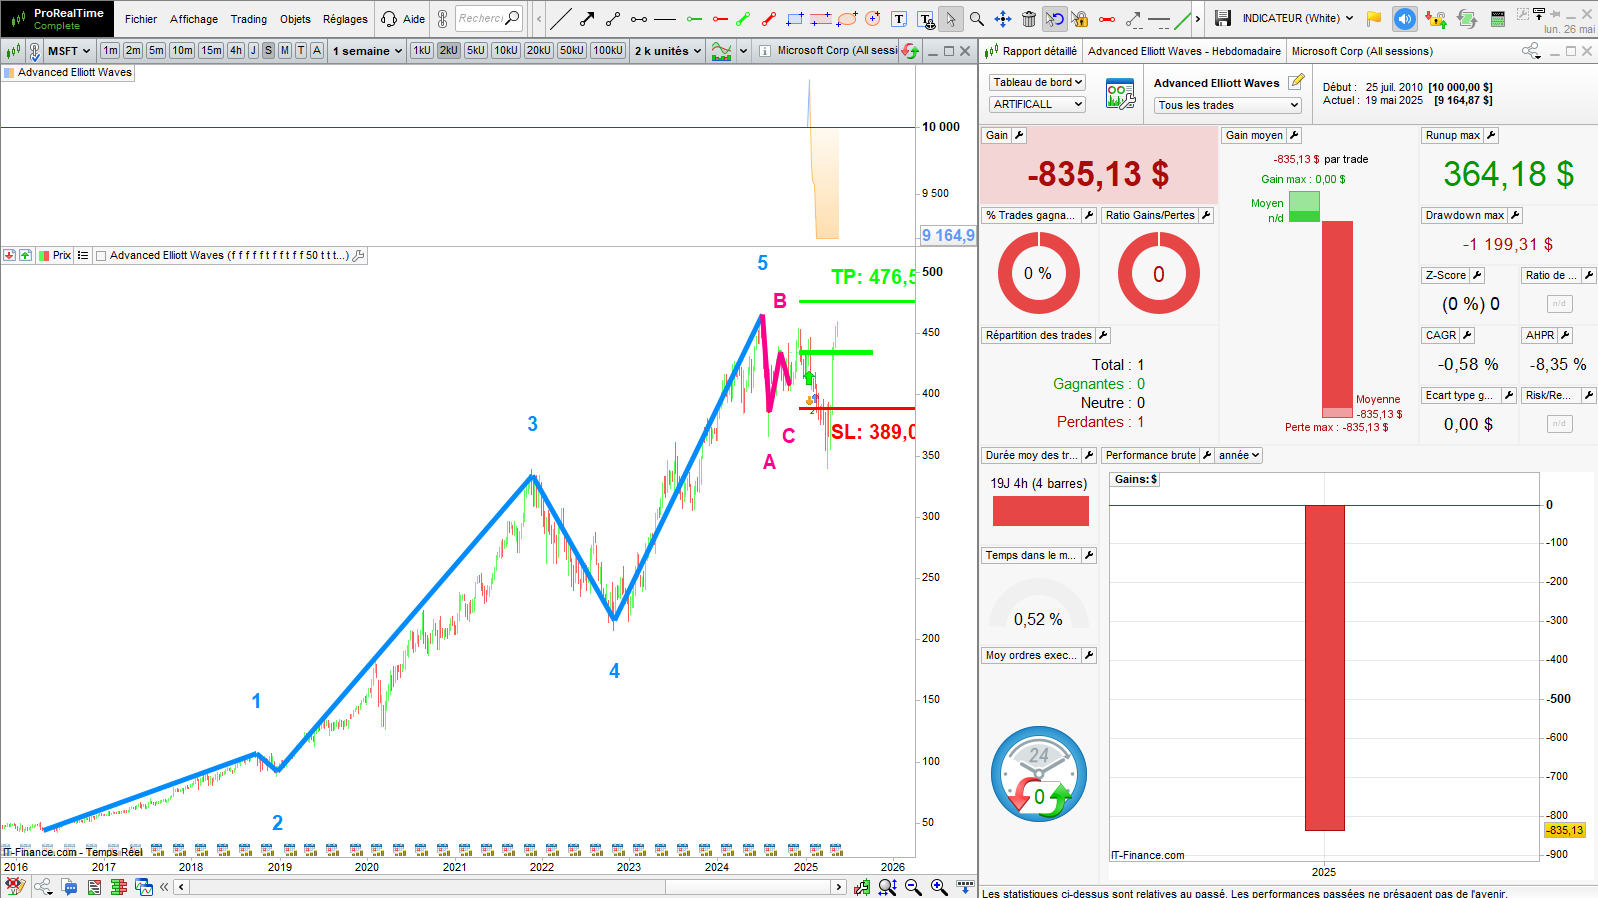
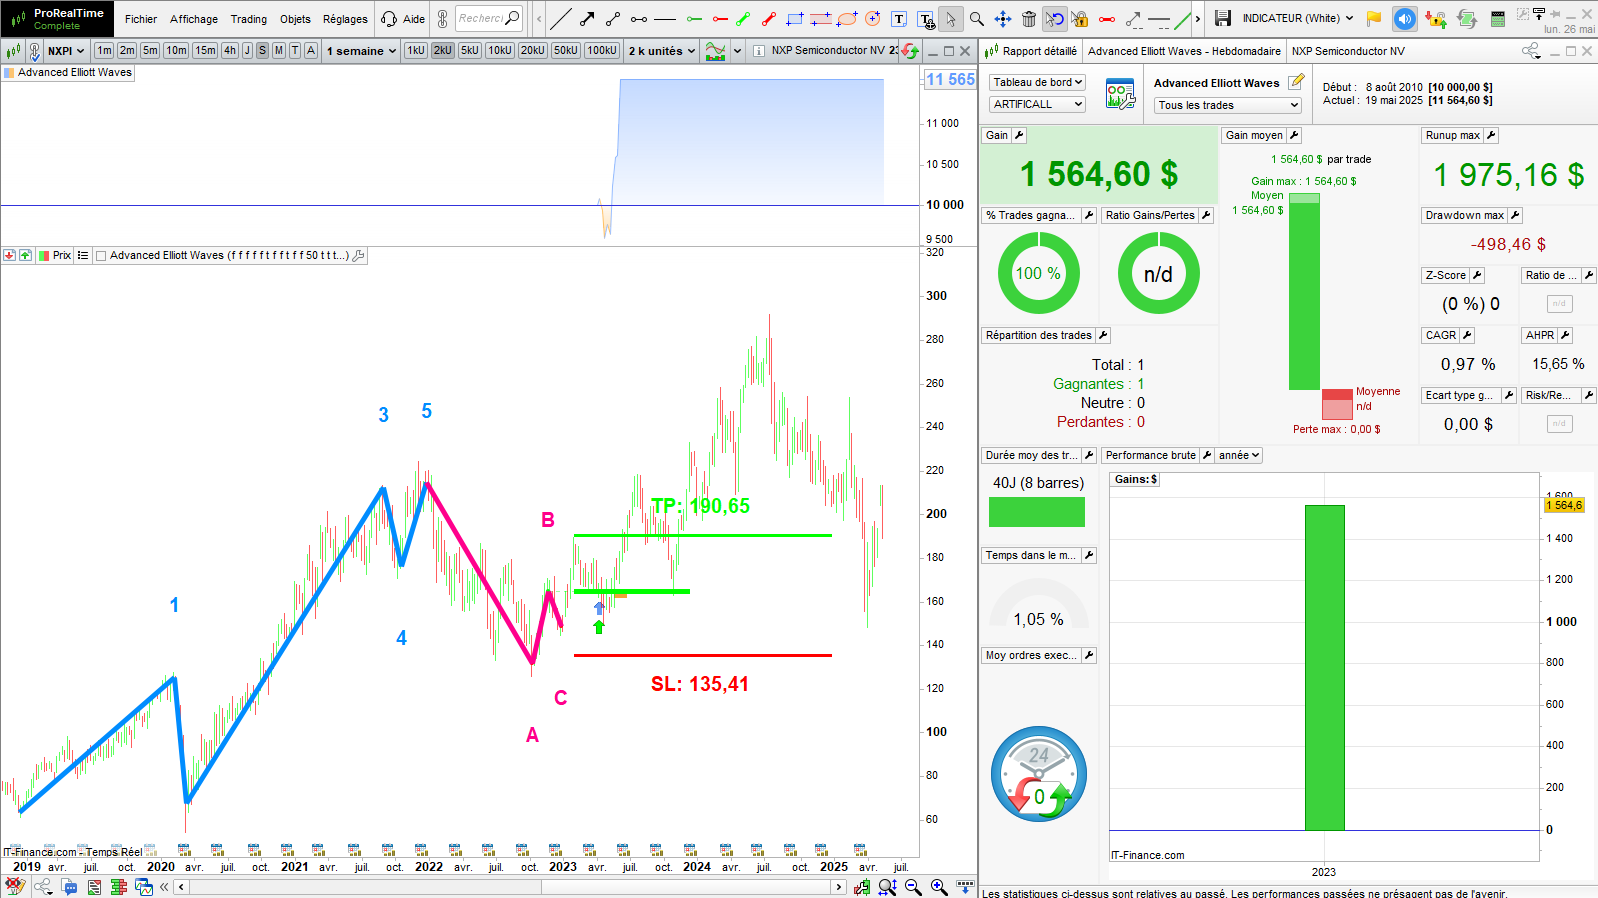
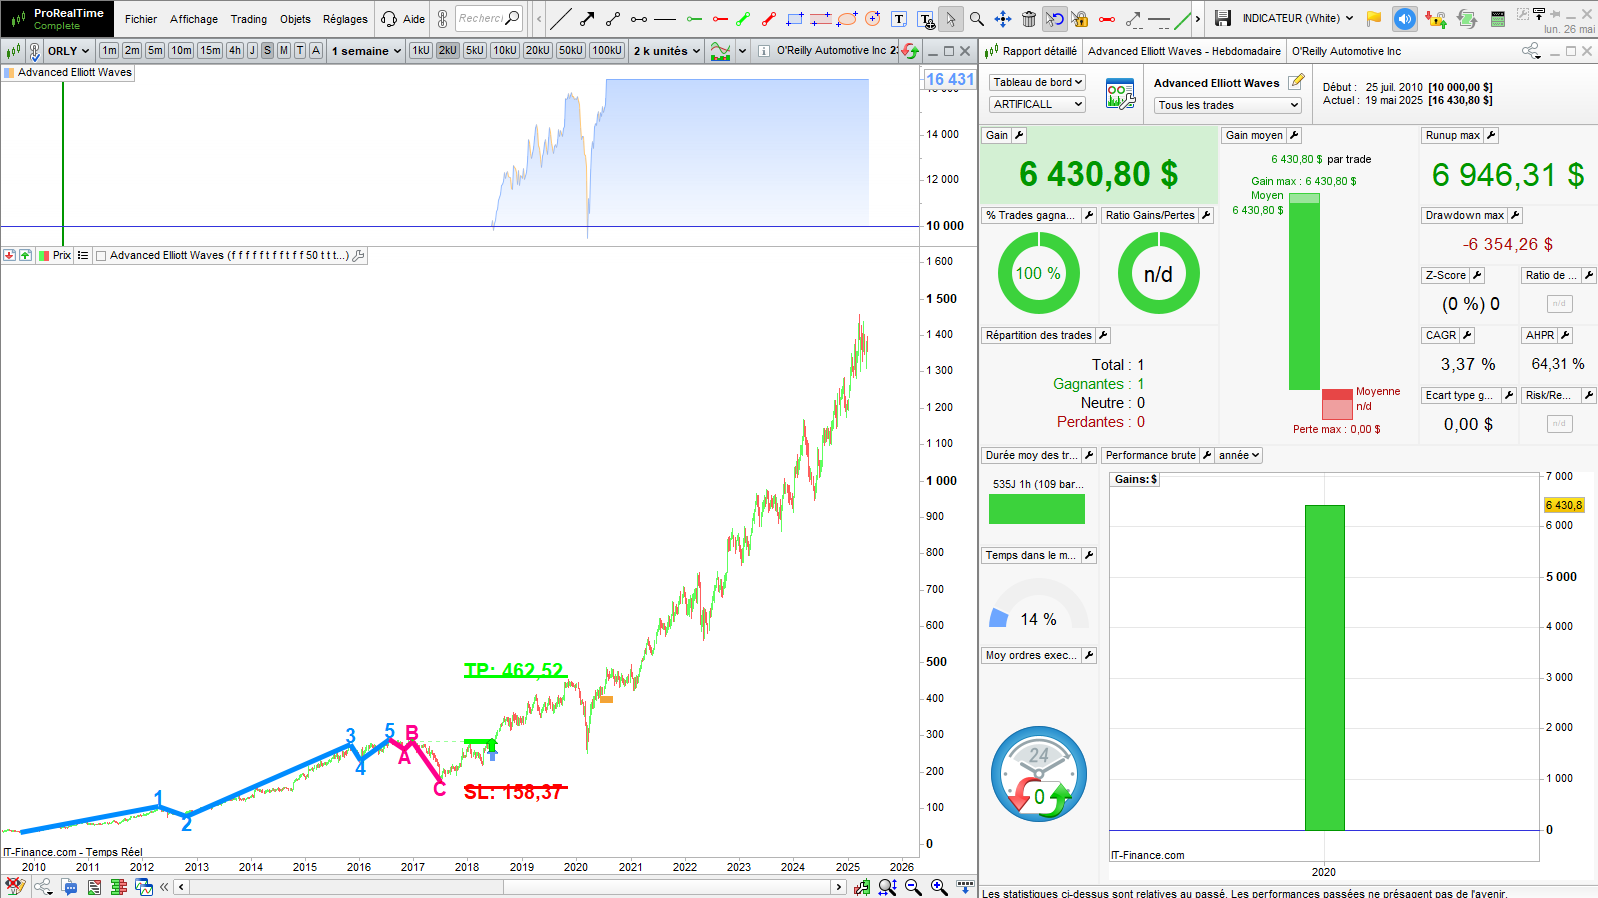
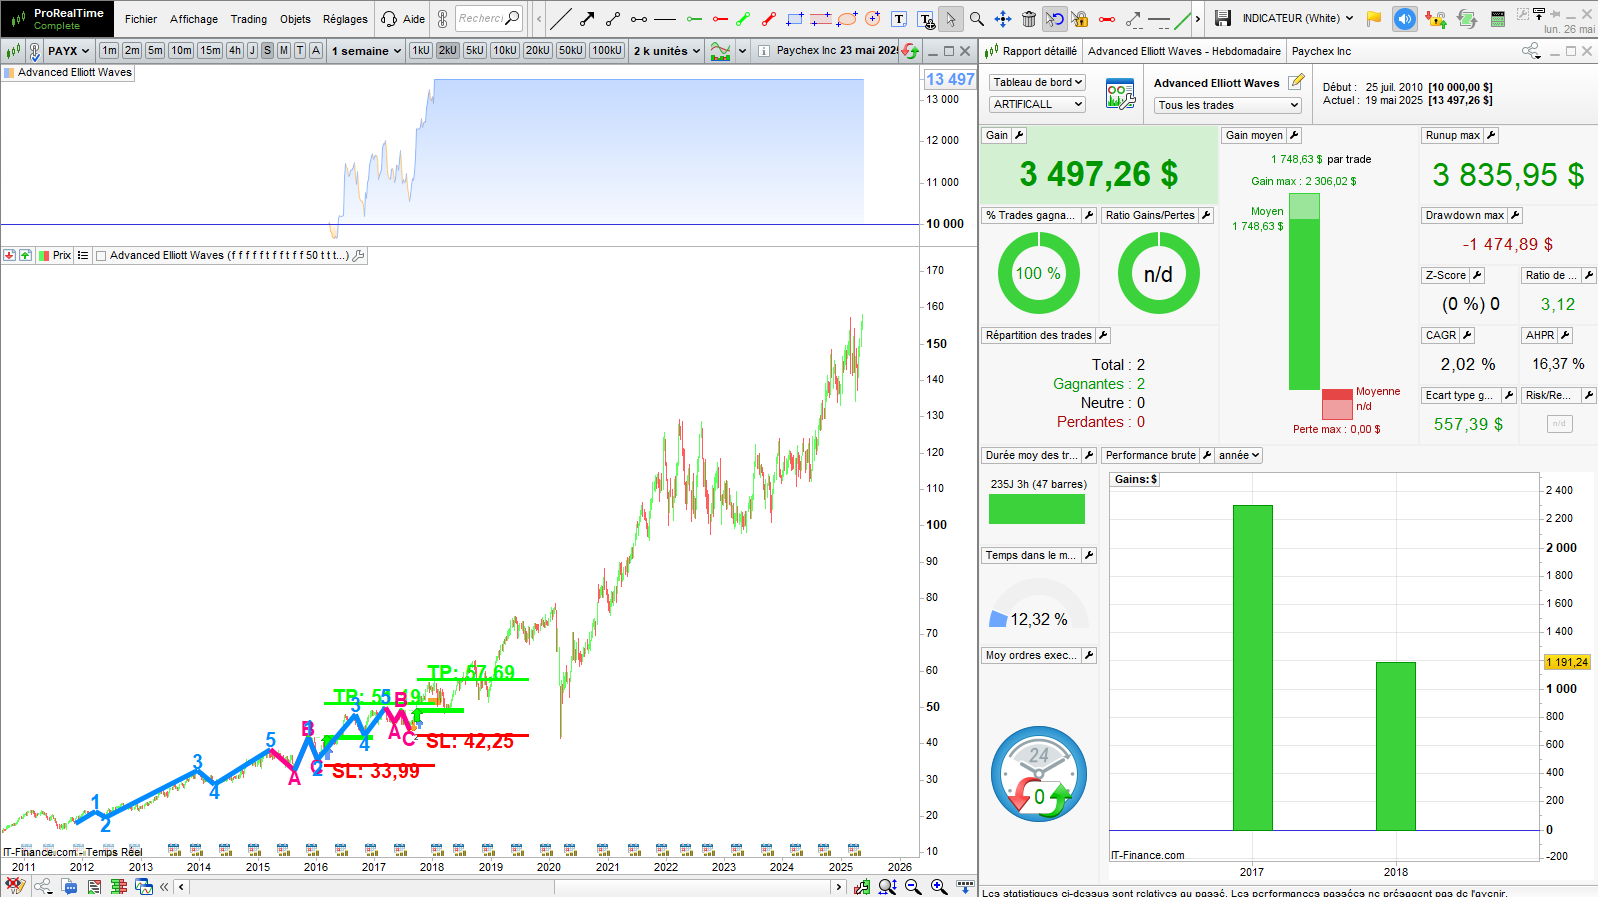
The following gallery shows the strategy run on all the Nasdaq 100 index stocks in the weekly timeframe:
ADBE
ADI
ADP
ADSK
AMAT
AMD
ASML
AZN
CDNS
CMCSA
CSGP
FTNT
GILD
GOOGL
HON
IDXX
INTU
ISRG
KLAC
MDLZ
MNST
MSFT
NXPI
ORLY
PAYX
PEP
REGN
SNPS
TMUS
TTWO
VRSK
You will backtest your strategies and create trader bots
Online Documentation
I provide complete documentation describing the usage and settings of the indicator. I also provide an example of code you can use to backtest your strategies and create an automated trading system. You can consult this documentation at any time on these pages:
The Bullish Harminics indicator is compatible with all versions of Prorealtime. You can install the indicator on any broker that provides this platform. The brokers with which you can use the indicator are Interactive Brokers, IG, Saxo Bank, and Boursorama:
Try the indicator for Free
Start a FREE TRIAL with the Advanced Elliott Wave indicator today. You will access the indicator’s complete functionalities for two weeks.
Get instant access to the Advanced Elliott Wave indicator and its real-time screener on your ProRealTime platform. Acquire your license today and start detecting market cycles with precision.
We use cookies on our website to give you the most relevant experience by remembering your preferences and repeat visits. By clicking “Accept”, you consent to the use of ALL the cookies.
This website uses cookies to improve your experience while you navigate through the website. Out of these, the cookies that are categorized as necessary are stored on your browser as they are essential for the working of basic functionalities of the website. We also use third-party cookies that help us analyze and understand how you use this website. These cookies will be stored in your browser only with your consent. You also have the option to opt-out of these cookies. But opting out of some of these cookies may affect your browsing experience.
Necessary cookies are absolutely essential for the website to function properly. These cookies ensure basic functionalities and security features of the website, anonymously.
Cookie
Duration
Description
cookielawinfo-checkbox-analytics
11 months
This cookie is set by GDPR Cookie Consent plugin. The cookie is used to store the user consent for the cookies in the category "Analytics".
cookielawinfo-checkbox-functional
11 months
The cookie is set by GDPR cookie consent to record the user consent for the cookies in the category "Functional".
cookielawinfo-checkbox-necessary
11 months
This cookie is set by GDPR Cookie Consent plugin. The cookies is used to store the user consent for the cookies in the category "Necessary".
cookielawinfo-checkbox-others
11 months
This cookie is set by GDPR Cookie Consent plugin. The cookie is used to store the user consent for the cookies in the category "Other.
cookielawinfo-checkbox-performance
11 months
This cookie is set by GDPR Cookie Consent plugin. The cookie is used to store the user consent for the cookies in the category "Performance".
viewed_cookie_policy
11 months
The cookie is set by the GDPR Cookie Consent plugin and is used to store whether or not user has consented to the use of cookies. It does not store any personal data.
Functional cookies help to perform certain functionalities like sharing the content of the website on social media platforms, collect feedbacks, and other third-party features.
Performance cookies are used to understand and analyze the key performance indexes of the website which helps in delivering a better user experience for the visitors.
Analytical cookies are used to understand how visitors interact with the website. These cookies help provide information on metrics the number of visitors, bounce rate, traffic source, etc.
Advertisement cookies are used to provide visitors with relevant ads and marketing campaigns. These cookies track visitors across websites and collect information to provide customized ads.