Home > Analyses > Technology > Zscaler, Inc.
Zscaler, Inc. is transforming how businesses secure their digital environments in an increasingly cloud-driven world. As a pioneer in cloud security, Zscaler delivers innovative solutions that protect users, devices, and applications from cyber threats with unmatched scale and reliability. Renowned for its cutting-edge platform and strong market presence, the company stands at the forefront of cybersecurity infrastructure. The key question for investors now is whether Zscaler’s robust fundamentals and growth trajectory continue to justify its premium valuation.
Table of contents
Business Model & Company Overview
Zscaler, Inc., founded in 2007 and headquartered in San Jose, California, stands as a leader in cloud security infrastructure. Its cohesive ecosystem integrates secure access solutions for users, servers, and IoT devices, enabling safe connectivity to SaaS and internal applications across diverse industries. This core mission addresses the growing demand for robust digital protection in an increasingly connected world.
The company’s revenue engine balances subscription-based software services with advanced security modules like workload segmentation and digital experience monitoring. Zscaler maintains a strategic footprint across the Americas, Europe, and Asia, supporting global enterprises with scalable, cloud-native security. Its competitive advantage lies in its comprehensive platform that safeguards application communication and ensures compliance, solidifying its role as a pivotal force shaping the future of cybersecurity.
Financial Performance & Fundamental Metrics
In this section, I analyze Zscaler, Inc.’s income statement, key financial ratios, and dividend payout policy to assess its fundamental strength.
Income Statement
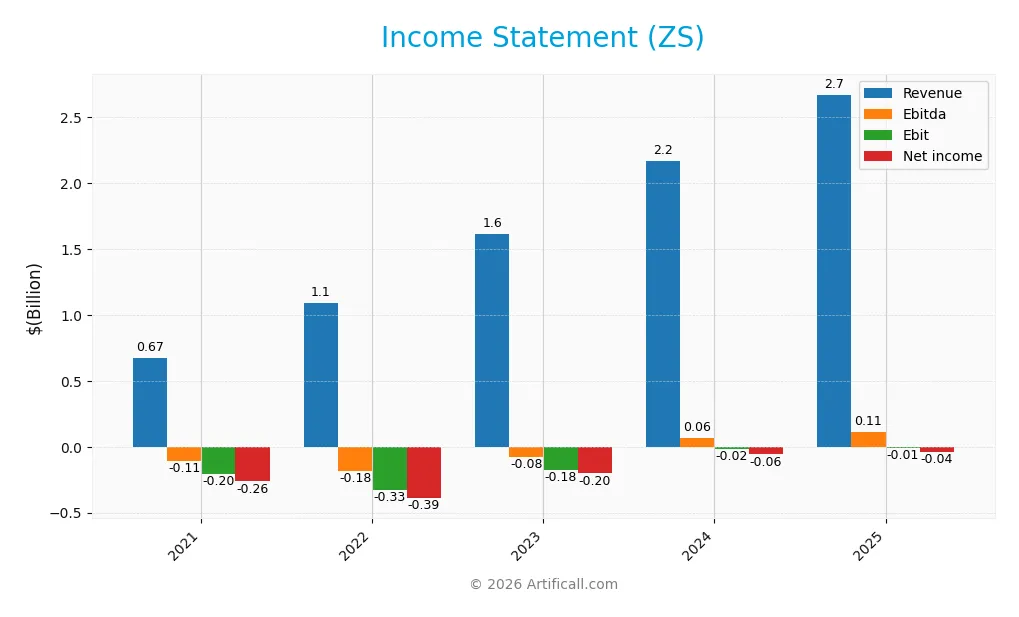
The table below presents Zscaler, Inc.’s key income statement figures for the fiscal years 2021 through 2025, reported in USD.
| 2021 | 2022 | 2023 | 2024 | 2025 | |
|---|---|---|---|---|---|
| Revenue | 673.1M | 1.09B | 1.62B | 2.17B | 2.67B |
| Cost of Revenue | 150.6M | 243.3M | 362.5M | 479.7M | 618.2M |
| Operating Expenses | 730.0M | 1.18B | 1.47B | 1.81B | 2.18B |
| Gross Profit | 522.5M | 847.6M | 1.25B | 1.69B | 2.05B |
| EBITDA | -106.0M | -183.4M | -76.7M | 64.8M | 112.4M |
| EBIT | -203.8M | -327.1M | -175.7M | -16.1M | -8.8M |
| Interest Expense | 53.4M | 56.6M | 6.8M | 13.1M | 9.5M |
| Net Income | -262.0M | -390.3M | -202.3M | -57.7M | -41.5M |
| EPS | -1.93 | -2.77 | -1.40 | -0.39 | -0.27 |
| Filing Date | 2021-09-16 | 2022-09-15 | 2023-09-14 | 2024-09-12 | 2025-09-11 |
Income Statement Evolution
From 2021 to 2025, Zscaler, Inc. showed strong revenue growth, increasing by nearly 3x to $2.67B in 2025. Gross profit also rose significantly, maintaining a favorable gross margin of 76.87%. However, despite improvements in operating expenses aligned with revenue growth, EBIT remained slightly negative, reflecting ongoing operational challenges. Net income losses narrowed, showing an improving but still unfavorable net margin of -1.55%.
Is the Income Statement Favorable?
In 2025, the fundamentals appear generally favorable with a 23.31% revenue increase year-over-year and a 21.73% rise in gross profit. Operating expenses scaled proportionally, and EBIT improved by 45.67%, though it remained negative at -0.33% of revenue. Interest expenses are low at 0.36% of revenue. Net margin and EPS showed notable growth, suggesting strengthened profitability trends despite a slight net loss of $41M.
Financial Ratios
The following table summarizes key financial ratios for Zscaler, Inc. over the fiscal years 2021 to 2025, providing a clear view of profitability, leverage, liquidity, valuation, and operational efficiency:
| Ratios | 2021 | 2022 | 2023 | 2024 | 2025 |
|---|---|---|---|---|---|
| Net Margin | -38.9% | -35.8% | -12.5% | -2.7% | -1.6% |
| ROE | -49.5% | -68.1% | -27.9% | -4.5% | -2.3% |
| ROIC | -13.3% | -19.0% | -10.2% | -4.4% | -3.2% |
| P/E | -122 | -55 | -115 | -465 | -1063 |
| P/B | 60.5 | 37.7 | 32.1 | 21.1 | 24.5 |
| Current Ratio | 2.57 | 1.99 | 1.88 | 1.09 | 2.01 |
| Quick Ratio | 2.57 | 1.99 | 1.88 | 1.09 | 2.01 |
| D/E | 1.82 | 1.82 | 1.67 | 0.97 | 1.00 |
| Debt-to-Assets | 43% | 37% | 34% | 26% | 28% |
| Interest Coverage | -3.9 | -5.8 | -31.6 | -9.5 | -13.5 |
| Asset Turnover | 0.30 | 0.39 | 0.45 | 0.46 | 0.42 |
| Fixed Asset Turnover | 4.40 | 4.68 | 5.17 | 4.58 | 4.22 |
| Dividend Yield | 0% | 0% | 0% | 0% | 0% |
Evolution of Financial Ratios
From 2021 to 2025, Zscaler, Inc. saw its Return on Equity (ROE) improve slightly but remained negative, ending at -2.31% in 2025. The Current Ratio showed some volatility, dropping near 1.09 in 2024 before rebounding to 2.01 in 2025, indicating improved short-term liquidity. The Debt-to-Equity Ratio declined from 1.82 in 2021 to about 1.0 in 2025, suggesting moderated leverage. Profitability margins remained negative but showed gradual improvement.
Are the Financial Ratios Favorable?
In 2025, Zscaler’s profitability ratios like net margin (-1.55%) and ROE (-2.31%) were unfavorable, reflecting ongoing losses. Liquidity ratios were favorable, with a Current Ratio and Quick Ratio both at 2.01, signaling strong short-term financial health. Leverage ratios were neutral to favorable: Debt-to-Equity was neutral at 1.0, and Debt-to-Assets was favorable at 27.98%. Efficiency measured by asset turnover was unfavorable at 0.42, while fixed asset turnover was favorable at 4.22. The overall ratio assessment was slightly unfavorable.
Shareholder Return Policy
Zscaler, Inc. (ZS) does not pay dividends, reflecting its negative net profit margins and ongoing reinvestment in growth initiatives. The company maintains no dividend payout, focusing instead on cash preservation and operational funding, with no share buybacks reported.
This approach aligns with a high-growth strategy prioritizing long-term value creation over immediate shareholder returns. The lack of distributions is consistent with its financial profile and supports sustainable reinvestment, though investors should monitor future profitability and cash flow developments.
Score analysis
The following radar chart illustrates the company’s financial scores across key valuation and performance metrics:
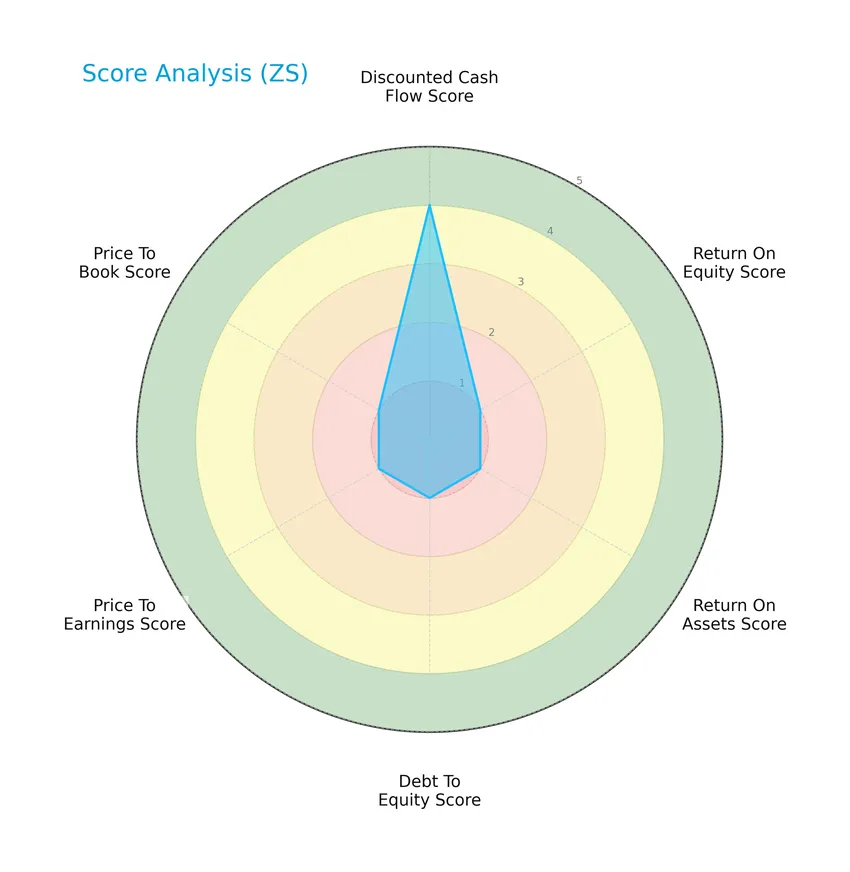
Zscaler, Inc. shows a mixed financial profile with a favorable discounted cash flow score of 4, while all other metrics including return on equity, return on assets, debt to equity, price to earnings, and price to book scores are very unfavorable at 1 each.
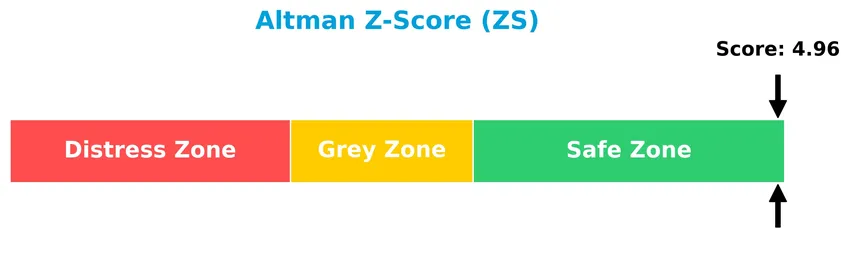
Analysis of the company’s bankruptcy risk
The Altman Z-Score positions the company comfortably within the safe zone, indicating a low probability of bankruptcy risk:
Is the company in good financial health?
Presented below is the Piotroski Score diagram reflecting the company’s financial health status:
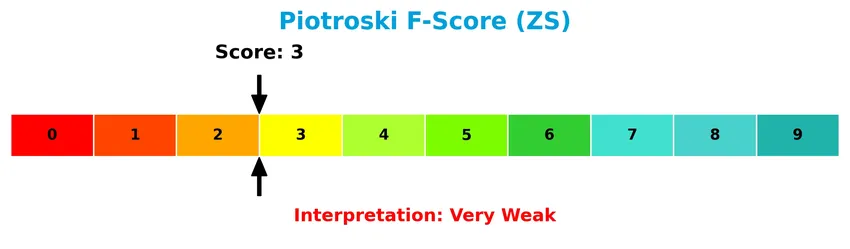
With a Piotroski Score of 3, Zscaler, Inc. is classified as very weak in financial health, suggesting limited strength in profitability, leverage, liquidity, and operational efficiency metrics.
Competitive Landscape & Sector Positioning
This sector analysis of Zscaler, Inc. will cover strategic positioning, revenue by segment, key products, main competitors, competitive advantages, and a SWOT analysis. I will assess whether Zscaler maintains a competitive advantage over its industry peers.
Strategic Positioning
Zscaler, Inc. focuses on cloud security solutions with a concentrated product portfolio centered on secure access and workload segmentation for SaaS, private clouds, and data centers. Its geographic revenue exposure includes the US, EMEA, Asia Pacific, and other regions, showing gradual international expansion alongside a strong US base.
Revenue by Segment
This pie chart illustrates Zscaler, Inc.’s revenue distribution across its reportable segments for the fiscal year 2025, highlighting the contribution of each segment to the total revenue.
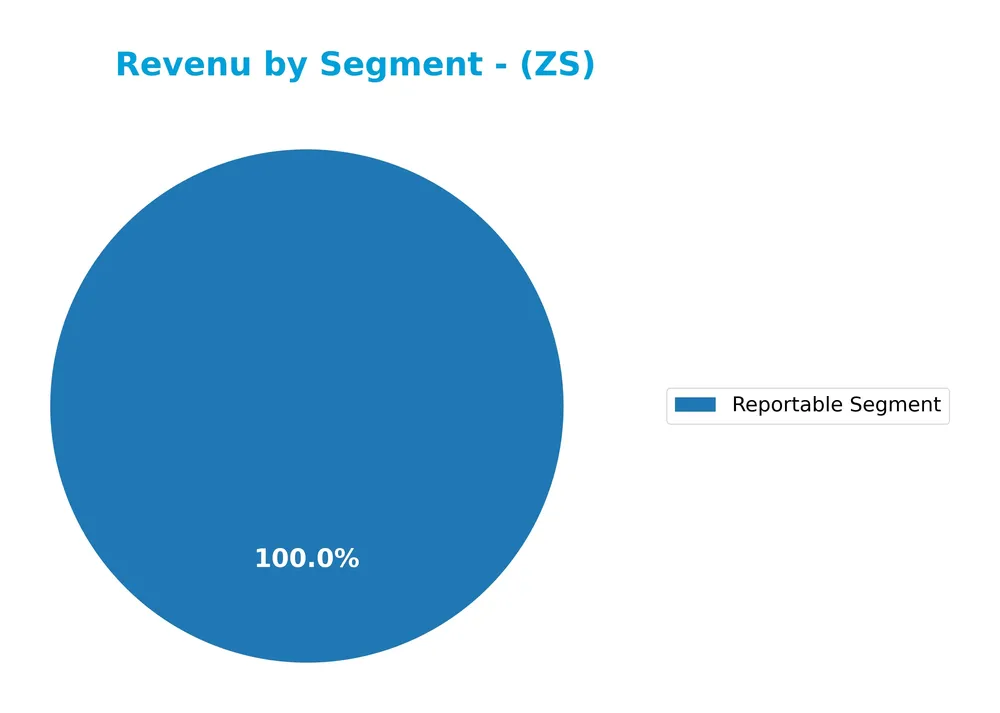
In fiscal year 2025, Zscaler’s total revenue from its reportable segment reached approximately 2.7B. The data indicates a focused revenue stream primarily driven by this single segment, suggesting a concentrated business model. There is no visible diversification in revenue sources, which may imply some concentration risk but also reflects Zscaler’s specialization within its market.
Key Products & Brands
The following table highlights Zscaler, Inc.’s key products and their core functionalities:
| Product | Description |
|---|---|
| Zscaler Internet Access | Provides secure access for users, servers, OT, and IoT devices to externally managed applications, SaaS, and internet. |
| Zscaler Private Access | Enables secure access to internally hosted applications in data centers and private or public clouds. |
| Zscaler Digital Experience | Measures end-to-end user experience across business applications, offering digital experience scores by user, app, location. |
| Workload Segmentation Solutions | Includes Cloud Security Posture Management to remediate misconfigurations and Cloud Workload Segmentation to secure app-to-app communications. |
| Platform Modules | Comprises Central Authority, Enforcement Node, and Log Servers supporting the overall security platform. |
Zscaler’s product suite focuses on cloud security, delivering comprehensive access and protection for diverse enterprise applications and workloads across multiple environments.
Main Competitors
There are 32 competitors in total, with the table below listing the top 10 leaders by market capitalization:
| Competitor | Market Cap. |
|---|---|
| Microsoft Corporation | 3.52T |
| Oracle Corporation | 553B |
| Palantir Technologies Inc. | 383B |
| Adobe Inc. | 140B |
| Palo Alto Networks, Inc. | 120B |
| CrowdStrike Holdings, Inc. | 113B |
| Synopsys, Inc. | 92B |
| Cloudflare, Inc. | 69B |
| Fortinet, Inc. | 59B |
| Block, Inc. | 40B |
Zscaler, Inc. ranks 12th among 32 competitors in the Software – Infrastructure sector. Its market cap is only 0.95% of the leader, Microsoft Corporation. Zscaler is positioned below the average market cap of the top 10 competitors (508B) but remains above the sector median (18.8B). The company is 6.74% smaller than its closest rival above in rank, indicating a moderate gap in scale.
Comparisons with competitors
Check out how we compare the company to its competitors:
Does ZS have a competitive advantage?
Zscaler, Inc. currently shows a slightly unfavorable competitive advantage, as it is shedding value with a ROIC significantly below its WACC despite a growing ROIC trend. The company’s profitability is improving, but it has yet to generate consistent economic profits above its cost of capital.
Looking ahead, Zscaler benefits from strong revenue growth and an expanding product suite, including cloud security, workload segmentation, and digital experience solutions. Its exposure across diverse industries and geographies suggests potential for market expansion and innovation-driven opportunities.
SWOT Analysis
This SWOT analysis highlights Zscaler, Inc.’s key internal and external factors to guide informed investment decisions.
Strengths
- Strong revenue growth (23.31% YoY)
- High gross margin (76.87%)
- Robust cloud security platform with diverse solutions
Weaknesses
- Negative net margin (-1.55%)
- Unfavorable ROE (-2.31%) and ROIC (-3.18%)
- High price-to-book ratio (24.51) indicating possible overvaluation
Opportunities
- Growing global demand for cloud security
- Expansion into emerging markets and new industries
- Increasing adoption of SaaS and zero trust security models
Threats
- Intense competition in cybersecurity sector
- Rapid technological change requiring continuous innovation
- Potential regulatory and compliance challenges
Zscaler demonstrates strong growth and market positioning but faces profitability challenges and valuation risks. Its strategy should focus on improving operational efficiency and capitalizing on expanding cloud security demand while carefully managing competitive and regulatory threats.
Stock Price Action Analysis
The weekly stock chart for Zscaler, Inc. over the past 12 months highlights significant price fluctuations and a clear directional trend:
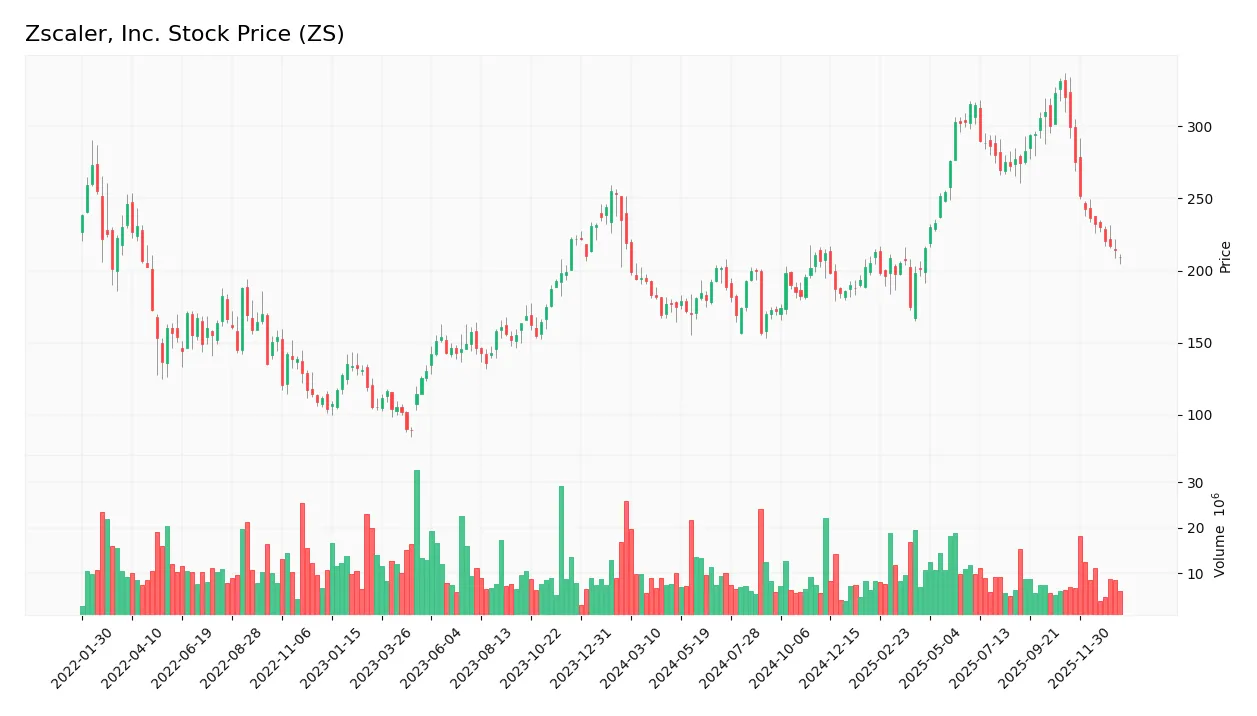
Trend Analysis
Over the past 12 months, Zscaler’s stock price declined by 4.38%, indicating a bearish trend. The price moved between a high of 331.14 and a low of 156.78 with a deceleration in the downward movement. Volatility remains elevated, as reflected by a standard deviation of 47.11.
Volume Analysis
In the last three months, trading volume has decreased with sellers dominating activity, as buyer volume dropped to zero while seller volume reached 101.7M. This seller-driven volume suggests weakening investor confidence and reduced market participation in this period.
Target Prices
The consensus target prices for Zscaler, Inc. indicate a positive outlook among analysts.
| Target High | Target Low | Consensus |
|---|---|---|
| 360 | 260 | 311.41 |
Analysts expect Zscaler’s stock price to trade between $260 and $360, with an average consensus target around $311, reflecting moderate optimism.

Don’t Let Luck Decide Your Entry Point
Optimize your entry points with our advanced ProRealTime indicators. You’ll get efficient buy signals with precise price targets for maximum performance. Start outperforming now!
Analyst & Consumer Opinions
This section examines recent analyst ratings and consumer feedback regarding Zscaler, Inc. (ZS) to provide a balanced overview.
Stock Grades
Here are the most recent verified analyst grades for Zscaler, Inc. from well-known financial institutions:
| Grading Company | Action | New Grade | Date |
|---|---|---|---|
| Citigroup | Maintain | Buy | 2026-01-13 |
| Keybanc | Maintain | Overweight | 2026-01-12 |
| Piper Sandler | Maintain | Neutral | 2026-01-05 |
| RBC Capital | Maintain | Outperform | 2026-01-05 |
| Mizuho | Upgrade | Outperform | 2025-12-16 |
| Bernstein | Downgrade | Market Perform | 2025-12-01 |
| Citigroup | Maintain | Buy | 2025-12-01 |
| B of A Securities | Maintain | Buy | 2025-11-26 |
| Needham | Maintain | Buy | 2025-11-26 |
| BTIG | Maintain | Buy | 2025-11-26 |
The overall trend shows a predominant Buy consensus with some upgrades to Outperform and a single downgrade to Market Perform, reflecting cautious optimism among analysts about Zscaler’s near-term prospects.
Consumer Opinions
Consumers have voiced diverse opinions about Zscaler, Inc., reflecting a mix of satisfaction and areas for improvement.
| Positive Reviews | Negative Reviews |
|---|---|
| “Zscaler’s cloud security solutions have significantly improved our network safety with minimal downtime.” | “The pricing structure feels a bit steep for small businesses.” |
| “Excellent customer support that resolves issues promptly and efficiently.” | “Initial setup can be complex without expert guidance.” |
| “Seamless integration with existing IT infrastructure made deployment smooth.” | “Some features lack customization options for advanced users.” |
Overall, consumers appreciate Zscaler’s robust security and strong customer service but often highlight pricing and setup complexity as areas needing attention.
Risk Analysis
Below is a table summarizing the key risks associated with investing in Zscaler, Inc. based on recent financial and market data:
| Category | Description | Probability | Impact |
|---|---|---|---|
| Profitability Risk | Negative net margin (-1.55%) and unfavorable ROE (-2.31%) indicate ongoing losses and weak profits. | High | High |
| Valuation Risk | Extremely high price-to-book ratio (24.51) signals possible overvaluation and price volatility. | Medium | High |
| Liquidity Risk | Favorable current and quick ratios (~2.01) suggest manageable short-term liquidity risk. | Low | Medium |
| Leverage Risk | Debt-to-equity ratio of 1.0 with moderate debt-to-assets (28%) and poor interest coverage (-0.92) | Medium | Medium |
| Market Volatility | Beta near 1.02 implies stock price moves closely with the market, exposing it to general volatility. | Medium | Medium |
The most concerning risks are the persistent unprofitability and valuation concerns, which may lead to stock price pressure despite the company’s strong market position in cloud security. The Altman Z-Score of 4.96 places Zscaler in the safe zone for bankruptcy risk, but the very weak Piotroski score of 3 highlights financial weakness that investors should carefully monitor.
Should You Buy Zscaler, Inc.?
Zscaler, Inc. appears to be in a complex financial position with improving operational efficiency but persistent value destruction indicated by its negative ROIC relative to WACC. Despite a manageable leverage profile reflected in a safe Altman Z-score, the company’s profitability and overall rating remain very weak, suggesting cautious analytical interpretation.
Strength & Efficiency Pillars
Zscaler, Inc. exhibits a mixed financial profile with strong indicators in financial health and growth. The Altman Z-Score of 4.96 places the company firmly in the safe zone, suggesting low bankruptcy risk. Gross margins are robust at 76.87%, reflecting efficient core operations. Despite a negative ROIC of -3.18%, the company shows a growing ROIC trend of 76.14%, indicating improving profitability. The current and quick ratios at 2.01 demonstrate solid liquidity, supporting financial stability. However, low Piotroski score of 3 signals weak operational strength.
Weaknesses and Drawbacks
The valuation and profitability metrics raise significant concerns. The price-to-book ratio stands at an elevated 24.51, pointing to a potentially overvalued stock relative to net assets. Negative net margin (-1.55%) and ROE (-2.31%) reflect ongoing profitability challenges. Debt-to-equity is moderate at 1.0 but interest coverage is unfavorable at -0.92, implying difficulty servicing debt. The stock’s recent bearish trend with a price decline of -34.5% and a seller dominance of 100% further stresses near-term market pressure, compounding risk for investors.
Our Verdict about Zscaler, Inc.
Zscaler’s long-term fundamental profile appears unfavorable due to persistent profitability issues and valuation concerns. Despite some improving profitability trends, the recent market environment is clearly seller dominant, signaling caution. Despite long-term strength in financial health, recent market pressure suggests a wait-and-see approach for a better entry point. The stock may appear attractive for investors with a high risk tolerance focused on potential turnaround.
Disclaimer: This content is for informational purposes only and does not constitute financial, investment, or other professional advice. Investing in financial markets involves a significant risk of loss, and past performance is not indicative of future results.
Additional Resources
- Citizens Remains a Buy on Zscaler, Inc (ZS) – Yahoo Finance (Jan 23, 2026)
- Citizens Remains a Buy on Zscaler, Inc (ZS) – Insider Monkey (Jan 23, 2026)
- Will Zscaler’s (ZS) Agentic AI Security Push Redefine Its Zero Trust Leadership Narrative? – simplywall.st (Jan 23, 2026)
- Zscaler: Growth Pillars Are Accelerating Despite KPI Noise (NASDAQ:ZS) – Seeking Alpha (Jan 07, 2026)
- This Zscaler “Buy the Dip” Signal is Rarely Wrong – Schaeffer’s Investment Research (Dec 02, 2025)
For more information about Zscaler, Inc., please visit the official website: zscaler.com