Home > Analyses > Technology > Zebra Technologies Corporation
Zebra Technologies transforms how businesses track and manage assets across the globe, embedding intelligence into everyday operations. Its cutting-edge printers, scanners, and RFID solutions set industry standards for precision and reliability. Known for innovation and robust enterprise visibility, Zebra powers sectors from retail to healthcare with real-time data and automation. As market dynamics shift, I question whether Zebra’s strong fundamentals continue to justify its premium valuation and growth trajectory.
Table of contents
Business Model & Company Overview
Zebra Technologies Corporation, founded in 1969 and headquartered in Lincolnshire, Illinois, leads the communication equipment sector with a comprehensive ecosystem of enterprise asset intelligence solutions. It integrates hardware and software across asset tracking, visibility, and mobility to serve industries like retail, logistics, and healthcare. This cohesive approach fuels operational efficiency and real-time data capture worldwide.
The company’s revenue engine balances durable hardware—printers, scanners, RFID devices—and recurring software subscriptions, including cloud services and analytics. Zebra’s global footprint spans the Americas, Europe, and Asia, bolstered by direct sales and channel partners. Its deep integration of physical and digital solutions creates a formidable economic moat, shaping the future of automated identification and data capture.
Financial Performance & Fundamental Metrics
I analyze Zebra Technologies Corporation’s income statement, key financial ratios, and dividend payout policy to assess its profitability, efficiency, and shareholder returns.
Income Statement
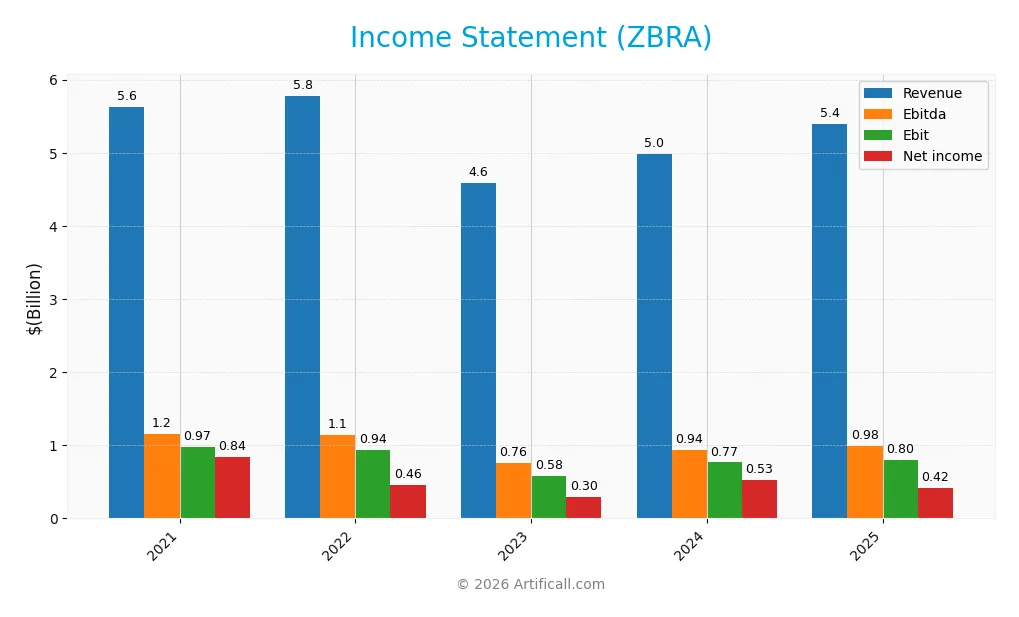
The table below summarizes Zebra Technologies Corporation’s key income statement figures for fiscal years 2021 through 2025, providing a clear snapshot of its financial performance.
| 2021 | 2022 | 2023 | 2024 | 2025 | |
|---|---|---|---|---|---|
| Revenue | 5.63B | 5.78B | 4.58B | 4.98B | 5.40B |
| Cost of Revenue | 3.00B | 3.16B | 2.46B | 2.57B | 2.92B |
| Operating Expenses | 1.65B | 2.10B | 1.64B | 1.67B | 1.68B |
| Gross Profit | 2.63B | 2.62B | 2.12B | 2.41B | 2.48B |
| EBITDA | 1.16B | 1.14B | 761M | 937M | 985M |
| EBIT | 973M | 936M | 585M | 765M | 800M |
| Interest Expense | 5M | 60M | 133M | 129M | 108M |
| Net Income | 837M | 463M | 296M | 528M | 419M |
| EPS | 15.66 | 8.87 | 5.76 | 10.25 | 8.24 |
| Filing Date | 2022-02-10 | 2023-02-16 | 2024-02-15 | 2025-02-13 | 2026-02-12 |
Income Statement Evolution
Zebra Technologies’ revenue showed an 8.3% increase from 2024 to 2025 but declined 4.1% over five years. Gross margin remained stable near 46%, while EBIT margin modestly improved to 14.8%. Net income and net margin, however, contracted sharply, falling nearly 50% across the period, signaling margin pressure despite revenue growth in the latest year.
Is the Income Statement Favorable?
In 2025, Zebra reported $5.4B revenue and $419M net income, yielding a 7.8% net margin. Operating expenses grew in line with revenue, supporting a stable gross margin. Interest expense stayed low at 2% of revenue. Despite solid top-line growth, a 26.7% drop in net margin and EPS decline reflect cost or efficiency challenges, making fundamentals neutral overall.
Financial Ratios
The following table presents key financial ratios for Zebra Technologies Corporation (ZBRA) across fiscal years 2021 to 2025, illustrating profitability, liquidity, leverage, and valuation metrics:
| Ratios | 2021 | 2022 | 2023 | 2024 | 2025 |
|---|---|---|---|---|---|
| Net Margin | 15% | 8.0% | 6.5% | 11% | 7.8% |
| ROE | 28.0% | 17.0% | 9.7% | 15% | 12% |
| ROIC | 19% | 8.3% | 7.2% | 9.7% | 8.8% |
| P/E | 38.0 | 29.0 | 47.4 | 38.0 | 29.5 |
| P/B | 10.7 | 4.9 | 4.6 | 5.5 | 3.4 |
| Current Ratio | 0.94 | 0.81 | 1.05 | 1.43 | 0.97 |
| Quick Ratio | 0.67 | 0.44 | 0.54 | 1.03 | 0.58 |
| D/E | 0.38 | 0.86 | 0.80 | 0.66 | 0.78 |
| Debt-to-Assets | 18% | 31% | 33% | 30% | 33% |
| Interest Coverage | 196x | 8.8x | 3.6x | 5.8x | 7.4x |
| Asset Turnover | 0.91 | 0.77 | 0.63 | 0.63 | 0.63 |
| Fixed Asset Turnover | 14.0 | 13.3 | 9.6 | 10.6 | 10.4 |
| Dividend Yield | 0% | 0% | 0% | 0% | 0% |
All figures are rounded for clarity.
Evolution of Financial Ratios
Zebra Technologies’ Return on Equity (ROE) declined from a high of 28.05% in 2021 to 11.68% in 2025, indicating slowing profitability. The Current Ratio fell below 1.0 in 2025, signaling weakening liquidity. Debt-to-Equity ratio remained relatively stable around 0.7–0.8, reflecting consistent leverage use over the period.
Are the Financial Ratios Fovorable?
In 2025, profitability ratios like net margin (7.77%) and ROE (11.68%) are neutral but show pressure against a WACC of 10.15%, which is unfavorable. Liquidity ratios, including Current (0.97) and Quick (0.58), are below optimal thresholds, marking liquidity concerns. Favorable metrics include interest coverage (7.41) and fixed asset turnover (10.4). Overall, the ratio profile is slightly unfavorable, with 43% unfavorable versus 14% favorable.
Shareholder Return Policy
Zebra Technologies Corporation does not pay dividends nor report a dividend payout ratio. The company appears to prioritize reinvestment and operational cash flow allocation, supported by consistent free cash flow generation and no dividend distribution.
While Zebra does not engage in share buybacks, its approach suggests focus on long-term value creation through growth and capital expenditure. This policy aligns with sustaining shareholder value without immediate cash returns, reflecting a cautious capital allocation stance.
Score analysis
The following radar chart displays Zebra Technologies Corporation’s key financial scores across valuation, profitability, and leverage metrics:
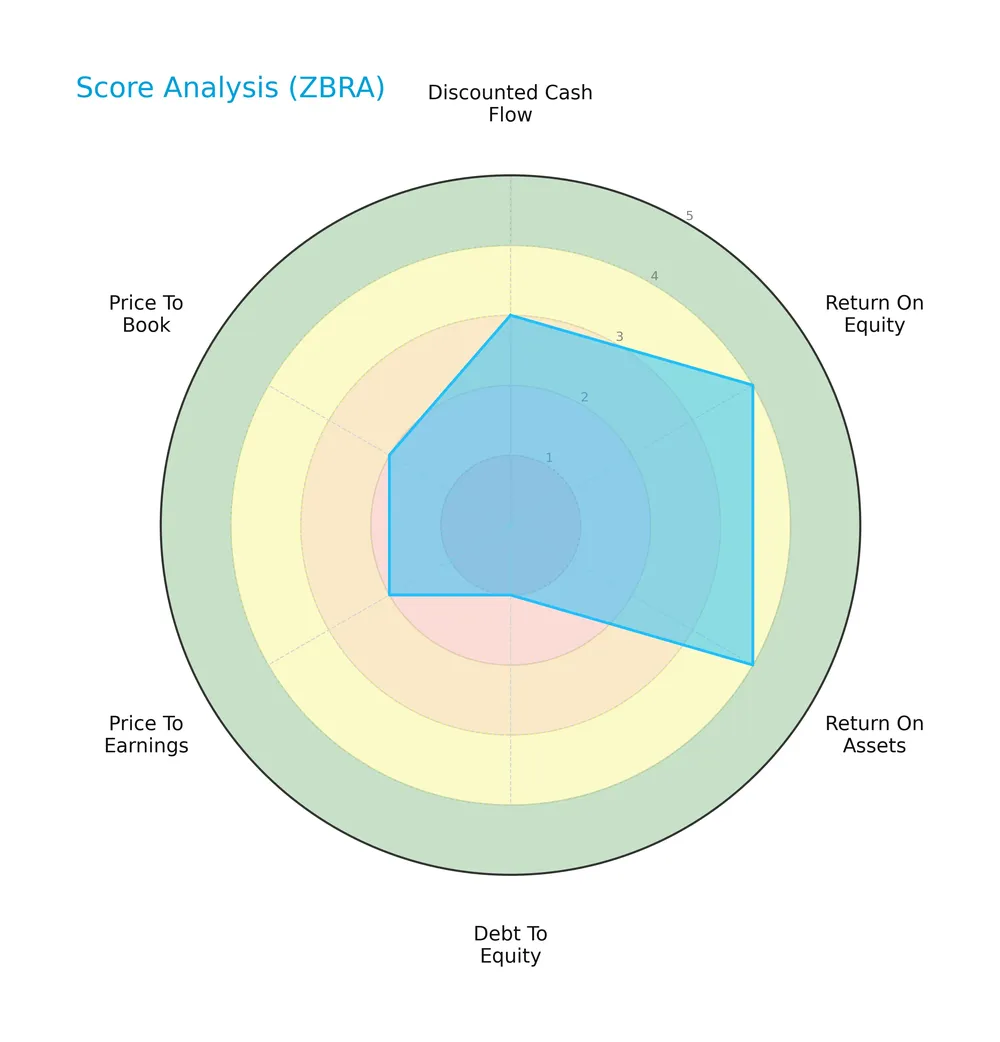
The company shows favorable returns with strong ROE and ROA scores of 4 each. However, leverage concerns arise from a very unfavorable debt-to-equity score of 1. Valuation metrics (PE and PB) remain on the weaker side, both scoring 2. The discounted cash flow score is moderate at 3.
Analysis of the company’s bankruptcy risk
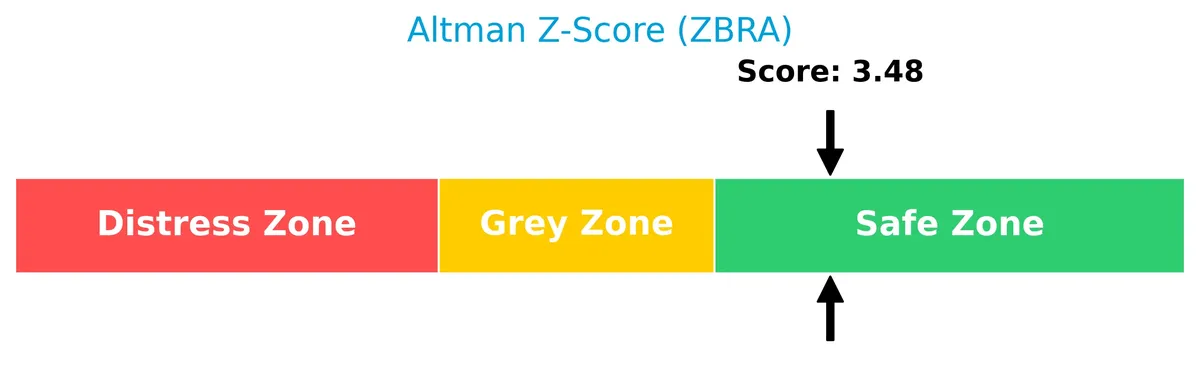
Zebra Technologies sits comfortably in the safe zone with an Altman Z-Score above 3, indicating low bankruptcy risk and solid financial stability:
Is the company in good financial health?
This Piotroski diagram illustrates the company’s financial strength based on multiple fundamental criteria:
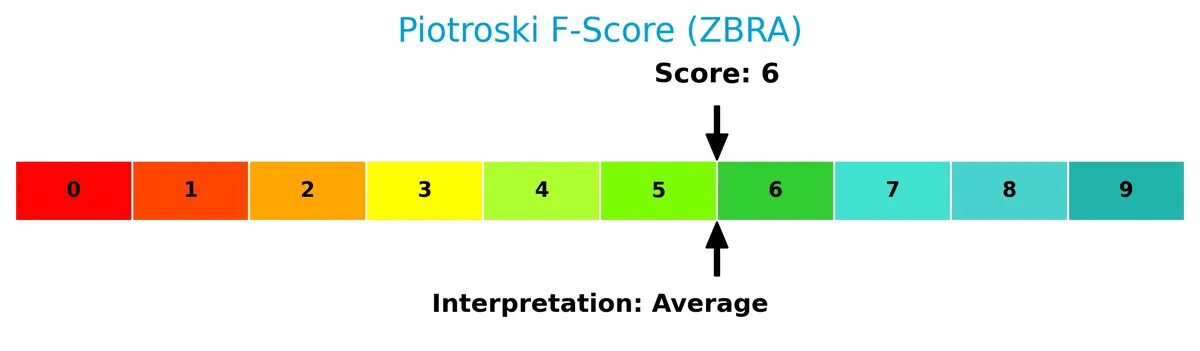
With a Piotroski Score of 6, Zebra demonstrates average financial health. The score reflects moderate strength, signaling room for improvement in profitability and efficiency metrics.
Competitive Landscape & Sector Positioning
This analysis examines Zebra Technologies Corporation’s strategic position within the communication equipment sector. It outlines revenue by segment, key products, and main competitors. I will assess whether Zebra holds a competitive advantage over its peers.
Strategic Positioning
Zebra Technologies operates a diversified product portfolio across two main segments: Asset Intelligence & Tracking and Enterprise Visibility & Mobility. Geographically, it maintains broad exposure, with significant revenue from North America, EMEA, Asia Pacific, and Latin America, reflecting a global market presence.
Revenue by Segment
This pie chart illustrates Zebra Technologies Corporation’s revenue distribution by product segment for fiscal year 2024. It highlights the relative contribution of each business unit to total revenue.
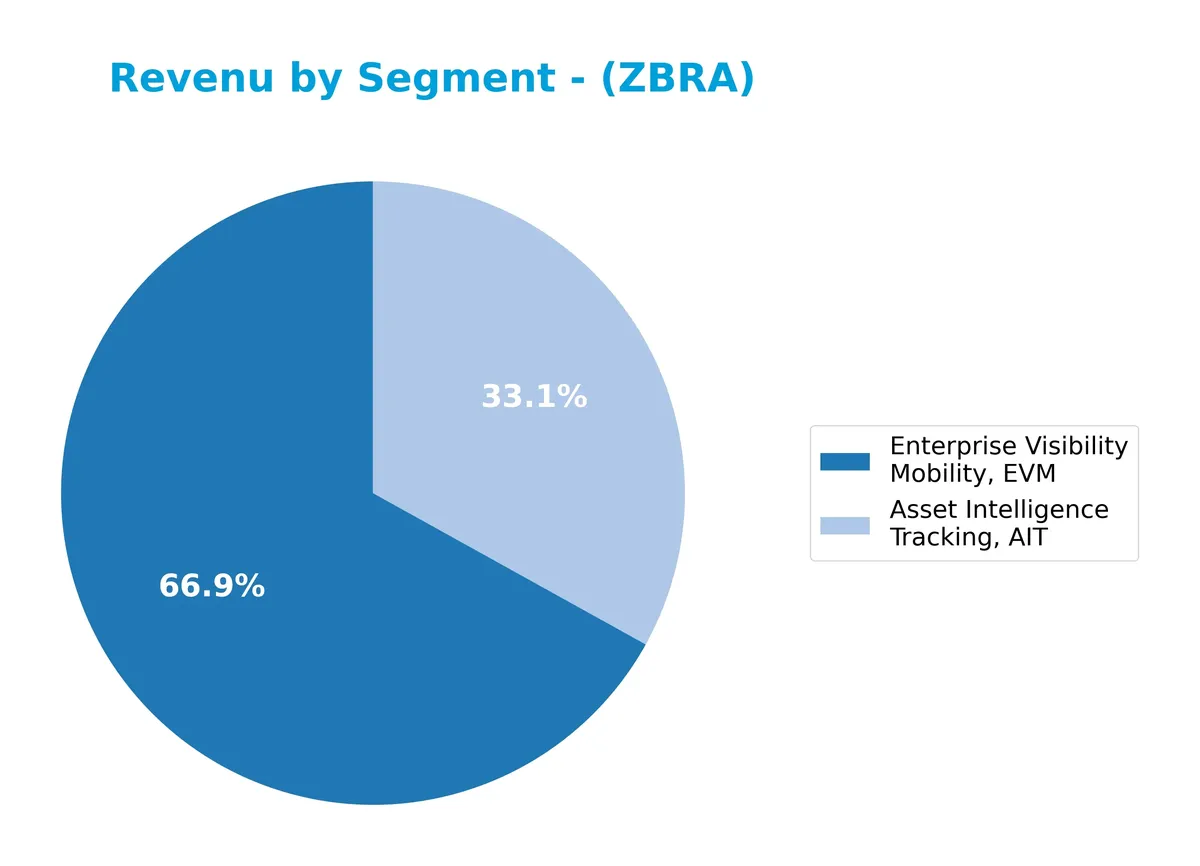
In 2024, Enterprise Visibility Mobility (EVM) dominates with $3.33B, driving the bulk of Zebra’s revenue. Asset Intelligence Tracking (AIT) follows with $1.65B, showing stability but slower growth. The shift toward EVM reflects a strategic focus on mobility solutions. This concentration signals potential risk but also underscores where Zebra invests its innovation and capital allocation to sustain competitive advantage.
Key Products & Brands
Zebra Technologies offers a diverse range of products and solutions across two main business segments:
| Product | Description |
|---|---|
| Asset Intelligence & Tracking (AIT) | Solutions including printers, RFID devices, and temperature-monitoring labels for asset tracking. |
| Enterprise Visibility & Mobility (EVM) | Workforce management, mobile computing products, barcode scanners, RFID readers, and software solutions. |
Zebra’s product portfolio spans hardware and software aimed at enhancing asset visibility and workforce productivity. The two segments generate substantial revenue, reflecting Zebra’s focus on integrated enterprise intelligence solutions.
Main Competitors
There are 7 competitors in the Communication Equipment industry; below is a table of the top 7 leaders by market capitalization:
| Competitor | Market Cap. |
|---|---|
| Cisco Systems, Inc. | 300B |
| Motorola Solutions, Inc. | 63B |
| Nokia Oyj | 35B |
| Hewlett Packard Enterprise Company | 32B |
| Credo Technology Group Holding Ltd | 25B |
| Zebra Technologies Corporation | 13B |
| AudioCodes Ltd. | 255M |
Zebra Technologies ranks 6th among 7 competitors, with a market cap just 4.46% of the leader, Cisco Systems. The company sits below both the top 10 average of 67B and the sector median of 32B. Zebra is 84% smaller than its nearest competitor, Credo Technology, highlighting a significant gap in scale.
Comparisons with competitors
Check out how we compare the company to its competitors:
Does ZBRA have a competitive advantage?
Zebra Technologies Corporation currently does not present a competitive advantage. Its ROIC is below WACC by 1.34%, with a declining trend indicating value destruction and decreasing profitability.
Looking ahead, Zebra’s diverse product range in asset intelligence, real-time location systems, and workforce management offers growth opportunities. Expansion in international markets and innovation in cloud-based software and robotics could support future competitiveness.
SWOT Analysis
This analysis highlights Zebra Technologies’ core internal strengths and weaknesses, alongside external opportunities and threats shaping its strategic outlook.
Strengths
- strong market position in asset intelligence
- diverse product portfolio spanning printers, RFID, and software
- robust presence in North America and EMEA
Weaknesses
- declining ROIC below WACC signals value destruction
- unfavorable liquidity ratios (current and quick ratios below 1)
- high valuation multiples (PE 29.45, PB 3.44)
Opportunities
- expanding demand for enterprise visibility and mobility solutions
- growth potential in Asia Pacific and emerging markets
- increasing adoption of automation and robotics in operations
Threats
- intensifying competition in communication equipment sector
- margin pressure from rising operating expenses
- macroeconomic uncertainties impacting client budgets
Zebra’s strengths in innovation and global reach create a solid foundation, but deteriorating returns and liquidity constraints require cautious capital allocation. Capturing growth in emerging markets and automation offers upside if executed prudently.
Stock Price Action Analysis
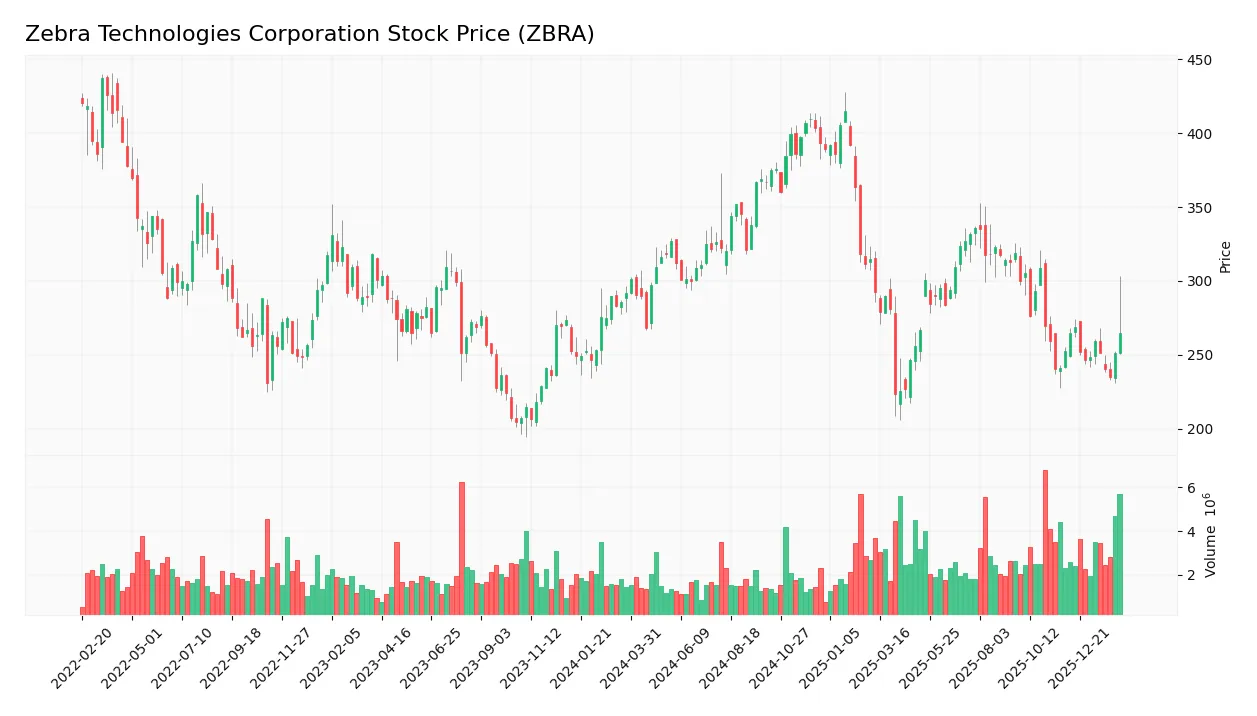
The weekly chart below illustrates Zebra Technologies Corporation’s stock price movements over the past 12 months, highlighting key highs and lows:
Trend Analysis
Over the past 12 months, Zebra Technologies’ stock declined by 9.2%, indicating a bearish trend. The price ranged from a high of 414.61 to a low of 223.49, with decelerating downward momentum. The 48.34 standard deviation suggests notable volatility throughout this period.
Volume Analysis
Trading volumes have been increasing, with 54.49% of total volume buyer-driven. In the recent three months, buyer dominance strengthened to 61.33%, reflecting growing investor interest and participation favoring accumulation over selling. This volume pattern signals cautious optimism despite the overall bearish price trend.
Target Prices
Analysts maintain a bullish consensus on Zebra Technologies Corporation with a solid target price range.
| Target Low | Target High | Consensus |
|---|---|---|
| 291 | 335 | 319.75 |
The target prices indicate strong confidence in Zebra’s growth prospects, with most analysts expecting appreciation above current levels.

Don’t Let Luck Decide Your Entry Point
Optimize your entry points with our advanced ProRealTime indicators. You’ll get efficient buy signals with precise price targets for maximum performance. Start outperforming now!
Analyst & Consumer Opinions
This section reviews recent analyst ratings and consumer feedback to provide insight into Zebra Technologies Corporation’s market perception.
Stock Grades
Here are the latest verified stock grades for Zebra Technologies Corporation from leading financial firms:
| Grading Company | Action | New Grade | Date |
|---|---|---|---|
| Needham | Maintain | Buy | 2026-02-13 |
| Citigroup | Maintain | Neutral | 2026-02-13 |
| Barclays | Maintain | Overweight | 2026-02-13 |
| Barclays | Maintain | Overweight | 2026-01-12 |
| Truist Securities | Maintain | Hold | 2025-12-18 |
The consensus leans toward a Buy rating, with Barclays consistently overweight and Citigroup neutral. The stability in grades suggests cautious optimism without aggressive upgrades.
Consumer Opinions
Consumers express a mix of admiration and concern regarding Zebra Technologies Corporation’s products and services.
| Positive Reviews | Negative Reviews |
|---|---|
| Durable and reliable hardware suited for tough environments. | Customer service response times can be slow. |
| Innovative solutions that integrate well with existing systems. | Pricing is perceived as high compared to competitors. |
| Strong focus on product quality and technological advancement. | Software updates occasionally introduce bugs. |
Overall, Zebra Technologies earns praise for durable, innovative products that meet industrial needs. However, customer service delays and premium pricing remain consistent pain points for users.
Risk Analysis
Below is a summary table of Zebra Technologies Corporation’s key risks, highlighting their likelihood and potential impact:
| Category | Description | Probability | Impact |
|---|---|---|---|
| Financial Health | Current ratio below 1 signals liquidity stress; quick ratio also weak (0.58). | Medium | High |
| Valuation Risk | Elevated P/E (29.45) and P/B (3.44) ratios indicate expensive shares. | Medium | Medium |
| Cost of Capital | ROIC (8.81%) below WACC (10.15%) implies value destruction. | High | High |
| Debt Management | Debt-to-equity ratio is unfavorable; interest coverage is strong but watch debt. | Medium | Medium |
| Market Volatility | Beta of 1.69 shows higher price sensitivity compared to S&P 500 benchmark. | High | Medium |
| Dividend Policy | No dividend yield reduces income appeal and signals conservative cash use. | Low | Low |
The most pressing risk is Zebra’s cost of capital exceeding returns, signaling potential capital inefficiency. Liquidity constraints also warrant caution, given the current and quick ratios under 1. Finally, the high beta points to amplified share price swings amid market fluctuations. Investors should weigh these risks against Zebra’s safe Altman Z-score and moderate Piotroski score before committing capital.
Should You Buy Zebra Technologies Corporation?
Zebra Technologies appears to have moderate profitability with declining operational efficiency, suggesting a deteriorating competitive moat. Despite a manageable leverage profile, its overall rating could be seen as a cautious B, reflecting balanced strengths and financial risks.
Strength & Efficiency Pillars
Zebra Technologies Corporation posts a safe Altman Z-Score of 3.48, signaling solid solvency. The firm maintains a net margin of 7.77% and a return on equity (ROE) of 11.68%, reflecting moderate profitability. However, its return on invested capital (ROIC) at 8.81% falls short of the weighted average cost of capital (WACC) at 10.15%, indicating the company is currently destroying value rather than creating it. Operational efficiency shows promise with a favorable interest coverage ratio of 7.41 and strong fixed asset turnover of 10.4.
Weaknesses and Drawbacks
Despite financial stability, Zebra faces valuation and liquidity challenges. Its price-to-earnings (P/E) ratio stands at 29.45, reflecting an expensive premium compared to industry peers. The price-to-book (P/B) ratio of 3.44 further suggests an overvalued equity. Liquidity metrics raise red flags, with a current ratio of 0.97 and quick ratio at 0.58, both below the safety threshold of 1.0, exposing the company to short-term cash flow risks. Additionally, a weak Piotroski score of 6 and bearish overall price trend (-9.2%) imply market skepticism.
Our Final Verdict about Zebra Technologies Corporation
Zebra’s profile shows operational competence but a troubling value destruction with ROIC below WACC. The safe Altman Z-Score offers reassurance against bankruptcy risk. However, elevated valuation multiples combined with tight liquidity and a bearish market trend suggest caution. The company might appear suited for investors with a higher risk tolerance, while more conservative capital may prefer to wait for clearer signs of financial improvement and valuation normalization.
Disclaimer: This content is for informational purposes only and does not constitute financial, investment, or other professional advice. Investing in financial markets involves a significant risk of loss, and past performance is not indicative of future results.
Additional Resources
- Zebra Technologies Corporation (NASDAQ:ZBRA) Q4 2025 earnings call transcript – MSN (Feb 13, 2026)
- Zebra Technologies Q4 Earnings: Beat Signals A Powerful AI Pivot (NASDAQ:ZBRA) – Seeking Alpha (Feb 13, 2026)
- Zebra Technologies Corporation (NASDAQ:ZBRA) Q4 2025 Earnings Call Transcript – Insider Monkey (Feb 13, 2026)
- Zebra Technologies Corporation $ZBRA Shares Sold by New South Capital Management Inc. – MarketBeat (Feb 13, 2026)
- Zebra Technologies (ZBRA) Is Up 13.7% After Raising 2026 Sales Outlook And Expanding Buybacks – Has The Bull Case Changed? – Yahoo Finance (Feb 13, 2026)
For more information about Zebra Technologies Corporation, please visit the official website: zebra.com