Home > Analyses > Consumer Cyclical > Yum! Brands, Inc.
Yum! Brands transforms everyday dining with iconic names like KFC, Taco Bell, and Pizza Hut, feeding millions across 157 countries. Its mastery of global franchising and menu innovation sets it apart in the fiercely competitive quick-service restaurant sector. As consumer tastes evolve and digital ordering rises, I ask whether Yum!’s proven business model can sustain growth and justify its premium valuation in today’s market.

Table of contents
Business Model & Company Overview
Yum! Brands, Inc., founded in 1997 and headquartered in Louisville, Kentucky, stands as a dominant player in the global quick-service restaurant industry. The company operates an integrated ecosystem of renowned brands—KFC, Pizza Hut, Taco Bell, and The Habit Burger Grill—each specializing in distinct food categories. This diversified portfolio creates a cohesive consumer experience spanning chicken, pizza, Mexican-style food, and chargrilled burgers across approximately 157 countries.
The company’s revenue engine balances franchise fees and operational income from nearly 54K units worldwide, leveraging a strong presence in the Americas, Europe, and Asia. This multi-brand, multi-region strategy drives steady cash flow and recurring royalties from franchisees. Yum! Brands’ competitive advantage lies in its vast global footprint and brand recognition, which create significant barriers to entry and position it to shape the future of fast casual dining.
Financial Performance & Fundamental Metrics
I analyze Yum! Brands’ income statement, key financial ratios, and dividend payout policy to assess its profitability, efficiency, and shareholder return strategy.
Income Statement
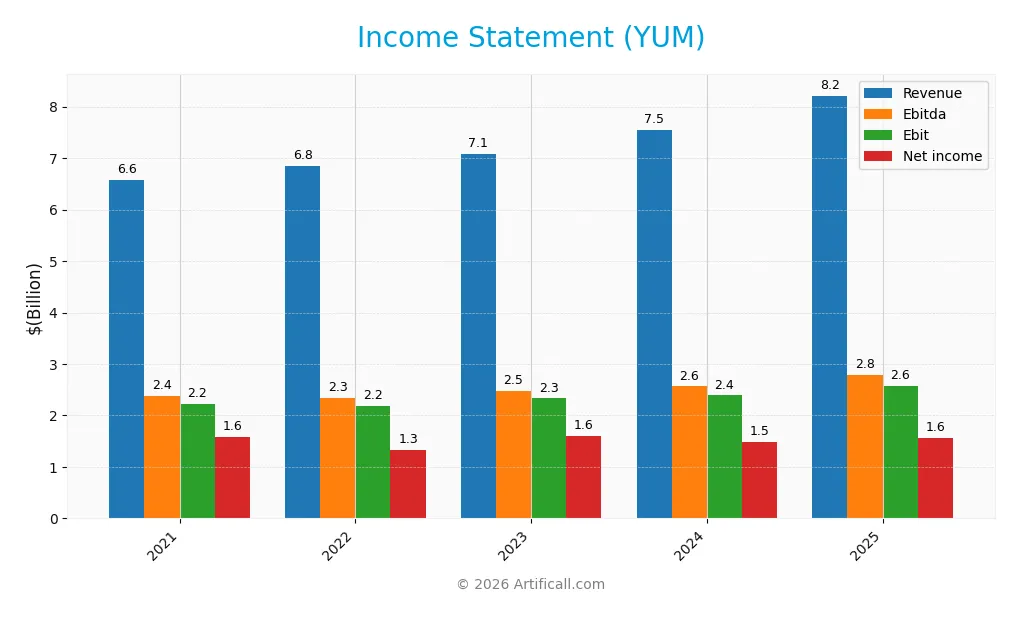
The table below presents Yum! Brands, Inc.’s key income statement figures for fiscal years 2021 through 2025, reflecting revenue, expenses, and profitability.
| 2021 | 2022 | 2023 | 2024 | 2025 | |
|---|---|---|---|---|---|
| Revenue | 6.58B | 6.84B | 7.08B | 7.55B | 8.21B |
| Cost of Revenue | 3.42B | 3.54B | 3.58B | 3.97B | 4.42B |
| Operating Expenses | 1.03B | 1.12B | 1.18B | 1.18B | 1.26B |
| Gross Profit | 3.17B | 3.31B | 3.50B | 3.58B | 3.79B |
| EBITDA | 2.38B | 2.34B | 2.48B | 2.56B | 2.79B |
| EBIT | 2.22B | 2.19B | 2.33B | 2.39B | 2.58B |
| Interest Expense | 544M | 527M | 513M | 489M | 500M |
| Net Income | 1.58B | 1.33B | 1.60B | 1.49B | 1.56B |
| EPS | 5.30 | 4.63 | 5.68 | 5.28 | 5.59 |
| Filing Date | 2022-02-23 | 2023-02-27 | 2024-02-20 | 2025-02-19 | 2026-02-20 |
Income Statement Evolution
Yum! Brands’ revenue grew steadily from 6.58B in 2021 to 8.21B in 2025, reflecting a 24.76% increase over five years. Gross profit rose correspondingly, maintaining a favorable gross margin near 46%. Operating expenses grew in line with revenue, preserving stable EBIT margins around 31%. Net income showed slight volatility, declining 1% overall despite recent growth in earnings per share.
Is the Income Statement Favorable?
In 2025, Yum! Brands posted 8.21B revenue and 1.56B net income, yielding an 18.98% net margin, marked favorable compared to industry norms. EBIT margin stood strong at 31.4%, supported by controlled operating expenses. Interest expense at 6.09% of revenue remained neutral. Despite a 3.58% decline in net margin growth last year, overall fundamentals appear solid with positive EPS growth.
Financial Ratios
The following table presents key financial ratios for Yum! Brands, Inc. over the last five fiscal years, illustrating profitability, liquidity, leverage, and market valuation trends:
| Ratios | 2021 | 2022 | 2023 | 2024 | 2025 |
|---|---|---|---|---|---|
| Net Margin | 24% | 19% | 23% | 20% | 19% |
| ROE | -19% | -15% | -20% | -19% | -21% |
| ROIC | 43% | 37% | 40% | 34% | 28% |
| P/E | 26.2 | 27.6 | 23.0 | 25.5 | 27.0 |
| P/B | -4.93 | -4.13 | -4.67 | -4.95 | -5.74 |
| Current Ratio | 1.08 | 0.97 | 1.26 | 1.47 | 1.35 |
| Quick Ratio | 1.08 | 0.97 | 1.26 | 1.47 | 1.35 |
| D/E | -1.45 | -1.43 | -1.53 | -1.61 | -1.63 |
| Debt-to-Assets | 2.03 | 2.17 | 1.93 | 1.83 | 1.45 |
| Interest Coverage | 3.93 | 4.15 | 4.52 | 4.91 | 5.06 |
| Asset Turnover | 1.10 | 1.17 | 1.14 | 1.12 | 1.00 |
| Fixed Asset Turnover | 3.27 | 3.58 | 3.61 | 3.45 | 5.12 |
| Dividend Yield | 1.44% | 1.77% | 1.85% | 1.99% | 1.88% |
Note: Negative P/B and D/E ratios indicate negative shareholders’ equity, a critical factor for risk assessment.
Evolution of Financial Ratios
Return on Equity (ROE) remained negative, declining slightly to -21.3% in 2025, signaling persistent challenges in equity profitability. The Current Ratio showed moderate stability, hovering around 1.35, indicating reasonable short-term liquidity. Debt-to-Equity Ratio improved notably to -1.63, reflecting an unusual capital structure with more liabilities than equity but less financial risk over time.
Are the Financial Ratios Favorable?
Profitability is mixed: net margin stands solid at 19.0%, while ROE is unfavorable. Liquidity ratios are neutral to favorable, with current and quick ratios above 1. Asset efficiency and leverage metrics are generally favorable, including a strong fixed asset turnover of 5.12 and interest coverage above 5. However, the high debt-to-assets ratio at 145% poses a risk. Overall, 64% of ratios are favorable, supporting a generally positive financial stance.
Shareholder Return Policy
Yum! Brands maintains a dividend payout ratio around 50%, with dividend per share steadily rising to $2.84 in 2025. The annual dividend yield is near 1.9%, supported by free cash flow coverage and ongoing share buybacks.
This balanced approach—combining dividends and buybacks—indicates a disciplined capital allocation strategy. It supports sustainable shareholder returns while preserving financial flexibility for future growth and risk management.
Score analysis
The following radar chart illustrates Yum! Brands’ valuation and financial performance scores:
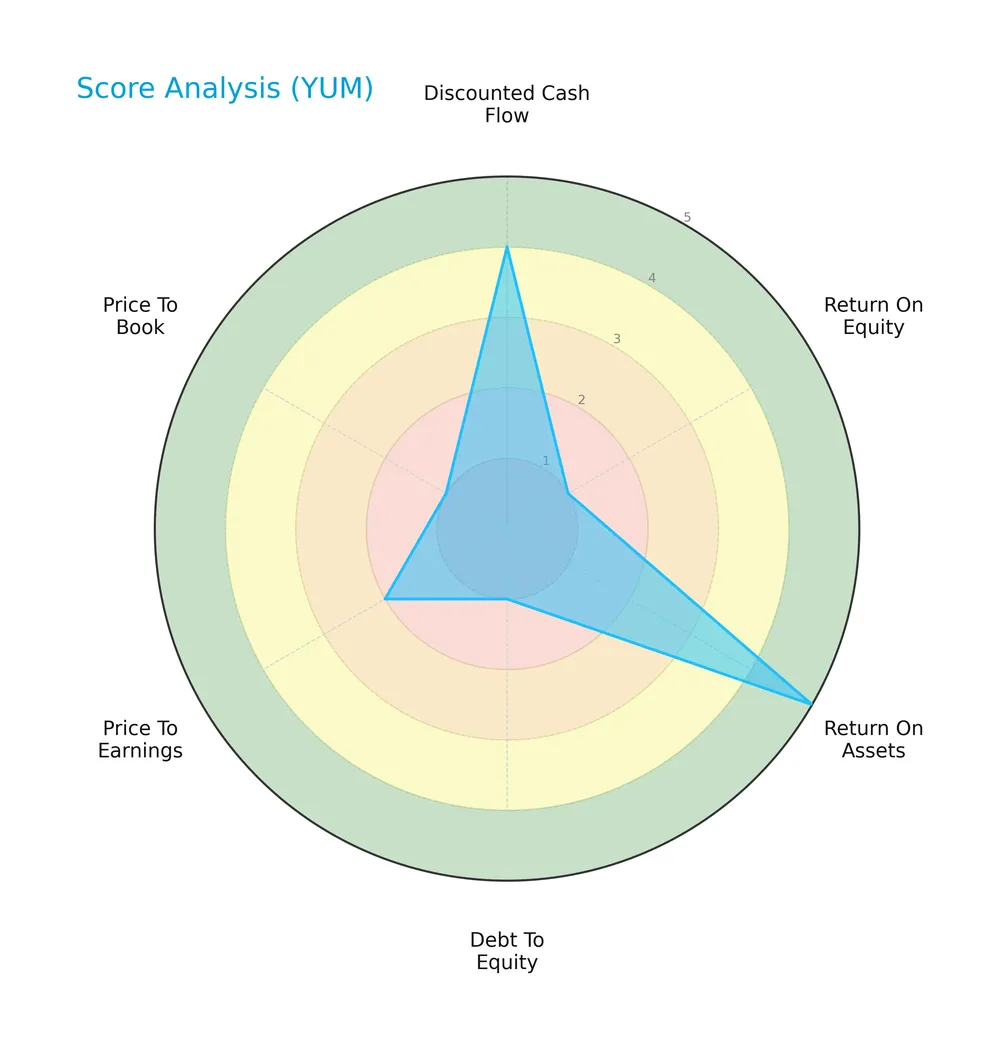
Yum! Brands shows mixed financial signals: strong discounted cash flow (4) and return on assets (5), but very weak return on equity (1), debt-to-equity (1), and price-to-book (1) scores. Price-to-earnings is also unfavorable (2).
Analysis of the company’s bankruptcy risk
Yum! Brands’ Altman Z-Score places it in the grey zone, indicating a moderate risk of bankruptcy and financial uncertainty:

Is the company in good financial health?
The Piotroski Score diagram reveals Yum! Brands’ overall financial strength based on profitability, leverage, and efficiency metrics:

With a score of 6, Yum! Brands demonstrates average financial health, reflecting moderate strengths but leaving room for improvement in stability and operational efficiency.
Competitive Landscape & Sector Positioning
This section examines Yum! Brands’ strategic positioning, revenue breakdown, key products, and main competitors. I will assess whether Yum! Brands holds a competitive advantage within the restaurant sector.
Strategic Positioning
Yum! Brands maintains a diversified portfolio across four major divisions—KFC, Taco Bell, Pizza Hut, and The Habit Burger Grill—generating $8.5B from KFC and Taco Bell combined in 2025. The company balances geographic exposure, with $4.5B revenue from the US and $1.6B from other international markets.
Revenue by Segment
This pie chart illustrates Yum! Brands’ revenue distribution by global division for fiscal year 2025, highlighting key business drivers and segment contributions.
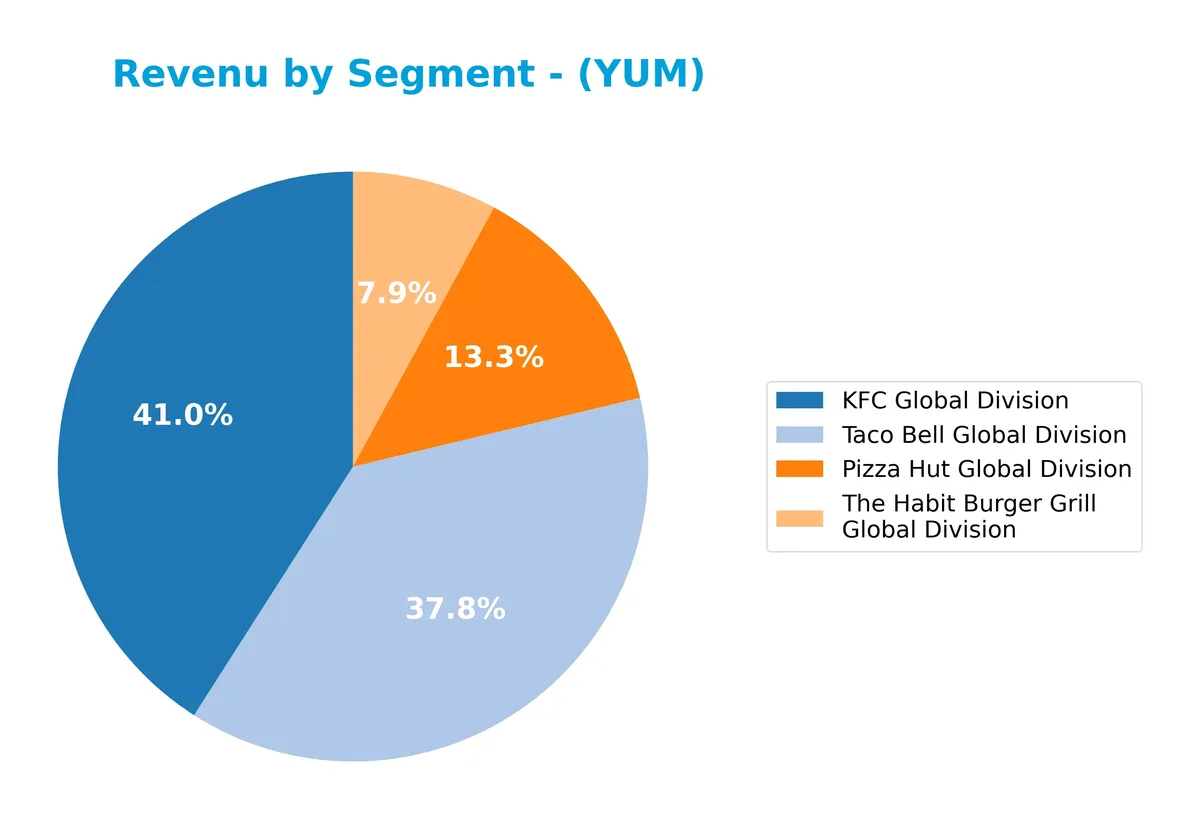
KFC leads with $3.54B, followed closely by Taco Bell at $3.10B, showing steady growth and strong market presence. Pizza Hut generates $1.01B, stable but less dominant. The Habit Burger Grill contributes $570M, reflecting a smaller niche role. Recent trends indicate acceleration in KFC and Taco Bell, signaling focused expansion, while Pizza Hut remains flat, suggesting concentration risk in the top two segments.
Key Products & Brands
Yum! Brands operates through these main restaurant brands and their food specializations:
| Product | Description |
|---|---|
| KFC | Specializes in chicken products with 26,934 units worldwide as of 2021. |
| Pizza Hut | Focuses on pizza offerings, operating 18,381 units globally. |
| Taco Bell | Offers Mexican-style food with 7,791 units internationally. |
| The Habit Burger Grill | Serves made-to-order chargrilled burgers and sandwiches with 318 units worldwide. |
Yum! Brands’ portfolio spans four major quick-service restaurant chains. Each brand targets distinct food categories, supporting geographic and menu diversification. The brand mix helps stabilize revenue streams across markets and consumer preferences.
Main Competitors
There are 6 competitors in the sector; the table below lists the top 10 leaders by market capitalization:
| Competitor | Market Cap. |
|---|---|
| McDonald’s Corporation | 217B |
| Starbucks Corporation | 95.5B |
| Chipotle Mexican Grill, Inc. | 50.6B |
| Yum! Brands, Inc. | 41.8B |
| Darden Restaurants, Inc. | 21.8B |
| Domino’s Pizza, Inc. | 14.4B |
Yum! Brands ranks 4th among its competitors, holding about 21% of McDonald’s market cap. It stands below both the average top 10 market cap of 73.5B and the sector median of 46.2B. Yum! Brands enjoys a 11.5% market cap lead over its nearest competitor above.
Comparisons with competitors
Check out how we compare the company to its competitors:
Does Yum! Brands have a competitive advantage?
Yum! Brands demonstrates a competitive advantage with a strong economic moat, creating value as its ROIC exceeds WACC by over 22%. However, the declining ROIC trend signals caution on future profitability.
The company’s global footprint across four major brands and presence in 157 countries supports growth. Expansion into new markets and product innovation remain key opportunities to sustain its advantage amid evolving consumer preferences.
SWOT Analysis
This SWOT analysis highlights Yum! Brands’ critical internal and external factors shaping its competitive position and strategic options.
Strengths
- strong global brand portfolio
- favorable gross and EBIT margins
- high ROIC exceeding WACC
Weaknesses
- declining ROIC trend
- negative return on equity
- high debt-to-assets ratio
Opportunities
- expansion in emerging markets
- menu innovation and digital ordering growth
- leveraging Habit Burger Grill for new segments
Threats
- intense industry competition
- economic sensitivity of consumer spending
- supply chain cost inflation
Yum! Brands combines solid profitability and global scale with challenges in capital efficiency and leverage. The firm must balance growth initiatives against margin pressures and financial risks to sustain long-term value creation.
Stock Price Action Analysis
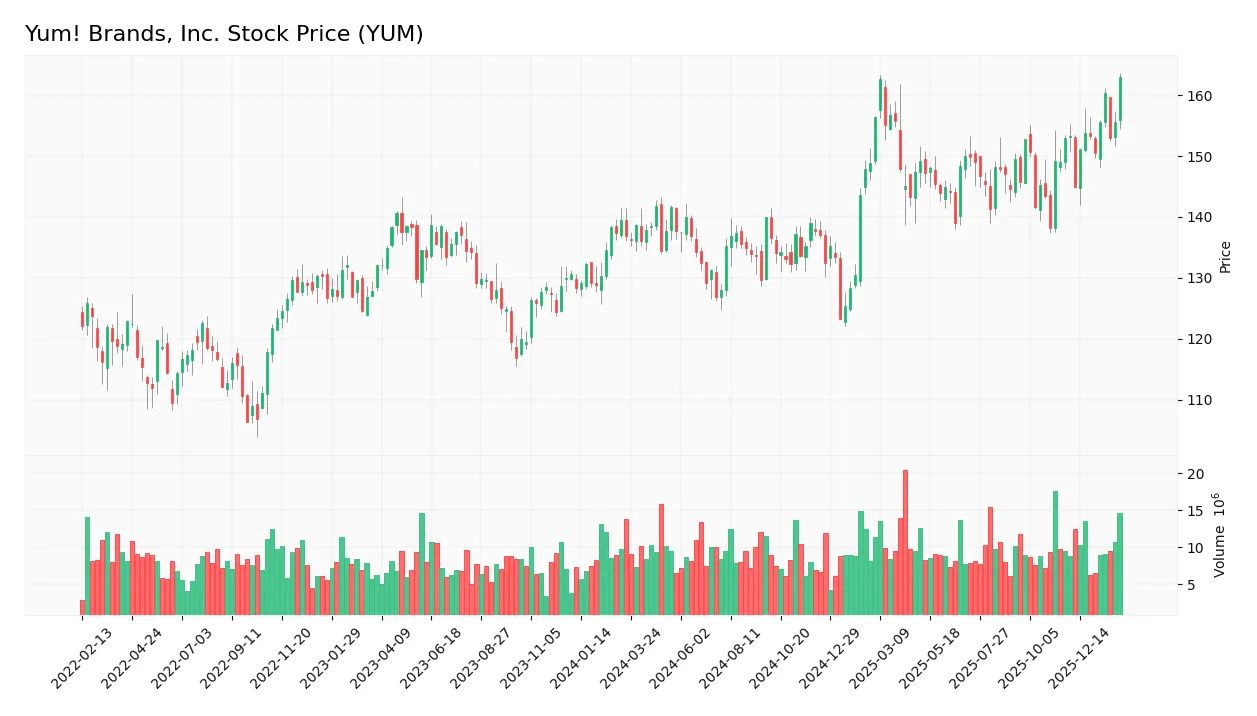
The weekly stock chart for Yum! Brands, Inc. displays price movements and volume trends over the last twelve months:
Trend Analysis
Over the past year, Yum! Brands’ stock price rose by 17.8%, indicating a bullish trend. The increase shows acceleration with volatility measured by a 9.03% standard deviation. The price peaked at 163.33 and bottomed at 123.25, confirming upward momentum.
Volume Analysis
Trading volume is increasing, with a total of 1.13B shares traded recently. Buyer volume slightly trails sellers overall at 49.1%. However, the last three months show a buyer-dominant trend with 62.82% buyer volume, signaling growing investor interest and positive market participation.
Target Prices
Analysts set a clear target consensus for Yum! Brands, indicating steady confidence in its growth potential.
| Target Low | Target High | Consensus |
|---|---|---|
| 158 | 190 | 173.15 |
The target range from 158 to 190 signals moderate upside, with a consensus around 173, reflecting solid expectations for Yum! Brands in 2026.

Don’t Let Luck Decide Your Entry Point
Optimize your entry points with our advanced ProRealTime indicators. You’ll get efficient buy signals with precise price targets for maximum performance. Start outperforming now!
Analyst & Consumer Opinions
This section examines Yum! Brands, Inc.’s analyst grades alongside consumer feedback to provide balanced insight.
Stock Grades
Here are the latest verified grades from recognized analysts for Yum! Brands, Inc.:
| Grading Company | Action | New Grade | Date |
|---|---|---|---|
| Evercore ISI Group | Maintain | Outperform | 2026-02-13 |
| TD Cowen | Maintain | Buy | 2026-02-05 |
| Citigroup | Maintain | Neutral | 2026-02-05 |
| Wells Fargo | Maintain | Equal Weight | 2026-02-05 |
| Citigroup | Maintain | Neutral | 2026-01-22 |
| Morgan Stanley | Maintain | Equal Weight | 2026-01-20 |
| Gordon Haskett | Upgrade | Buy | 2026-01-08 |
| Oppenheimer | Downgrade | Perform | 2026-01-07 |
| Barclays | Maintain | Overweight | 2026-01-07 |
| TD Cowen | Upgrade | Buy | 2025-11-17 |
The consensus reflects a cautious stance, with most analysts maintaining neutral or hold ratings. Upgrades to buy grades contrast with a few downgrades, indicating mixed but generally stable sentiment.
Consumer Opinions
Consumers express a mixed but generally favorable view of Yum! Brands, Inc., highlighting convenience and flavor variety.
| Positive Reviews | Negative Reviews |
|---|---|
| “Great taste and consistent quality.” | “Service can be slow during peak times.” |
| “Affordable meals with many options.” | “Some locations are not well maintained.” |
| “Fast delivery and easy online ordering.” | “Nutritional value could be better.” |
Overall, customers appreciate Yum! Brands for its flavor diversity and affordability. However, recurring concerns include inconsistent service speed and location upkeep.
Risk Analysis
Below is a summary of key risks facing Yum! Brands, Inc., highlighting their likelihood and potential impact:
| Category | Description | Probability | Impact |
|---|---|---|---|
| Financial Leverage | Debt to assets ratio at 145.3% signals very high leverage. | High | High |
| Profitability | Negative ROE (-21.28%) contrasts with strong ROIC (28.26%). | Medium | Medium |
| Valuation | Elevated P/E ratio (26.98) may indicate overvaluation risk. | Medium | Medium |
| Bankruptcy Risk | Altman Z-Score in grey zone (2.67) suggests moderate risk. | Medium | High |
| Operational Volatility | Beta of 0.657 indicates below-market volatility. | Low | Low |
| Dividend Stability | Dividend yield at 1.88% is modest but stable. | Low | Low |
Yum! Brands’ most concerning risk is excessive leverage, which can strain cash flow during downturns. The grey-zone Altman Z-Score reinforces caution on solvency. While ROIC outperforms WACC, the negative ROE flags equity inefficiency, stressing a need for improved capital allocation. Investors should weigh these risks against the company’s favorable asset turnover and stable market position.
Should You Buy Yum! Brands, Inc.?
Yum! Brands, Inc. appears to be creating value with a slightly favorable moat despite a declining ROIC trend. While operational efficiency seems robust, the leverage profile could be seen as substantial, resulting in a cautious B- rating and a mixed financial strength signal.
Strength & Efficiency Pillars
Yum! Brands, Inc. exhibits strong operational efficiency with a robust net margin of 18.98% and an EBIT margin of 31.4%. Its ROIC stands at an impressive 28.26%, well above the WACC of 6.07%, confirming the company as a clear value creator. Although the ROE is negative at -21.28%, the firm’s capacity to generate returns above its cost of capital underscores effective capital allocation. Favorable gross margin (46.17%) and solid asset turnover (1.0) further reinforce operational strength.
Weaknesses and Drawbacks
The Altman Z-Score of 2.67 places Yum! Brands in the grey zone, signaling moderate bankruptcy risk and caution. The valuation metrics are unfavorable, with a high P/E ratio of 26.98 indicating a premium market price, which may limit upside potential. Debt-to-assets ratio at 145.3% raises concerns over leverage, despite a favorable debt-to-equity score. The current ratio of 1.35 is neutral but suggests limited short-term liquidity cushion. These factors introduce material risks amid an otherwise efficient business model.
Our Final Verdict about Yum! Brands, Inc.
Yum! Brands may appear a compelling value creator with operational strength and a bullish long-term trend. However, the grey zone Altman Z-Score and elevated leverage advise caution. Despite recent buyer dominance and accelerating price momentum, the moderate solvency risk and stretched valuation suggest that the stock could warrant a wait-and-see approach before committing fresh capital.
Disclaimer: This content is for informational purposes only and does not constitute financial, investment, or other professional advice. Investing in financial markets involves a significant risk of loss, and past performance is not indicative of future results.
Additional Resources
- Decoding Yum Brands Inc (YUM): A Strategic SWOT Insight – GuruFocus (Feb 21, 2026)
- YUM BRANDS INC SEC 10-K Report – TradingView (Feb 20, 2026)
- Vanguard Group Inc. Increases Holdings in Yum! Brands, Inc. $YUM – MarketBeat (Feb 18, 2026)
- Do Wall Street Analysts Like Yum! Brands Stock? – Barchart.com (Feb 16, 2026)
- Yum! Brands: The ‘Taco Bell-ification’ Of KFC (Rating Downgrade) – Seeking Alpha (Feb 09, 2026)
For more information about Yum! Brands, Inc., please visit the official website: yum.com