Home > Analyses > Utilities > Xcel Energy Inc.
Xcel Energy powers millions of homes and businesses across the Upper Midwest and Southwest, quietly shaping how millions live and work every day. As a regulated electric and natural gas utility, it balances a diverse energy mix from renewables to nuclear, driving innovation in clean energy transition. Known for stability and reliability, Xcel dominates its regional markets. But with evolving energy demands and regulatory pressures, I ask: does its current valuation reflect sustainable growth or looming challenges?
Table of contents
Business Model & Company Overview
Xcel Energy Inc., founded in 1909 and headquartered in Minneapolis, Minnesota, commands a dominant position in the regulated electric utility sector. It operates a comprehensive ecosystem spanning electricity generation, transmission, and distribution, alongside natural gas services. The company integrates diverse energy sources—including coal, nuclear, gas, hydro, and renewables—into a cohesive mission to power millions of residential, commercial, and industrial customers across multiple states.
Xcel’s revenue engine balances regulated electric and natural gas utilities, with a substantial recurring base of 3.7M electricity and 2.1M gas customers. It maintains strategic footprints in the U.S. Midwest and Southwest, leveraging investments in pipelines and renewable infrastructure to enhance long-term value. This competitive advantage anchors Xcel Energy’s economic moat, positioning it as a key architect of the evolving energy landscape.
Financial Performance & Fundamental Metrics
I will analyze Xcel Energy Inc.’s income statement, key financial ratios, and dividend payout policy to assess its core financial health and shareholder value.
Income Statement
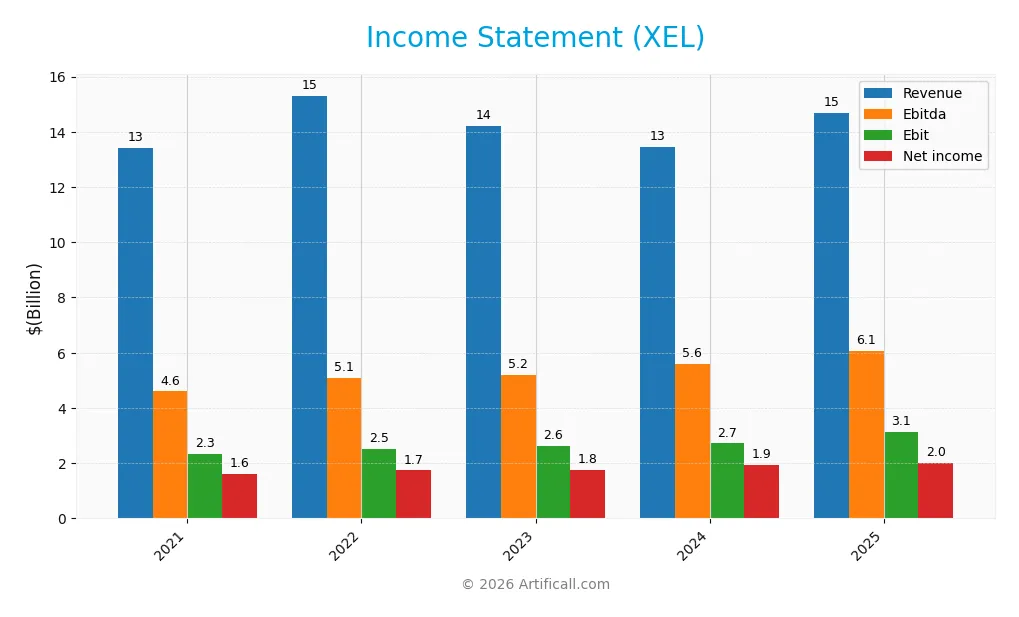
The table below summarizes Xcel Energy Inc.’s key income statement items for the fiscal years 2021 through 2025, reflecting revenue, expenses, profitability, and earnings per share.
| 2021 | 2022 | 2023 | 2024 | 2025 | |
|---|---|---|---|---|---|
| Revenue | 13.4B | 15.3B | 14.2B | 13.4B | 14.7B |
| Cost of Revenue | 8.2B | 9.5B | 8.2B | 7.3B | 11.1B |
| Operating Expenses | 3.1B | 3.4B | 3.5B | 3.8B | 0.7B |
| Gross Profit | 5.3B | 5.9B | 6.0B | 6.1B | 3.6B |
| EBITDA | 4.6B | 5.1B | 5.2B | 5.6B | 6.1B |
| EBIT | 2.3B | 2.5B | 2.6B | 2.7B | 3.1B |
| Interest Expense | 816M | 925M | 1.0B | 1.2B | 1.3B |
| Net Income | 1.6B | 1.7B | 1.8B | 1.9B | 2.0B |
| EPS | 2.96 | 3.17 | 3.21 | 3.44 | 3.44 |
| Filing Date | 2022-02-23 | 2023-02-23 | 2024-02-21 | 2025-02-27 | 2026-02-25 |
Income Statement Evolution
Xcel Energy’s revenue grew steadily by 9.22% overall from 2021 to 2025, with a 9.14% increase in the latest year. Net income increased 26.36% over the period, though it slowed slightly recently. Gross margin declined sharply by 42.01% last year, while EBIT and net margins improved overall, reflecting mixed margin trends.
Is the Income Statement Favorable?
In 2025, the company reported $14.7B revenue and $2.0B net income, yielding a 13.76% net margin, marked favorable by industry standards. EBIT margin at 21.24% also stands strong. Interest expense remains neutral at 9.16% of revenue. Despite a recent dip in gross profit and EPS growth, the fundamentals skew favorable overall.
Financial Ratios
The table below summarizes key financial ratios for Xcel Energy Inc. from 2021 through 2025, reflecting profitability, valuation, liquidity, leverage, efficiency, and dividend metrics:
| Ratios | 2021 | 2022 | 2023 | 2024 | 2025 |
|---|---|---|---|---|---|
| Net Margin | 12.0% | 11.3% | 12.5% | 14.4% | 13.8% |
| ROE | 10.2% | 10.4% | 10.1% | 9.9% | 8.5% |
| ROIC | 4.0% | 4.2% | 4.1% | 3.6% | 3.5% |
| P/E | 22.8 | 22.1 | 19.3 | 19.6 | 21.5 |
| P/B | 2.34 | 2.30 | 1.94 | 1.95 | 1.84 |
| Current Ratio | 0.84 | 0.85 | 0.72 | 0.67 | 3.23 |
| Quick Ratio | 0.72 | 0.71 | 0.59 | 0.57 | 3.23 |
| D/E | 1.58 | 1.56 | 1.56 | 1.55 | 1.44 |
| Debt-to-Assets | 42.8% | 42.5% | 42.9% | 43.1% | 37.3% |
| Interest Coverage | 2.70 | 2.62 | 2.47 | 2.02 | 2.14 |
| Asset Turnover | 0.23 | 0.25 | 0.22 | 0.19 | 0.16 |
| Fixed Asset Turnover | 0.29 | 0.31 | 0.27 | 0.23 | 0.00 |
| Dividend Yield | 2.56% | 2.64% | 3.20% | 3.09% | 3.83% |
Evolution of Financial Ratios
Return on Equity (ROE) declined from approximately 10.4% in 2022 to 8.55% in 2025, indicating a slowdown in profitability. The Current Ratio showed significant volatility, jumping from below 1 in prior years to 3.23 in 2025, suggesting changing liquidity dynamics. The Debt-to-Equity Ratio remained elevated above 1.4, reflecting consistent leverage without marked improvement.
Are the Financial Ratios Favorable?
In 2025, profitability measured by net margin (13.76%) is favorable, though ROE (8.55%) and ROIC (3.52%) lag below the WACC (5.08%), signaling weak capital efficiency. The high Current Ratio (3.23) is unfavorable, possibly indicating excess current assets, while the quick ratio at 3.23 is favorable. Leverage remains high with a Debt-to-Equity of 1.44, deemed unfavorable. Market multiples like P/E (21.48) and P/B (1.84) are neutral. Overall, ratios skew slightly unfavorable.
Shareholder Return Policy
Xcel Energy Inc. maintains a consistent dividend policy, with a payout ratio around 60-82% and a dividend yield near 3%. The dividend per share has steadily increased from $1.73 in 2021 to $2.83 in 2025. Share buybacks are not explicitly mentioned.
The payout is covered by free cash flow, though capex requirements remain significant. This distribution strategy balances shareholder returns with capital needs, supporting sustainable long-term value creation given the company’s stable earnings and cash flow profile.
Score analysis
The following radar chart presents a detailed view of Xcel Energy Inc.’s valuation and financial performance scores:
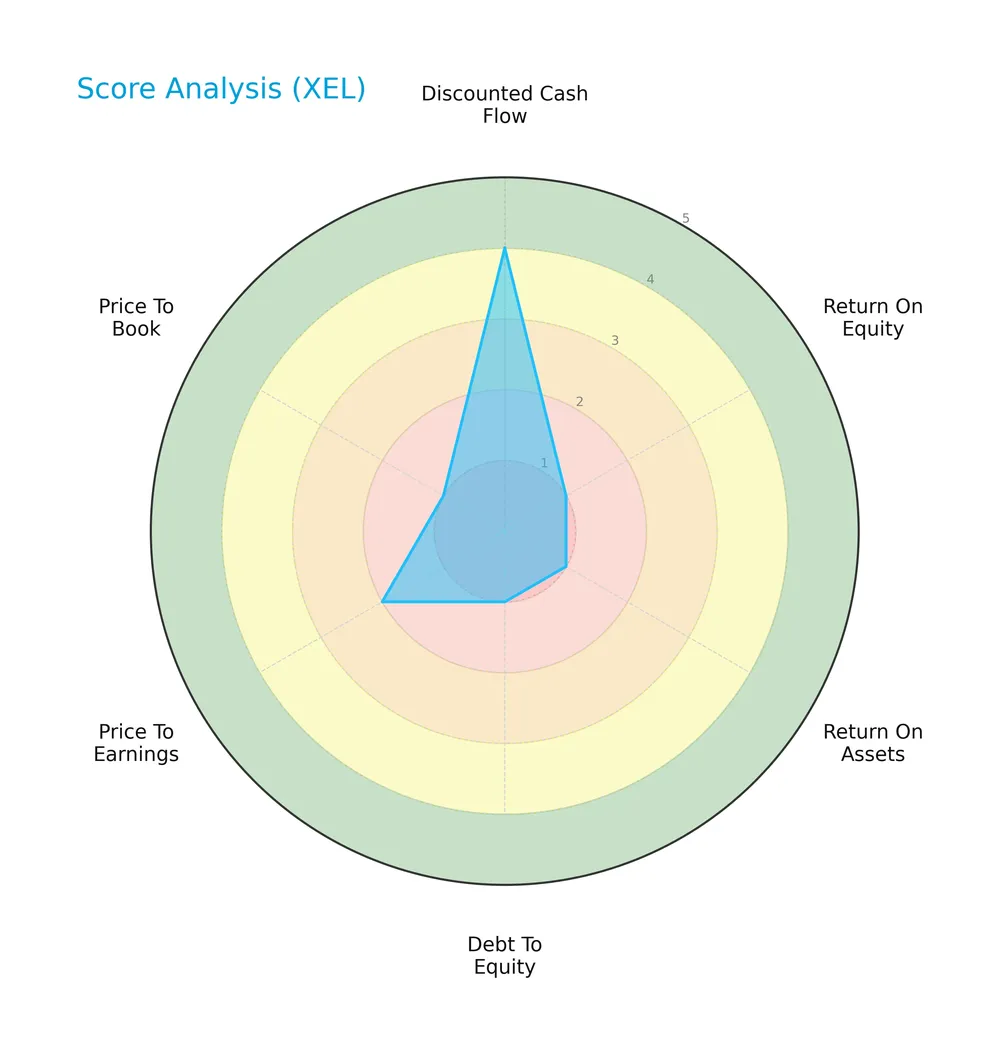
Xcel Energy scores favorably on discounted cash flow with a 4, indicating solid intrinsic value. Profitability metrics like ROE and ROA are moderate at 3. However, leverage and valuation ratios—debt-to-equity, PE, and PB—are unfavorable at 2, signaling financial and market valuation concerns.
Analysis of the company’s bankruptcy risk
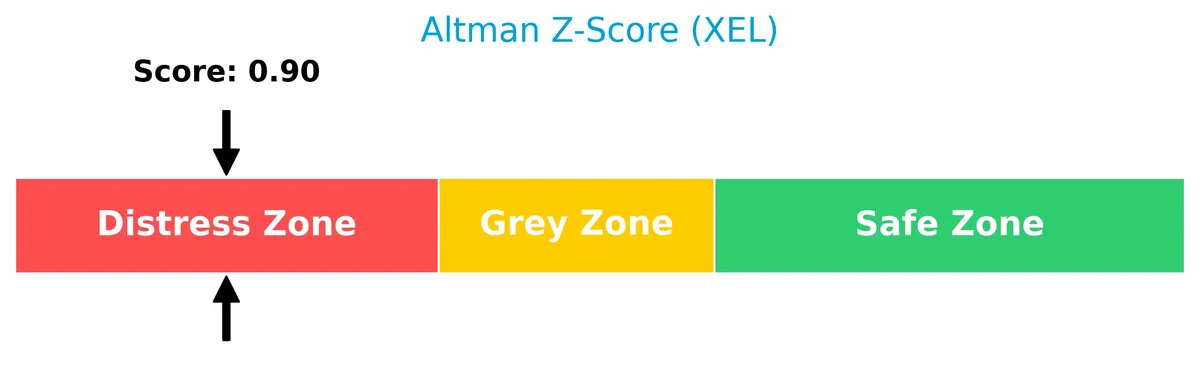
Xcel Energy’s Altman Z-Score places it firmly in the distress zone, indicating a high risk of financial distress and potential bankruptcy:
Is the company in good financial health?
The Piotroski Score diagram illustrates Xcel Energy’s financial health based on nine criteria:
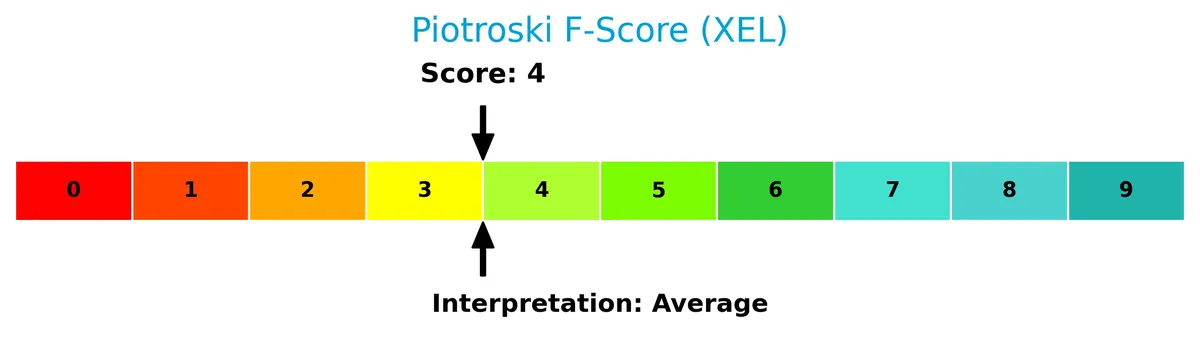
With a Piotroski Score of 3, the company shows very weak financial health. This low score suggests challenges in profitability, liquidity, or operational efficiency, raising caution for investors.
Competitive Landscape & Sector Positioning
This analysis examines Xcel Energy Inc.’s strategic positioning, revenue streams, product offerings, competitors, and strengths. I will assess whether Xcel Energy holds a competitive advantage over its industry peers.
Strategic Positioning
Xcel Energy focuses on a concentrated product portfolio dominated by regulated electric (24.3B in 2025) and natural gas utilities (4.9B in 2025). Its geographic exposure spans eight U.S. states, serving 3.7M electricity and 2.1M gas customers, reflecting a regional but diversified utility footprint.
Revenue by Segment
This pie chart displays Xcel Energy Inc.’s revenue distribution by segment for the fiscal year 2025, highlighting the contribution of regulated electric and natural gas operations.
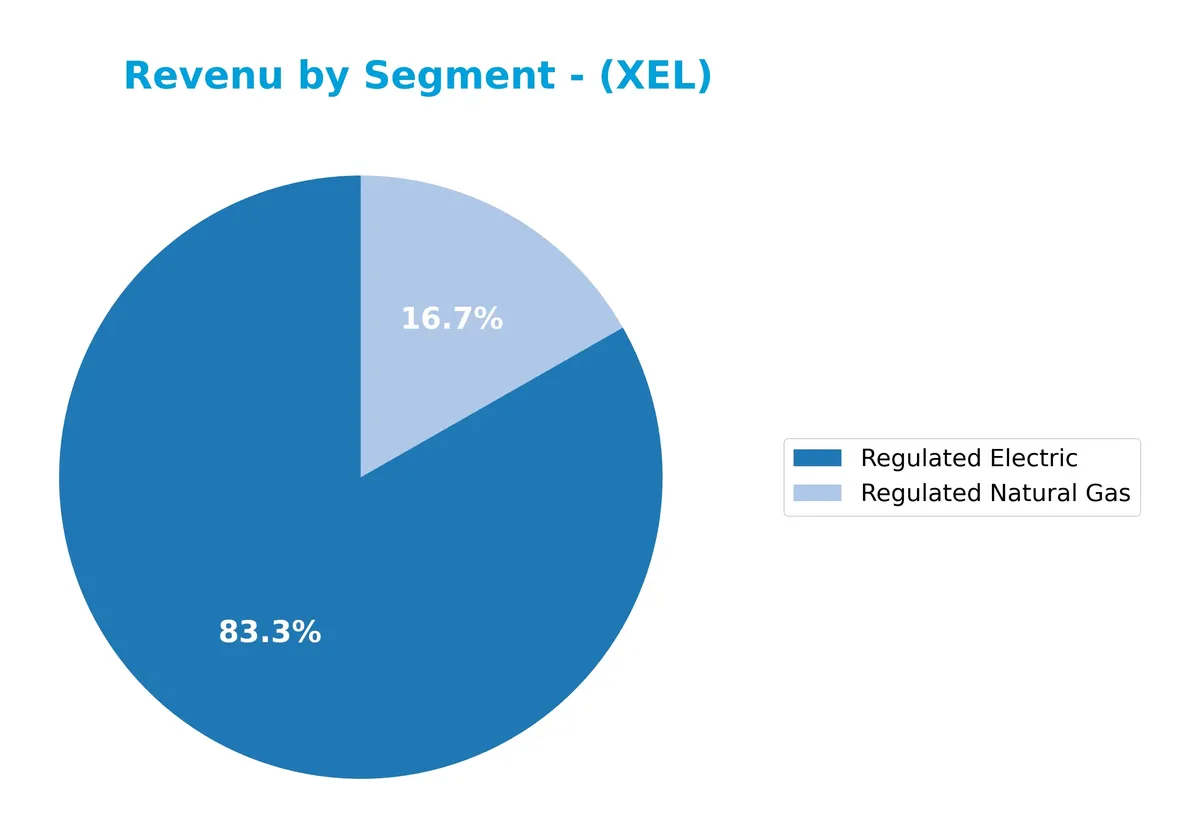
Regulated Electric dominates with $24.3B in revenue, showing a strong upward trajectory since 2023. Regulated Natural Gas also grew to $4.9B, reflecting steady demand and regulatory support. The business increasingly concentrates on regulated utilities, reducing exposure to smaller segments, which may enhance stability but brings regulatory risk concentration. The 2025 acceleration underscores robust utility fundamentals amid evolving energy markets.
Key Products & Brands
The table below outlines Xcel Energy Inc.’s primary products and brands by segment and their core descriptions:
| Product | Description |
|---|---|
| Regulated Electric | Generates and sells electricity via coal, nuclear, natural gas, hydro, solar, biomass, wind, and other sources. |
| Regulated Natural Gas | Purchases, transports, distributes, and sells natural gas to retail customers; develops and leases pipelines and storage. |
| Other Segments | Includes rental housing projects and equipment procurement for renewable generation construction. |
Xcel Energy’s product portfolio centers on regulated electric and natural gas utilities, serving millions of customers across multiple states. The company emphasizes diverse energy sources and infrastructure development within regulated markets.
Main Competitors
There are 23 competitors in the Utilities sector; below is a table of the top 10 leaders by market capitalization:
| Competitor | Market Cap. |
|---|---|
| NextEra Energy, Inc. | 169B |
| The Southern Company | 96B |
| Duke Energy Corporation | 91B |
| American Electric Power Company, Inc. | 62B |
| Dominion Energy, Inc. | 51B |
| Exelon Corporation | 44B |
| Xcel Energy Inc. | 44B |
| Entergy Corporation | 42B |
| Public Service Enterprise Group Incorporated | 40B |
| Consolidated Edison, Inc. | 36B |
Xcel Energy Inc. ranks 7th among 23 competitors in the Regulated Electric industry. It holds 29.3% of the market cap of the sector leader, NextEra Energy. Xcel’s market cap is below the top 10 average of 67.5B but above the sector median of 34B. The company is about 10.2% smaller than its next competitor above, Exelon Corporation, indicating a moderate gap in scale.
Comparisons with competitors
Check out how we compare the company to its competitors:
Does Xcel Energy Inc. have a competitive advantage?
Xcel Energy currently lacks a competitive advantage, as its return on invested capital (ROIC) trails its weighted average cost of capital (WACC), indicating value destruction and declining profitability. The company’s ROIC trend over 2021-2025 confirms a deteriorating capital efficiency, signaling challenges in sustaining economic profits.
Looking ahead, Xcel Energy’s operations span diverse energy sources and regulated markets across several states, offering avenues for growth through renewable generation projects and natural gas infrastructure. While these initiatives provide future opportunities, the firm must address its weakening value creation to capitalize effectively.
SWOT Analysis
This analysis highlights Xcel Energy Inc.’s key internal and external factors impacting its strategic positioning.
Strengths
- diversified energy mix
- regulated utility model ensures steady cash flow
- attractive dividend yield of 3.83%
Weaknesses
- declining ROIC indicating value destruction
- unfavorable debt-to-equity ratio of 1.44
- low Altman Z-Score signals financial distress
Opportunities
- growing demand for renewable energy
- potential for operational efficiency improvements
- regulatory support for clean energy investments
Threats
- regulatory changes impacting tariffs
- rising interest rates increasing financing costs
- competition from alternative energy providers
Xcel Energy’s stable cash flow and dividend appeal contrast with its declining profitability and financial distress risks. The company must leverage renewables growth and operational improvements to counterbalance its financial vulnerabilities and sector threats.
Stock Price Action Analysis
The weekly stock chart below highlights Xcel Energy Inc.’s price movements over the past 12 months, showing key highs and lows with clear trend patterns:
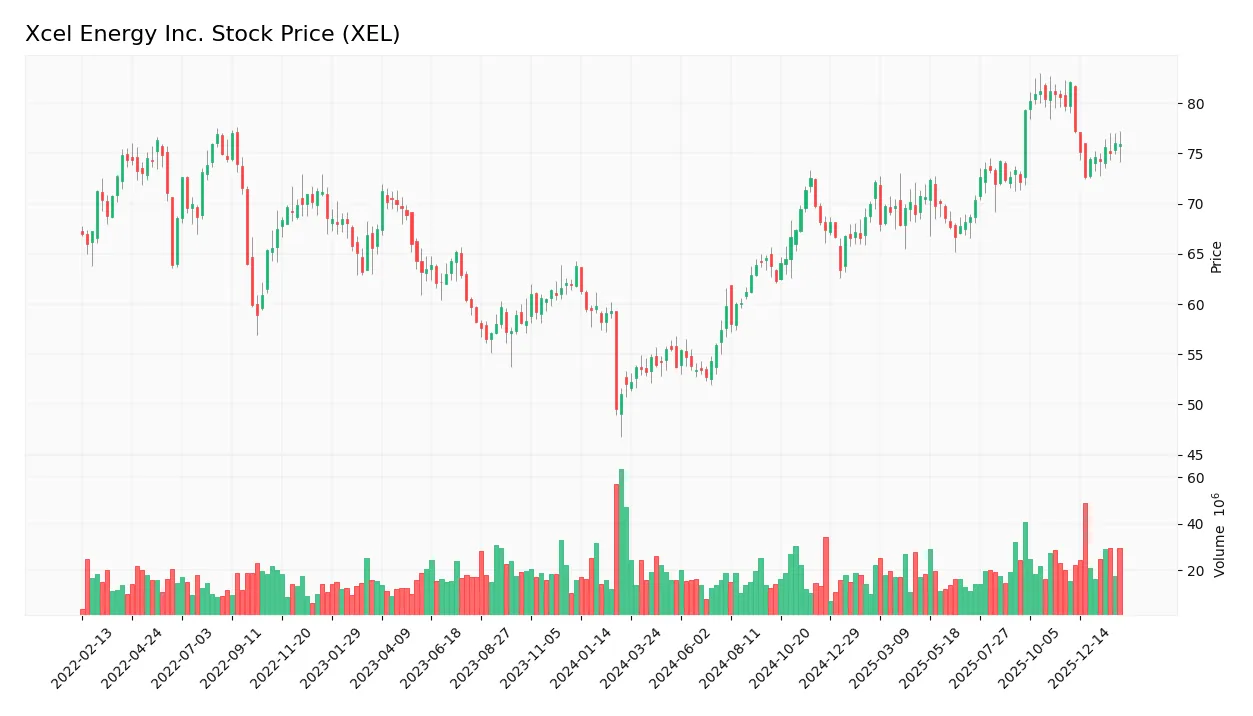
Trend Analysis
Over the past 12 months, XEL’s stock price rose 56.08%, indicating a strong bullish trend with accelerating momentum. The price fluctuated between a low of 52.69 and a high of 83.55. Volatility remains elevated, with an 8.22 standard deviation, reflecting significant price swings.
Volume Analysis
Trading volume has increased overall, with buyers accounting for 57.24% of total activity, suggesting buyer-driven momentum. However, in the recent three-month period, seller volume slightly dominates at 58.12%, indicating cautious sentiment amid rising volumes and mixed market participation.
Target Prices
Analysts project a moderately bullish outlook for Xcel Energy Inc., reflecting confidence in its stable utilities sector position.
| Target Low | Target High | Consensus |
|---|---|---|
| 82 | 95 | 89.5 |
The target range suggests upside potential near 6% from current levels, indicating steady growth expectations among professionals.

Don’t Let Luck Decide Your Entry Point
Optimize your entry points with our advanced ProRealTime indicators. You’ll get efficient buy signals with precise price targets for maximum performance. Start outperforming now!
Analyst & Consumer Opinions
This section examines Xcel Energy Inc.’s analyst ratings and consumer feedback to provide a balanced overview.
Stock Grades
Here are the latest verified stock grades for Xcel Energy Inc. from recognized analysts:
| Grading Company | Action | New Grade | Date |
|---|---|---|---|
| UBS | Upgrade | Buy | 2026-02-13 |
| Barclays | Maintain | Overweight | 2026-01-15 |
| UBS | Maintain | Neutral | 2025-12-17 |
| Keybanc | Maintain | Overweight | 2025-12-12 |
| JP Morgan | Maintain | Overweight | 2025-12-11 |
| Barclays | Maintain | Overweight | 2025-11-05 |
| Citigroup | Maintain | Buy | 2025-11-03 |
| UBS | Maintain | Neutral | 2025-10-31 |
| Mizuho | Maintain | Outperform | 2025-10-27 |
| Jefferies | Maintain | Buy | 2025-10-16 |
The consensus reflects a predominantly positive outlook, with multiple upgrades and consistent buy or overweight ratings. Neutral grades persist but do not dominate, indicating steady confidence among analysts.
Consumer Opinions
Xcel Energy Inc. enjoys mixed consumer sentiment, reflecting its solid service but occasional operational challenges.
| Positive Reviews | Negative Reviews |
|---|---|
| Reliable energy supply, rarely experiences outages | Customer service response times are slow |
| Competitive pricing compared to regional peers | Billing errors have caused confusion |
| Strong commitment to renewable energy initiatives | Limited communication during service disruptions |
| Community engagement and support programs praised | Some customers report inconsistent service quality |
Consumers consistently praise Xcel Energy’s reliability and green energy focus. However, slow customer support and billing issues remain notable concerns.
Risk Analysis
Below is a summary table of key risks for Xcel Energy Inc., outlining their probability and potential impact on the company:
| Category | Description | Probability | Impact |
|---|---|---|---|
| Financial Health | Altman Z-Score at 0.90 signals high bankruptcy risk, in the distress zone. | High | Severe |
| Profitability | Low ROIC (3.52%) below WACC (5.08%) indicates value destruction. | Medium | High |
| Leverage | Debt-to-equity ratio of 1.44 is unfavorable, increasing financial risk. | Medium | Medium |
| Liquidity | Current ratio of 3.23 is high but flagged unfavorable, possibly due to asset structure. | Medium | Low |
| Market Valuation | Neutral P/E (21.48) and P/B (1.84) ratios limit upside potential. | Medium | Medium |
| Operational Efficiency | Low asset turnover (0.16) and fixed asset turnover (0) suggest poor asset use. | Medium | Medium |
| Dividend Sustainability | Dividend yield favorable at 3.83%, but profitability and cash flow concerns could pressure payouts. | Medium | Medium |
Xcel Energy’s most pressing risk is its distressed Altman Z-Score, indicating a real threat of financial distress. Additionally, the company’s ROIC below WACC signals it struggles to generate returns above its cost of capital, undermining value creation. High leverage compounds these risks. Investors should weigh these red flags carefully against the stable dividend and regulated utility sector’s defensive traits.
Should You Buy Xcel Energy Inc.?
Xcel Energy Inc. appears to have a deteriorating competitive moat with declining profitability and value destruction. While profitability shows modest operational efficiency, the leverage profile is substantial. The overall B rating suggests a cautiously favorable profile amid notable financial risks.
Strength & Efficiency Pillars
Xcel Energy Inc. delivers solid operational margins, including a gross margin of 24.3% and an EBIT margin of 21.24%. The net margin stands at a respectable 13.76%, reflecting efficient cost management. However, the return on invested capital (3.52%) falls below the weighted average cost of capital (5.08%), indicating the company is shedding value rather than creating it. This gap signals weakening profitability over time and raises concerns about long-term value generation.
Weaknesses and Drawbacks
Xcel Energy is in financial distress, with an Altman Z-Score of 0.90, suggesting a high bankruptcy risk. The company’s Piotroski score is very weak at 3, underscoring fragile financial health. Leverage is elevated, with a debt-to-equity ratio of 1.44, increasing financial vulnerability. The current ratio is 3.23 but flagged unfavorable, hinting at potential liquidity mismanagement. Valuation metrics like P/E at 21.48 and P/B at 1.84 are neutral but could amplify risks amid market volatility.
Our Final Verdict about Xcel Energy Inc.
Despite operational margin strengths, Xcel Energy’s solvency risk marked by a distress zone Altman Z-Score makes the investment profile highly speculative. The company’s declining ROIC and weak financial health caution against conservative capital allocation. Investors might consider waiting for clear improvements in financial stability before adding exposure, as current risks overshadow potential value.
Disclaimer: This content is for informational purposes only and does not constitute financial, investment, or other professional advice. Investing in financial markets involves a significant risk of loss, and past performance is not indicative of future results.
Additional Resources
- Morgan Stanley Retains an Equal Rating on Xcel Energy Inc. (XEL) – Bitget (Feb 26, 2026)
- Decoding Xcel Energy Inc (XEL): A Strategic SWOT Insight – GuruFocus (Feb 26, 2026)
- Xcel Energy Inc. Board Increases 2026 Common Dividend, Declares Dividend on Common Stock – Business Wire (Feb 25, 2026)
- Xcel Energy Locks In Google and Doubles Its Pipeline to 6 GW: Here’s What Investors Need to Know – TIKR.com (Feb 25, 2026)
- Magellan Asset Management Ltd Purchases 122,487 Shares of Xcel Energy Inc. $XEL – MarketBeat (Feb 25, 2026)
For more information about Xcel Energy Inc., please visit the official website: xcelenergy.com