Home > Analyses > Consumer Cyclical > Wynn Resorts, Limited
Wynn Resorts transforms entertainment and luxury hospitality into immersive experiences that captivate millions worldwide. Its integrated resorts in Las Vegas, Macau, and Boston redefine gaming and leisure with lavish hotels, expansive casinos, fine dining, and vibrant nightlife. Known for innovation and meticulous design, Wynn commands a premium brand in the gambling sector. The key question: does Wynn’s strong market presence still translate into sustainable growth and justify its current valuation?

Table of contents
Business Model & Company Overview
Wynn Resorts, Limited, founded in 2002 and headquartered in Las Vegas, Nevada, dominates the Gambling, Resorts & Casinos sector with an integrated luxury ecosystem. Its portfolio spans vast casino floors, premium hotel towers, high-end retail, and exclusive entertainment venues, creating a seamless experience that blends gaming with hospitality and lifestyle services. This approach solidifies its competitive advantage in attracting affluent clientele globally.
The company generates revenue through a balanced mix of gaming operations and premium lodging, supported by extensive food, beverage, and retail offerings. It operates flagship properties across key markets: Las Vegas, Macau, and Boston, leveraging regional demand and tourism flows. Wynn’s economic moat stems from its iconic brand and scale, which I see as pivotal in shaping the evolution of luxury resort gaming worldwide.
Financial Performance & Fundamental Metrics
I will analyze Wynn Resorts, Limited’s income statement, key financial ratios, and dividend payout policy to assess its core financial health and shareholder returns.
Income Statement
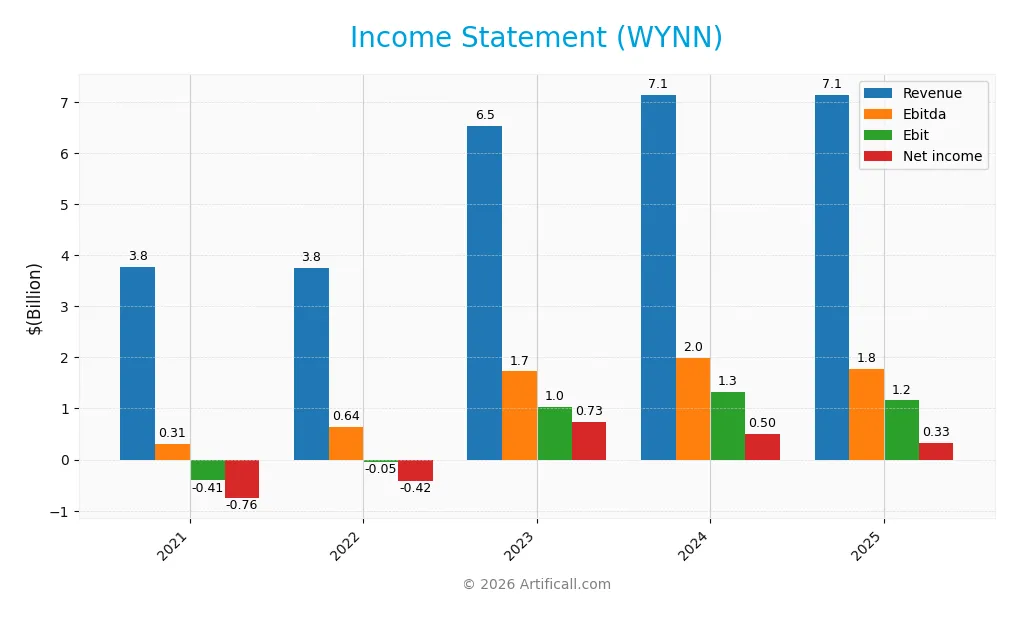
The following table summarizes Wynn Resorts, Limited’s key income statement figures for fiscal years 2021 through 2025, reported in USD.
| 2021 | 2022 | 2023 | 2024 | 2025 | |
|---|---|---|---|---|---|
| Revenue | 3.76B | 3.76B | 6.53B | 7.13B | 7.14B |
| Cost of Revenue | 2.56B | 2.39B | 3.71B | 4.03B | 4.80B |
| Operating Expenses | 1.60B | 1.47B | 1.98B | 1.97B | 1.18B |
| Gross Profit | 1.21B | 1.37B | 2.82B | 3.10B | 2.34B |
| EBITDA | 310M | 643M | 1.72B | 1.99B | 1.78B |
| EBIT | -406M | -49M | 1.04B | 1.33B | 1.16B |
| Interest Expense | 606M | 651M | 752M | 688M | 626M |
| Net Income | -756M | -424M | 713M | 480M | 327M |
| EPS | -6.64 | -3.73 | 6.49 | 4.56 | 3.16 |
| Filing Date | 2022-02-28 | 2023-02-27 | 2024-02-23 | 2025-02-13 | 2026-03-02 |
Income Statement Evolution
Wynn Resorts’ revenue grew 90% from 2021 to 2025 but stalled with only 0.14% growth in 2025. Net income surged 143% over the period but dropped 35% in the latest year. Gross margin softened from 43.5% in 2024 to 32.7% in 2025, while EBIT margin remained solid at 16.2%, reflecting stable operational efficiency despite margin pressures.
Is the Income Statement Favorable?
In 2025, Wynn delivered $7.1B revenue and $327M net income, with a 4.6% net margin signaling moderate profitability. Interest expense at 8.8% of revenue remains neutral, avoiding excessive leverage risks. However, net income and EPS declined sharply year-over-year, driven by a 25% gross profit drop and 13% EBIT contraction. Overall, fundamentals appear cautious but show operational resilience.
Financial Ratios
The following table presents Wynn Resorts, Limited’s key financial ratios from 2021 to 2025, highlighting profitability, liquidity, leverage, and market valuation metrics:
| Ratios | 2021 | 2022 | 2023 | 2024 | 2025 |
|---|---|---|---|---|---|
| Net Margin | -20.1% | -11.3% | 11.2% | 7.0% | 4.6% |
| ROE | 3.5% | 0.6% | -2.9% | -2.2% | -31.7% |
| ROIC | -3.5% | -0.8% | 6.7% | 9.8% | 8.0% |
| P/E | -12.8 | -22.1 | 14.0 | 18.9 | 38.1 |
| P/B | -45.1 | -12.5 | -40.8 | -42.3 | -12.1 |
| Current Ratio | 2.23 | 2.22 | 1.93 | 1.90 | 1.63 |
| Quick Ratio | 2.18 | 2.19 | 1.89 | 1.85 | 1.58 |
| D/E | -56.2 | -18.3 | -53.2 | -54.3 | -11.8 |
| Debt-to-Assets | 96.2% | 102.4% | 95.5% | 93.7% | 92.9% |
| Interest Coverage | -0.65 | -0.15 | 1.12 | 1.65 | 1.85 |
| Asset Turnover | 0.30 | 0.28 | 0.47 | 0.55 | 0.54 |
| Fixed Asset Turnover | 0.41 | 0.43 | 0.77 | 0.86 | 0.85 |
| Dividend Yield | 0.02% | 0.02% | 0.83% | 1.47% | 0.83% |
Evolution of Financial Ratios
From 2021 to 2025, Wynn Resorts saw a volatile trend in key ratios. Return on Equity (ROE) declined sharply, turning negative at -31.74% in 2025, indicating deteriorating shareholder returns. The Current Ratio decreased steadily from 2.23 to 1.63, signaling reduced liquidity but remaining above 1. Debt-to-Equity ratio improved from extreme negatives to -11.81, suggesting some stabilization in leverage despite persistent structural concerns.
Are the Financial Ratios Favorable?
In 2025, Wynn’s profitability ratios such as net margin (4.59%) and ROE (-31.74%) are unfavorable, reflecting weak earnings and shareholder value. Liquidity ratios, including current (1.63) and quick (1.58), remain favorable, supporting short-term obligations. Leverage ratios show mixed signals: a highly unfavorable 92.9% debt-to-assets ratio contrasts with a favorable negative debt-to-equity ratio. Asset turnover is neutral, while the price-to-earnings ratio (38.12) is unfavorable. Overall, the financial ratios appear slightly unfavorable, emphasizing caution.
Shareholder Return Policy
Wynn Resorts maintains a consistent dividend payment with a payout ratio near 28-32% and a modest yield around 0.8-1.5%. Dividends are well covered by free cash flow, reflecting prudent capital allocation. Share buyback activities are not explicitly detailed.
This disciplined distribution approach aligns with sustainable value creation. The moderate payout leaves room for reinvestment, supporting long-term growth while rewarding shareholders. The policy balances returns with financial stability amid operating leverage and leverage risks.
Score analysis
Here is a comprehensive overview of Wynn Resorts’ key financial scores as a basis for evaluation:

The discounted cash flow and return on equity scores are very unfavorable, signaling valuation and profitability concerns. Return on assets is moderate, but debt to equity, price to earnings, and price to book scores remain very unfavorable, reflecting financial and market valuation risks.
Analysis of the company’s bankruptcy risk
The Altman Z-Score places Wynn Resorts in the distress zone, indicating a high probability of financial distress and bankruptcy risk:

Is the company in good financial health?
The Piotroski score diagram illustrates Wynn Resorts’ current financial health status:

With a Piotroski score of 6, the company shows average financial strength. This score suggests moderate operational efficiency and financial stability, but not a strong cushion against market or operational shocks.
Competitive Landscape & Sector Positioning
This sector analysis explores Wynn Resorts, Limited’s strategic positioning and revenue streams. I will assess whether Wynn holds a competitive advantage over its main rivals in gambling and resorts.
Strategic Positioning
Wynn Resorts concentrates on integrated resorts with diversified revenue streams: casinos lead at $4.4B, followed by occupancy, food and beverage, and entertainment. Geographically, it balances exposure between Macau ($2.3B), Las Vegas ($2.6B), and Encore Boston Harbor ($0.85B), reflecting focused regional operations.
Revenue by Segment
The pie chart illustrates Wynn Resorts’ revenue distribution across key segments for fiscal year 2025, highlighting their relative contributions to total sales.
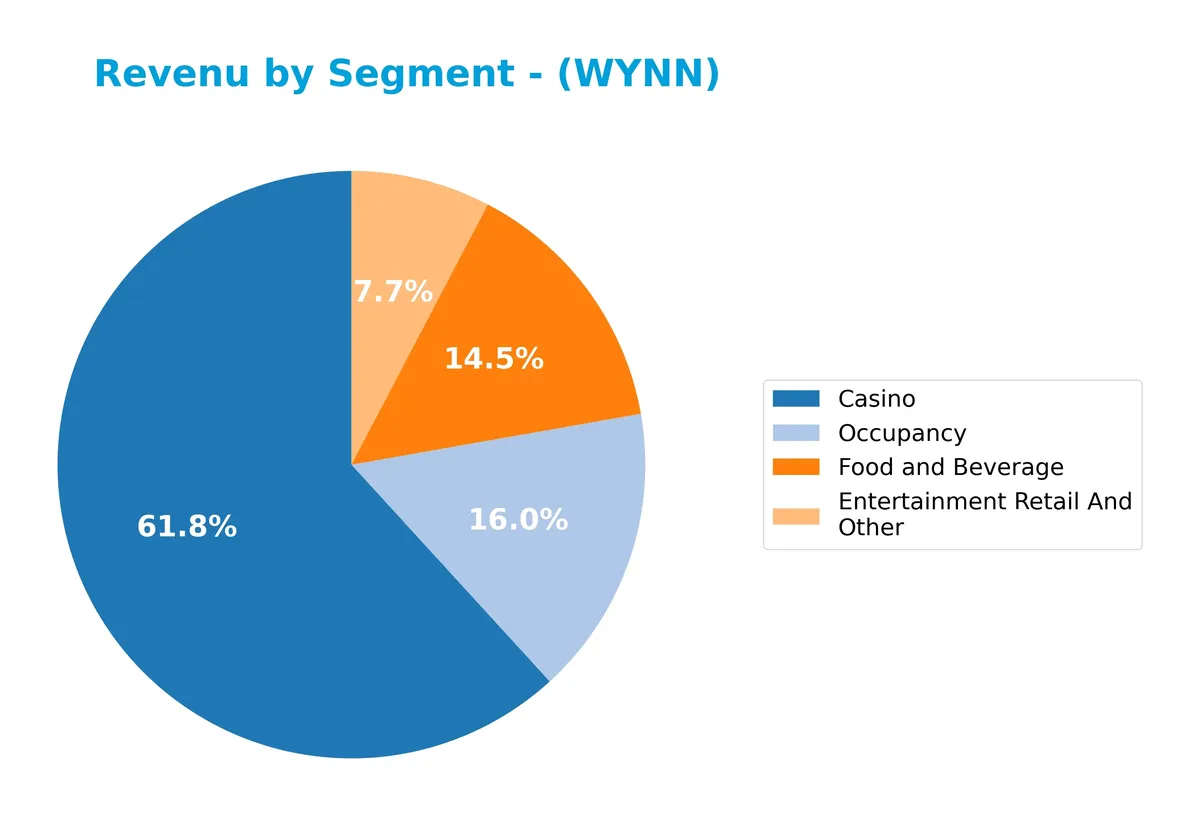
Casino revenue leads decisively at 4.4B, underscoring its core role in Wynn’s business model. Occupancy (1.1B) and Food and Beverage (1.0B) segments also contribute significantly, showing steady scale. Entertainment Retail and Other lags at 549M, indicating a smaller but stable part of the mix. The 2025 data suggest a slight casino revenue acceleration, reinforcing Wynn’s reliance on gaming despite diversification efforts.
Key Products & Brands
The table below outlines Wynn Resorts’ main products and brand offerings across its integrated resort segments:
| Product | Description |
|---|---|
| Casino | Large-scale casino operations featuring thousands of slot machines, table games, private salons, and poker rooms. |
| Occupancy | Luxury hotel accommodations including guest rooms, suites, villas, and associated amenities like spas and pools. |
| Food and Beverage | Diverse portfolio of 14-32 food and beverage outlets across resorts, ranging from casual dining to fine restaurants. |
| Entertainment, Retail & Other | Meeting and convention spaces, retail outlets, theaters, nightclubs, performance lakes, and other leisure attractions. |
| Wynn Palace | Integrated resort in Macau with 424K sq ft casino, 1,706 hotel rooms, 107K sq ft retail, and floral displays. |
| Wynn Macau | Macau resort with 252K sq ft casino, 1,010 hotel rooms, 59K sq ft retail, and Chinese zodiac-inspired attractions. |
| Las Vegas Operations | Las Vegas resorts with 194K sq ft casino, 4,748 hotel rooms, 155K sq ft retail, theaters, nightclubs, and beach club. |
| Encore Boston Harbor | Boston resort featuring 211K sq ft casino, 671 hotel rooms, 10K sq ft retail, nightclub, and waterfront park. |
Wynn Resorts generates most revenue from casino operations, supported by substantial hotel occupancy. Food, beverage, and entertainment offerings enhance guest experience. The company’s global footprint spans Macau, Las Vegas, and Boston, emphasizing luxury integrated resorts.
Main Competitors
There are 3 main competitors in the Gambling, Resorts & Casinos industry. Below is a table of the top 3 leaders by market capitalization:
| Competitor | Market Cap. |
|---|---|
| Las Vegas Sands Corp. | 44B |
| Wynn Resorts, Limited | 12.7B |
| MGM Resorts International | 10B |
Wynn Resorts ranks 2nd among its competitors with a market cap 24.4% the size of the leader, Las Vegas Sands. The company sits below both the average market cap of the top 10 peers (22.3B) and the sector median (12.7B). It holds a significant 310% market cap gap above its closest rival, MGM Resorts.
Comparisons with competitors
Check out how we compare the company to its competitors:
Does WYNN have a competitive advantage?
WYNN demonstrates a clear competitive advantage, evidenced by a very favorable moat status and a growing ROIC that exceeds its WACC by over 2%. This indicates efficient capital use and sustained value creation.
Looking ahead, WYNN’s integrated resorts across key locations like Las Vegas, Macau, and Boston present growth opportunities through diversified gaming operations and luxury amenities. Expansion in these markets supports continued profitability and competitive positioning.
SWOT Analysis
This analysis identifies Wynn Resorts’ internal strengths and weaknesses alongside external opportunities and threats.
Strengths
- strong integrated resort portfolio
- growing ROIC well above WACC
- diversified geographic presence
Weaknesses
- high debt-to-assets ratio (93%)
- negative return on equity (-31.7%)
- recent declines in net margin and EPS
Opportunities
- expanding Asian gaming market
- potential for new integrated resorts
- digital and online gaming expansion
Threats
- regulatory risks in Macau
- economic cyclicality impacts leisure spending
- intense competition in luxury casino segment
Wynn shows a robust competitive advantage with increasing profitability but carries financial leverage risks. The company must leverage growth opportunities while managing debt and external market pressures carefully.
Stock Price Action Analysis
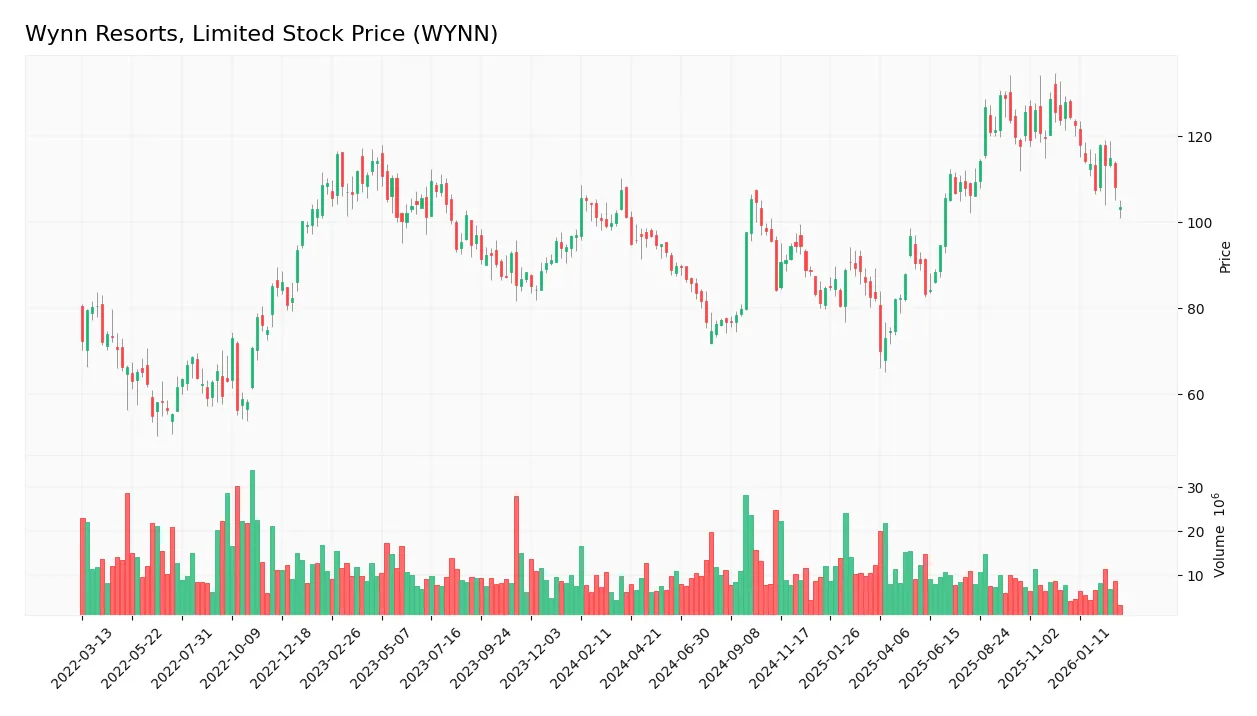
The weekly stock price chart for WYNN illustrates the price movement, highlighting key highs and lows over the past 12 months:
Trend Analysis
Over the past 12 months, WYNN’s stock price increased by 2.23%, indicating a bullish trend. The price has decelerated despite reaching a high of 129.52 and a low of 70.09. Volatility remains elevated, with a standard deviation of 16.26.
Volume Analysis
Trading volume shows a decreasing trend over the last three months. Sellers dominate with 54.6M shares versus 22.7M buyers, reflecting a seller-driven market. This decline in volume suggests waning investor participation and cautious sentiment.
Target Prices
Analysts set a clear target price range for Wynn Resorts, Limited, reflecting cautious optimism.
| Target Low | Target High | Consensus |
|---|---|---|
| 133 | 155 | 143.9 |
The consensus target price of 143.9 suggests moderate upside potential, indicating analyst confidence in the company’s recovery and growth prospects.

Don’t Let Luck Decide Your Entry Point
Optimize your entry points with our advanced ProRealTime indicators. You’ll get efficient buy signals with precise price targets for maximum performance. Start outperforming now!
Analyst & Consumer Opinions
This section reviews analyst ratings and consumer feedback on Wynn Resorts, Limited to gauge market and customer sentiment.
Stock Grades
Here are the latest verified analyst grades for Wynn Resorts, Limited from major financial institutions:
| Grading Company | Action | New Grade | Date |
|---|---|---|---|
| Morgan Stanley | Maintain | Overweight | 2026-02-25 |
| UBS | Maintain | Buy | 2026-02-23 |
| Mizuho | Maintain | Outperform | 2026-02-17 |
| Wells Fargo | Maintain | Overweight | 2026-02-13 |
| Stifel | Maintain | Buy | 2026-02-13 |
| Macquarie | Maintain | Outperform | 2026-02-13 |
| UBS | Maintain | Buy | 2026-01-16 |
| Morgan Stanley | Maintain | Overweight | 2026-01-16 |
| Barclays | Maintain | Overweight | 2026-01-16 |
| JP Morgan | Maintain | Overweight | 2025-12-08 |
The consensus clearly favors a positive outlook with consistent “Buy,” “Overweight,” and “Outperform” ratings. No downgrades or negative actions appeared, reflecting steady confidence in the stock.
Consumer Opinions
Wynn Resorts, Limited sparks strong reactions from its clientele, reflecting its premium positioning in the hospitality sector.
| Positive Reviews | Negative Reviews |
|---|---|
| “Exceptional service and luxurious rooms.” | “Prices are steep compared to competitors.” |
| “The casino atmosphere is vibrant and exciting.” | “Long wait times at restaurants frustrate guests.” |
| “Impeccably clean facilities and friendly staff.” | “Limited entertainment options outside gambling.” |
Overall, consumers praise Wynn’s luxury experience and customer service. However, many highlight high costs and occasional service delays as notable drawbacks.
Risk Analysis
Here is a concise overview of Wynn Resorts’ key risks, their probability, and potential impact:
| Category | Description | Probability | Impact |
|---|---|---|---|
| Financial Health | Altman Z-Score at 1.22 signals distress zone, implying heightened bankruptcy risk. | High | High |
| Leverage | Debt-to-assets ratio near 93% indicates heavy leverage and financial vulnerability. | High | High |
| Profitability | Negative ROE (-31.74%) and low net margin (4.59%) highlight weak earnings efficiency. | Medium | Medium |
| Interest Coverage | Coverage ratio at 1.85 suggests limited ability to meet interest obligations under stress. | Medium | Medium |
| Valuation | Elevated P/E of 38.12 and unfavorable price-to-book reflect potential overvaluation risk. | Medium | Medium |
| Industry Cyclicality | Gambling and resorts are highly cyclical, sensitive to economic downturns and regulatory shifts. | High | High |
The most pressing risks are Wynn’s financial distress signals and heavy leverage. The Altman Z-Score below 1.8 puts Wynn in the distress zone, raising bankruptcy concerns. Debt-to-assets at 93% is an alarmingly high level, limiting financial flexibility. Combined with a negative ROE and tight interest coverage, Wynn faces significant earnings and solvency challenges. The cyclical nature of the gambling sector compounds these risks amid economic uncertainties. Investors must weigh these vulnerabilities carefully against potential rewards.
Should You Buy Wynn Resorts, Limited?
Wynn Resorts appears to be creating value with a very favorable moat supported by growing profitability and ROIC well above WACC. Despite manageable operational efficiency, significant leverage and a distress-zone Altman Z-Score suggest caution. The overall rating is a cautious C-.
Strength & Efficiency Pillars
Wynn Resorts demonstrates operational efficiency with a gross margin of 32.73% and an EBIT margin of 16.21%. Despite neutral net margin at 4.59%, the company’s ROIC stands at 8.02%, exceeding its WACC of 6%, confirming Wynn as a value creator. This positive spread suggests Wynn generates returns above its cost of capital, supporting a sustainable competitive advantage with growing profitability over the 2021-2025 period.
Weaknesses and Drawbacks
Wynn is currently in financial distress, evidenced by a critically low Altman Z-Score of 1.22, signaling a high bankruptcy risk. The company also faces significant valuation and leverage concerns: a high P/E ratio of 38.12 implies an expensive equity valuation, while debt-to-assets at 92.89% exposes it to elevated financial risk. Moreover, recent seller dominance at 70.67% creates near-term market pressure and increases volatility.
Our Final Verdict about Wynn Resorts, Limited
Despite its operational strengths and value creation, Wynn’s distressed solvency profile, flagged by its Altman Z-Score, makes it a highly speculative investment. The solvency risk overshadows positive margins and growth trends. Investors seeking capital preservation might consider this profile too risky, as the risk of bankruptcy remains a clear red flag.
Disclaimer: This content is for informational purposes only and does not constitute financial, investment, or other professional advice. Investing in financial markets involves a significant risk of loss, and past performance is not indicative of future results.
Additional Resources
- Decoding Wynn Resorts Ltd (WYNN): A Strategic SWOT Insight – GuruFocus (Mar 03, 2026)
- Wynn Resorts (NASDAQ: WYNN) outlines global casinos, UAE project and risks – Stock Titan (Mar 02, 2026)
- Wynn Resorts Ltd. stock underperforms Monday when compared to competitors – MarketWatch (Mar 02, 2026)
- Wynn Resorts is on watch after the UAE is targeted by Iran (WYNN:NASDAQ) – Seeking Alpha (Mar 02, 2026)
- Wynn Macau Flags Parent Wynn Resorts’ 2025 Annual Report and Accounting Gap – TipRanks (Mar 02, 2026)
For more information about Wynn Resorts, Limited, please visit the official website: wynnresorts.com