Home > Analyses > Technology > Workday, Inc.
Workday, Inc. transforms how organizations manage their most vital resources—people and finances—through cloud-based innovation. Its flagship human capital management and financial planning applications set industry standards, driving operational efficiency and strategic insight for thousands of enterprises worldwide. Known for seamless integration and cutting-edge analytics, Workday shapes the future of enterprise software. As competition intensifies and valuation multiples fluctuate, I ask: does Workday’s robust growth and market position still justify its premium price?

Table of contents
Business Model & Company Overview
Workday, Inc. is a leading provider of enterprise cloud applications, headquartered in Pleasanton, California. Founded in 2005, it has built a cohesive ecosystem that integrates financial management, human capital management, and analytics into a unified platform. The company dominates the software application sector by enabling businesses to streamline operations and gain actionable insights across multiple industries worldwide.
Workday’s revenue engine hinges on its mix of subscription-based cloud software and recurring services, balancing innovation with steady cash flow. It serves diverse markets across the Americas, Europe, and Asia, leveraging machine learning and augmented analytics to enhance customer value. Its robust economic moat stems from deep integration within clients’ operations and continuous expansion of its digital ecosystem.
Financial Performance & Fundamental Metrics
I analyze Workday, Inc.’s income statement, key financial ratios, and dividend payout policy to assess its operational efficiency and shareholder returns.
Income Statement
The table below summarizes Workday, Inc.’s key income statement metrics over the past five fiscal years, providing a clear view of revenue, profitability, and earnings per share trends.

| 2022 | 2023 | 2024 | 2025 | 2026 | |
|---|---|---|---|---|---|
| Revenue | 5.14B | 6.22B | 7.26B | 8.45B | 9.55B |
| Cost of Revenue | 1.43B | 1.71B | 1.77B | 2.07B | 2.32B |
| Operating Expenses | 3.83B | 4.73B | 5.31B | 5.96B | 6.21B |
| Gross Profit | 3.71B | 4.51B | 5.49B | 6.38B | 7.23B |
| EBITDA | 377M | 206M | 752M | 1.08B | 1.36B |
| EBIT | 33M | -158M | 470M | 752M | 1.01B |
| Interest Expense | 17M | 102M | 114M | 114M | 114M |
| Net Income | 29M | -367M | 1.38B | 526M | 693M |
| EPS | 0.12 | -1.44 | 5.28 | 1.98 | 2.60 |
| Filing Date | 2022-02-28 | 2023-02-27 | 2024-03-08 | 2025-03-11 | 2026-03-06 |
Income Statement Evolution
Workday, Inc. delivered strong revenue growth, rising 13% in the last year and nearly 86% over five years. Gross profit expanded proportionally, maintaining a robust 75.7% gross margin. Operating expenses grew in line with revenue, supporting a notable 34% EBIT increase. Net income surged 16% last year, with margins improving steadily throughout the period.
Is the Income Statement Favorable?
In 2026, Workday posted $9.55B revenue and $693M net income, reflecting a 7.3% net margin. EBIT margin stood at a healthy 10.6%, supported by controlled interest expense at 1.2% of revenue. The company’s fundamentals appear favorable, with consistent margin enhancements and strong EPS growth signaling effective cost management and profitable scaling.
Financial Ratios
Below is a summary of key financial ratios for Workday, Inc. over the last five fiscal years:
| Ratios | 2022 | 2023 | 2024 | 2025 | 2026 |
|---|---|---|---|---|---|
| Net Margin | 0.6% | -5.9% | 19.0% | 6.2% | 7.3% |
| ROE | 0.6% | -6.6% | 17.1% | 5.8% | 8.9% |
| ROIC | -1.7% | -2.5% | 1.6% | 2.7% | 5.9% |
| P/E | 2157 | -126 | 55 | 132 | 66 |
| P/B | 13.8 | 8.3 | 9.4 | 7.7 | 5.9 |
| Current Ratio | 1.0 | 1.7 | 1.9 | 1.9 | 1.3 |
| Quick Ratio | 1.0 | 1.7 | 1.9 | 1.9 | 1.3 |
| D/E | 0.46 | 0.58 | 0.41 | 0.37 | 0.49 |
| Debt-to-Assets | 20.0% | 24.1% | 20.0% | 18.7% | 21.1% |
| Interest Coverage | -6.8 | -2.2 | 1.6 | 3.6 | 9.0 |
| Asset Turnover | 0.49 | 0.46 | 0.44 | 0.47 | 0.53 |
| Fixed Asset Turnover | 3.7 | 4.3 | 4.8 | 5.4 | 5.3 |
| Dividend Yield | 0% | 0% | 0% | 0% | 0% |
Evolution of Financial Ratios
Workday’s Return on Equity (ROE) showed improvement from negative in 2023 to 8.88% in 2026, though still below ideal benchmarks. The Current Ratio declined from 1.92 in 2024 to 1.32 in 2026, indicating reduced short-term liquidity. Debt-to-Equity ratio improved to 0.49, reflecting more conservative leverage and enhanced financial stability.
Are the Financial Ratios Favorable?
In 2026, profitability ratios like net margin (7.26%) and ROIC (5.95%) remain neutral, while ROE at 8.88% is unfavorable versus the weighted average cost of capital (8.64%). Liquidity is stable with a current ratio of 1.32 and a favorable quick ratio of 1.32. Leverage metrics, including debt-to-equity (0.49) and debt-to-assets (21.14%), are favorable. Market valuation ratios such as P/E (66.22) and P/B (5.88) are high, suggesting valuation risk. Overall, ratios are slightly favorable with a balanced risk profile.
Shareholder Return Policy
Workday, Inc. does not pay dividends, reflecting a reinvestment strategy common in growth-oriented tech firms. The company prioritizes expanding operations and R&D, supported by positive net income and robust free cash flow, while engaging in share buybacks to return capital.
This approach aligns with long-term shareholder value creation, focusing on growth over immediate income. Share buybacks may enhance returns, but investors should monitor buyback scale relative to cash flow to avoid potential financial strain.
Score analysis
The radar chart below illustrates Workday, Inc.’s key financial scores across valuation, profitability, and leverage metrics:

Workday achieves favorable scores in discounted cash flow, return on equity, and return on assets, signaling solid profitability and valuation fundamentals. However, its debt-to-equity, price-to-earnings, and price-to-book scores remain weak, indicating valuation concerns and leverage risks.
Analysis of the company’s bankruptcy risk
Workday’s Altman Z-Score places it comfortably in the safe zone, suggesting a low risk of bankruptcy and financial distress:

Is the company in good financial health?
The Piotroski diagram presents Workday’s financial strength based on nine key criteria:

With a strong Piotroski Score of 7, Workday demonstrates robust financial health, reflecting solid profitability, liquidity, and operational efficiency for investors to consider.
Competitive Landscape & Sector Positioning
This sector analysis examines Workday, Inc.’s strategic positioning, revenue segments, key products, competitors, and strengths. I will assess whether Workday holds a competitive advantage over its peers.
Strategic Positioning
Workday concentrates on subscription services, which grew to $28.1B in 2026, dwarfing $719M in professional services. It diversifies geographically with $7.2B U.S. and $2.4B non-U.S. revenue, reflecting a strong domestic base alongside expanding international reach.
Revenue by Segment
This pie chart illustrates Workday, Inc.’s revenue breakdown by segment for fiscal year 2026, highlighting the proportion between Subscription Services and Professional Services.

Subscription Services dominate Workday’s revenue at $28.1B in 2026, reflecting explosive growth from $7.7B in 2025. Professional Services remain stable near $719M. The surge in subscription revenue signals strong market adoption and recurring income, but the heavy concentration in one segment poses a concentration risk worth monitoring closely.
Key Products & Brands
This table summarizes Workday’s main products and brands along with their core functionalities and market focus:
| Product | Description |
|---|---|
| Subscription Services | Enterprise cloud applications including financial management, human capital management, planning, analytics, and reporting solutions. |
| Professional Services | Consulting and implementation services that support the deployment and optimization of Workday’s cloud applications. |
Workday’s offerings center on cloud-based enterprise software, with subscription services driving the majority of revenue. Professional services complement product sales by enabling effective adoption and tailored solutions.
Main Competitors
Workday, Inc. faces competition from 33 companies in the sector, with the table below listing the top 10 leaders by market capitalization:
| Competitor | Market Cap. |
|---|---|
| Salesforce, Inc. | 242B |
| Shopify Inc. | 210B |
| AppLovin Corporation | 209B |
| Intuit Inc. | 175B |
| Uber Technologies, Inc. | 172B |
| ServiceNow, Inc. | 153B |
| Cadence Design Systems, Inc. | 84.5B |
| Snowflake Inc. | 73.4B |
| Autodesk, Inc. | 61.2B |
| Workday, Inc. | 54.9B |
Workday ranks 10th among its competitors, holding about 16.6% of the market cap of the sector leader, Salesforce. It stands below the average market cap of the top 10 by a significant margin but remains above the sector median, reflecting a solid mid-tier position. Workday enjoys a 51.8% market cap advantage over its closest higher-ranked competitor, Autodesk.
Comparisons with competitors
Check out how we compare the company to its competitors:
Does Workday have a competitive advantage?
Workday currently faces a competitive challenge, as its ROIC falls below WACC, indicating value destruction despite growing profitability. This signals an inability to generate returns above its cost of capital in recent years.
Looking ahead, Workday’s expanding product suite in cloud financial and human capital management, plus growth in non-US markets, offers opportunities to improve operational efficiency and capture new client segments.
SWOT Analysis
This SWOT analysis distills Workday, Inc.’s core strategic factors to guide investment decisions.
Strengths
- strong revenue growth (13% YoY)
- robust gross margin (75.7%)
- diversified cloud application suite
Weaknesses
- high valuation metrics (PE 66, PB 5.9)
- ROIC below WACC indicating value destruction
- moderate ROE (8.9%) limiting equity returns
Opportunities
- expanding international market (Non-US revenue growth)
- rising demand for cloud financial and HCM solutions
- AI and machine learning integration to enhance offerings
Threats
- intense competition in enterprise software
- macroeconomic volatility impacting IT budgets
- execution risk in scaling global operations
Workday shows healthy growth and strong market positioning but trades at rich multiples with value destruction concerns. Strategic focus should be on improving capital efficiency while leveraging global expansion and AI to sustain growth.
Stock Price Action Analysis
The weekly stock chart below illustrates Workday, Inc.’s price movement over the past 12 months, highlighting key highs, lows, and volatility patterns:
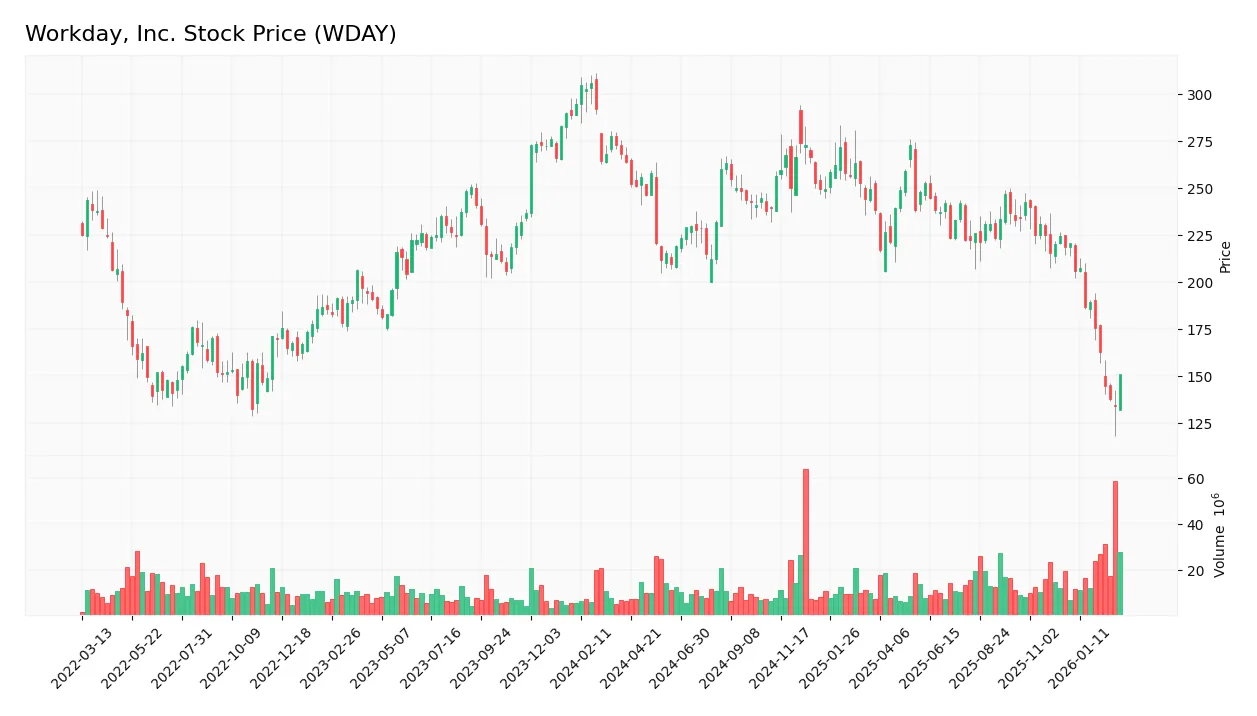
Trend Analysis
Over the past 12 months, WDAY’s stock price declined sharply by 42.72%, confirming a bearish trend with deceleration in downtrend momentum. The stock’s high reached 273.67, while the low hit 133.76, reflecting elevated volatility with a standard deviation of 27.71%.
Volume Analysis
Trading volume increased overall, but sellers dominated with 57.73% of total volume over 12 months. Recent three-month data show seller dominance intensified, with buyers accounting for only 22.03% of volume, indicating weaker buyer interest and increased selling pressure.
Target Prices
Analysts set a consensus target price reflecting cautious optimism for Workday, Inc.
| Target Low | Target High | Consensus |
|---|---|---|
| 125 | 298 | 205.38 |
The target range from 125 to 298 shows diverse expectations, but the consensus near 205 suggests moderate upside potential.

Don’t Let Luck Decide Your Entry Point
Optimize your entry points with our advanced ProRealTime indicators. You’ll get efficient buy signals with precise price targets for maximum performance. Start outperforming now!
Analyst & Consumer Opinions
This section examines recent analyst ratings and consumer feedback to provide a comprehensive view of Workday, Inc. (WDAY).
Stock Grades
Here are the latest verified stock grades for Workday, Inc. from recognized financial institutions:
| Grading Company | Action | New Grade | Date |
|---|---|---|---|
| Citigroup | Maintain | Neutral | 2026-02-26 |
| Rosenblatt | Maintain | Buy | 2026-02-25 |
| Guggenheim | Maintain | Buy | 2026-02-25 |
| Bernstein | Maintain | Outperform | 2026-02-25 |
| Mizuho | Maintain | Outperform | 2026-02-25 |
| Wells Fargo | Maintain | Overweight | 2026-02-25 |
| Cantor Fitzgerald | Maintain | Overweight | 2026-02-25 |
| Oppenheimer | Maintain | Outperform | 2026-02-25 |
| Piper Sandler | Maintain | Neutral | 2026-02-25 |
| Goldman Sachs | Maintain | Neutral | 2026-02-25 |
Most firms maintain positive stances, with a consensus leaning toward Outperform and Buy grades. Neutral ratings from several major banks suggest cautious optimism without aggressive bullishness.
Consumer Opinions
Workday, Inc. enjoys a generally favorable reputation among its users, reflecting strong satisfaction with its product suite.
| Positive Reviews | Negative Reviews |
|---|---|
| Intuitive interface simplifies complex HR processes. | Customer support response times can be slow. |
| Robust analytics provide valuable workforce insights. | Pricing may be high for smaller businesses. |
| Frequent updates improve features and usability. | Some users face occasional integration challenges. |
Overall, consumers praise Workday’s user-friendly design and powerful analytics. However, concerns around support speed and cost persist, especially for smaller clients.
Risk Analysis
Below is a summary table of key risks facing Workday, Inc., including their likelihood and potential impact:
| Category | Description | Probability | Impact |
|---|---|---|---|
| Valuation Risk | High P/E of 66.22 and P/B of 5.88 indicate stretched valuation, risking price correction. | High | High |
| Profitability | ROE at 8.88% lags behind WACC at 8.64%, signaling weak capital efficiency and shareholder value. | Medium | Medium |
| Debt Levels | Moderate debt-to-equity ratio of 0.49 is favorable, but any leverage increase could strain finances. | Low | Medium |
| Market Volatility | Beta of 1.167 suggests stock price is more volatile than the market, increasing investor risk. | Medium | Medium |
| Competition | Intense software sector competition may pressure margins and growth prospects. | High | High |
| Liquidity | Current ratio at 1.32 is adequate but not a strong buffer against short-term shocks. | Medium | Low |
| Dividend Policy | No dividend yield may deter income-focused investors, limiting shareholder return options. | Low | Low |
The most pressing risks are the lofty valuation multiples and fierce competitive environment. Workday’s premium pricing reflects growth expectations that may falter if execution stalls or market conditions worsen. Despite a solid Altman Z-Score of 3.18 in the safe zone, the moderate ROE below WACC highlights capital allocation concerns. Investors should weigh these risks carefully amid broader tech sector volatility in 2026.
Should You Buy Workday, Inc.?
Workday, Inc. appears to be improving operational efficiency with growing profitability despite a slightly unfavorable moat indicating value destruction. Its leverage profile is moderate but manageable. The overall rating of B suggests a very favorable financial health profile, tempered by valuation risks.
Strength & Efficiency Pillars
Workday, Inc. operates with solid operational efficiency, boasting a gross margin of 75.7% and an EBIT margin of 10.56%. Despite a moderate ROIC of 5.95%, it falls short of the WACC at 8.64%, indicating the company is currently shedding value rather than creating it. However, net margin growth of 16.49% and a strong Piotroski score of 7 reflect improving profitability and financial strength. The Altman Z-Score of 3.18 places Workday safely outside distress territory, underscoring sound solvency.
Weaknesses and Drawbacks
Workday faces notable valuation pressures with a high P/E ratio of 66.22 and a P/B of 5.88, suggesting an expensive stock relative to earnings and book value. These multiples may limit upside and imply market expectations are elevated. The current ratio of 1.32 is neutral, but debt-to-equity at 0.49 is favorable, mitigating leverage concerns. However, recent market activity shows seller dominance at 77.97%, indicating significant short-term selling pressure and heightened volatility risk.
Our Final Verdict about Workday, Inc.
Workday’s financial health is fundamentally stable, supported by a strong Z-Score and improving profitability metrics. Yet, its valuation appears stretched, and recent technical weakness due to seller dominance suggests a cautious stance. Despite long-term operational improvements, the current market dynamics may warrant a wait-and-see approach before considering a position. The profile may appear attractive for investors with a tolerance for elevated valuation risk.
Disclaimer: This content is for informational purposes only and does not constitute financial, investment, or other professional advice. Investing in financial markets involves a significant risk of loss, and past performance is not indicative of future results.
Additional Resources
- Clarkston Capital Partners LLC Buys New Shares in Workday, Inc. $WDAY – MarketBeat (Mar 09, 2026)
- Workday, Inc. (WDAY) Price Target Lowered to $148 at Citi – Yahoo Finance (Mar 06, 2026)
- Workday Announces Fiscal 2026 Fourth Quarter and Full Year Financial Results – Workday (Feb 24, 2026)
- Orion Porfolio Solutions LLC Has $4.22 Million Stock Holdings in Workday, Inc. $WDAY – MarketBeat (Mar 09, 2026)
- Decoding Workday Inc (WDAY): A Strategic SWOT Insight – GuruFocus (Mar 07, 2026)
For more information about Workday, Inc., please visit the official website: workday.com