WK Kellogg Co transforms morning routines across North America with iconic cereal brands like Frosted Flakes, Special K, and Froot Loops, shaping consumer tastes and convenience. As a key player in the packaged foods sector, Kellogg combines heritage with innovation to maintain strong market influence and brand loyalty. As the company navigates evolving consumer preferences and competitive pressures, I explore whether its current fundamentals support continued growth and justify its market valuation in 2026.
Table of contents
Company Description
WK Kellogg Co, founded in 2022 and headquartered in Battle Creek, Michigan, is a prominent player in the packaged foods industry. Operating mainly in the United States, Canada, and the Caribbean, it specializes in ready-to-eat cereals with well-known brands like Frosted Flakes, Special K, and Froot Loops. The company focuses on consumer staples, offering a portfolio that emphasizes convenience and nutrition. As a relatively new independent entity since its 2023 IPO, WK Kellogg Co leverages its strong brand legacy to maintain a leading position and drive innovation in the cereal market.
Fundamental Analysis
In this section, I will analyze WK Kellogg Co’s income statement, key financial ratios, and dividend payout policy to provide a comprehensive fundamental overview.
Income Statement
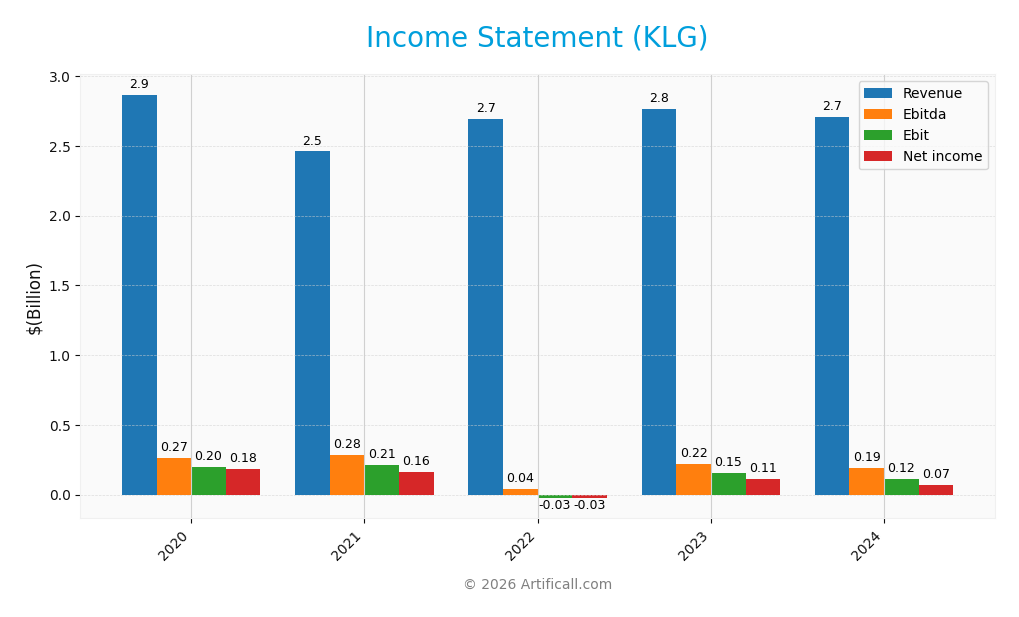
The table below summarizes WK Kellogg Co’s key income statement figures for the fiscal years 2020 through 2024, reflecting revenue, expenses, profitability, and earnings per share.
| 2020 | 2021 | 2022 | 2023 | 2024 | |
|---|---|---|---|---|---|
| Revenue | 2.87B | 2.46B | 2.70B | 2.76B | 2.71B |
| Cost of Revenue | 2.03B | 1.88B | 2.03B | 2.01B | 1.92B |
| Operating Expenses | 639M | 539M | 556M | 662M | 684M |
| Gross Profit | 835M | 576M | 633M | 754M | 793M |
| EBITDA | 265M | 283M | 42M | 221M | 193M |
| EBIT | 196M | 215M | -26M | 155M | 115M |
| Interest Expense | 0 | 0 | 37M | 10M | 30M |
| Net Income | 182M | 162M | -25M | 110M | 72M |
| EPS | 2.12 | 1.89 | -0.29 | 1.28 | 0.84 |
| Filing Date | 2020-12-31 | 2021-12-31 | 2022-12-31 | 2024-03-08 | 2025-02-25 |
Income Statement Evolution
From 2020 to 2024, WK Kellogg Co’s revenue declined by 5.55%, with a 1.99% drop in the last year alone. Despite this, gross profit rose 5.17% in 2024, improving gross margin to a favorable 29.28%. However, EBIT and net income margins weakened notably, with EBIT margin neutral at 4.25% and net margin at 2.66%, both reflecting margin pressure over the period.
Is the Income Statement Favorable?
The 2024 income statement reveals disappointing fundamentals: revenue and net income fell year-over-year by 1.99% and 33.22%, respectively. EBIT declined sharply by 25.81%, while EPS dropped 35.16%, signaling earnings contraction. Interest expense remains low and favorable at 1.11% of revenue, but overall margin deterioration and negative growth trends lead to a generally unfavorable income statement assessment.
Financial Ratios
The table below presents key financial ratios for WK Kellogg Co (ticker: KLG) over the fiscal years 2020 to 2024, reflecting profitability, valuation, liquidity, leverage, efficiency, and dividend metrics.
| Ratios | 2020 | 2021 | 2022 | 2023 | 2024 |
|---|---|---|---|---|---|
| Net Margin | 6.3% | 6.6% | -0.9% | 4.0% | 2.7% |
| ROE | 36.8% | 28.4% | -3.6% | 36.7% | 22.7% |
| ROIC | 24.8% | 4.1% | 9.3% | 6.5% | 7.6% |
| P/E | 8.0 | 9.0 | -58.4 | 10.3 | 21.5 |
| P/B | 3.0 | 2.6 | 2.1 | 3.8 | 4.9 |
| Current Ratio | 0.76 | 0.89 | 1.01 | 0.84 | 0.74 |
| Quick Ratio | 0.34 | 0.31 | 0.36 | 0.43 | 0.32 |
| D/E | 0.0 | 0.02 | 0.01 | 1.66 | 2.04 |
| Debt-to-Assets | 0.0 | 0.01 | 0.01 | 0.26 | 0.33 |
| Interest Coverage | 0 | 0 | 2.0 | 9.2 | 3.6 |
| Asset Turnover | 2.28 | 1.98 | 1.88 | 1.46 | 1.38 |
| Fixed Asset Turnover | 4.51 | 3.92 | 4.13 | 3.74 | 3.01 |
| Dividend Yield | 0% | 0% | 0% | 59.9% | 3.6% |
Evolution of Financial Ratios
From 2020 to 2024, WK Kellogg Co’s Return on Equity (ROE) showed variability, peaking above 36% in 2020 and 2023, but dropping to around 23% in 2024. The Current Ratio fluctuated below 1.1, indicating consistent liquidity challenges. Debt-to-Equity Ratio escalated sharply in 2024, reaching 2.04 from near zero in earlier years, reflecting increased leverage. Profitability margins like net profit margin declined in 2024 to 2.66%, showing reduced profitability stability.
Are the Financial Ratios Favorable?
In 2024, profitability ratios such as net profit margin (2.66%) and ROE (22.7%) suggest moderate returns, though below previous peaks. Liquidity ratios remain weak, with a current ratio of 0.74 and quick ratio near 0.32, indicating limited short-term asset coverage. Leverage is elevated, with a debt-to-equity ratio above 2 and a financial leverage ratio exceeding 6, implying higher financial risk. Market valuation ratios show a high price-to-book ratio of 4.88 and price-to-earnings around 21.5, indicating market premium but with caution due to mixed cash flow yields.
Shareholder Return Policy
WK Kellogg Co maintains a dividend payout ratio near 76%, with a dividend per share of $0.64 and a yield of approximately 3.55% in 2024. Despite negative free cash flow per share, the company supports distributions partly through share buybacks, balancing payout with capital expenditures.
The payout level is relatively high compared to free cash flow generation, which may pose sustainability risks if cash flow does not improve. However, consistent dividends combined with buybacks suggest a focus on returning value, though close monitoring of cash flow coverage is warranted for long-term shareholder value.
Sector Analysis
This section presents an overview of WK Kellogg Co’s position within the packaged foods sector, covering strategic positioning, revenue by segment, key products, main competitors, competitive advantages, and a SWOT analysis. I will also assess whether WK Kellogg Co holds a competitive advantage over its industry peers.
Strategic Positioning
WK Kellogg Co maintains a concentrated geographic exposure focused on the United States and Canada, generating over 90% of its revenue from these markets. Its product portfolio centers on ready-to-eat cereals under established brands like Frosted Flakes and Special K, reflecting a focused strategy within the packaged foods industry.
Key Products & Brands
The table below outlines WK Kellogg Co’s primary products and associated brands:
| Product | Description |
|---|---|
| Frosted Flakes | A ready-to-eat cereal brand known for its sweetened corn flakes. |
| Special K | A cereal brand marketed for health-conscious consumers focusing on balanced nutrition. |
| Froot Loops | A colorful, fruit-flavored ready-to-eat cereal targeted primarily at children. |
| Raisin Bran | A cereal combining bran flakes with raisins, emphasizing fiber and taste. |
| Frosted Mini-Wheats | Bite-sized shredded wheat cereal pieces coated with frosting, offering fiber-rich nutrition. |
| Kashi | A brand focused on natural and organic cereals and snacks, appealing to health-focused consumers. |
WK Kellogg Co offers a diverse portfolio of ready-to-eat cereals, covering a range of consumer preferences from indulgent to health-oriented options, primarily distributed across the US, Canada, and the Caribbean.
Main Competitors
Below is a table of the main competitors in the packaged foods industry for WK Kellogg Co:
| Competitor | Market Cap. |
|---|---|
| Industrias Bachoco, S.A.B. de C.V. | 2.65B |
| Vector Group Ltd. | 2.36B |
| Sovos Brands, Inc. | 2.34B |
| The Duckhorn Portfolio, Inc. | 1.63B |
| WK Kellogg Co | 1.99B |
| Thorne HealthTech, Inc. | 551M |
| Mama’s Creations, Inc. | 514M |
| Whole Earth Brands, Inc. | 212M |
| China Xiangtai Food Co., Ltd. | 116M |
| YanGuFang International Group Co., Ltd. | 23M |
The largest competitors in this group are Industrias Bachoco, Vector Group, and Sovos Brands, each with market caps exceeding 2B, while WK Kellogg Co holds a strong mid-range position with nearly 2B in market capitalization.
Does KLG have a competitive advantage?
WK Kellogg Co benefits from a strong brand portfolio in ready-to-eat cereals, including well-known names like Frosted Flakes and Special K, with a significant presence in the US and Canada. Its favorable gross margin of 29.28% and low interest expense of 1.11% support operational efficiency despite recent declines in revenue and net income.
Looking ahead, KLG may explore opportunities to innovate within its established markets and diversify product offerings to counteract recent unfavorable growth trends. Expansion in adjacent regions such as the Caribbean and potential new products could help capture emerging consumer demand and improve profitability.
SWOT Analysis
This analysis highlights the key internal and external factors affecting WK Kellogg Co to support informed investment decisions.
Strengths
- Strong brand portfolio with iconic cereal products
- Favorable gross margin at 29.28%
- Low interest expense at 1.11%
Weaknesses
- Declining revenue trend with -1.99% in 1 year
- Negative net income and EPS growth over 5 years
- Negative working capital of -7M USD
Opportunities
- Expansion in emerging markets beyond US and Canada
- Innovation in health-conscious and convenient foods
- Strategic cost management to improve EBIT margin
Threats
- Intense competition in packaged foods sector
- Consumer shift to fresh and natural alternatives
- Economic downturn impacting consumer spending
Overall, WK Kellogg Co’s strong brand and margin profile provide a solid foundation, but persistent revenue and profitability declines require strategic focus on innovation and market expansion to mitigate competitive and macroeconomic risks.
Stock Analysis
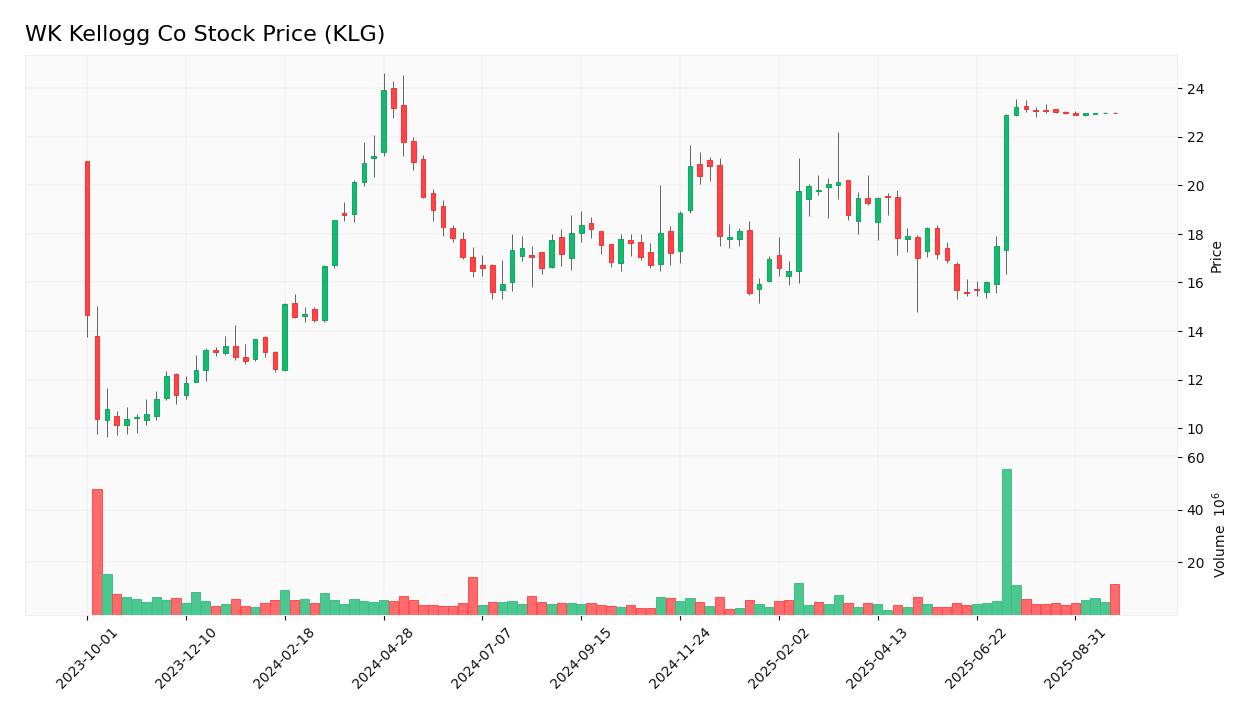
The weekly stock price chart for WK Kellogg Co (KLG) reveals a significant upward move over the past year, with notable price acceleration followed by a recent deceleration phase, indicating evolving trading dynamics and investor sentiment.
Trend Analysis
Over the past 12 months, KLG’s stock price surged by 119.68%, reflecting a strong bullish trend. The price range extended from a low of 10.47 to a high of 23.94. Despite this overall rise, recent data from July to September 2025 shows a neutral trend with a minimal 0.48% increase and slight deceleration.
Volume Analysis
Trading volume over the last three months shows a strongly buyer-dominant pattern, with buyers accounting for 75.73% of activity. However, total volume is decreasing, suggesting cautious investor participation despite prevailing optimism. This may indicate selective buying amid uncertainty.
Target Prices
Analysts show a clear consensus on WK Kellogg Co’s target price.
| Target High | Target Low | Consensus |
|---|---|---|
| 23 | 23 | 23 |
The uniform target price of $23 reflects a strong agreement among analysts on WK Kellogg Co’s near-term valuation expectations.
Analyst Opinions
Recent analyst reports on WK Kellogg Co (KLG) show a mixed but cautiously optimistic stance. Morgan Stanley rates it as a Buy, highlighting strong brand loyalty and steady cash flow. Meanwhile, Barclays suggests Hold due to rising input costs impacting margins. JP Morgan remains neutral but sees potential upside if cost controls improve. The consensus for 2026 leans slightly toward Buy, reflecting confidence in Kellogg’s resilience amid market challenges.
Stock Grades
Here is an overview of the recent stock ratings for WK Kellogg Co (KLG) from recognized and reliable grading companies.
| Grading Company | Action | New Grade | Date |
|---|---|---|---|
| TD Cowen | Upgrade | Hold | 2025-07-14 |
| Barclays | Maintain | Underweight | 2025-07-14 |
| Evercore ISI Group | Maintain | In Line | 2025-07-11 |
| Jefferies | Maintain | Hold | 2025-01-28 |
| Stifel | Maintain | Hold | 2025-01-24 |
| Barclays | Maintain | Underweight | 2025-01-17 |
| TD Cowen | Downgrade | Sell | 2025-01-08 |
| Barclays | Maintain | Underweight | 2024-11-11 |
| JP Morgan | Maintain | Neutral | 2024-08-07 |
| Stifel | Maintain | Hold | 2024-07-23 |
Overall, the stock grades for WK Kellogg Co reveal a cautious stance among analysts. The most recent upgrade by TD Cowen to a Hold rating contrasts with previous downgrades and mostly stable Hold or Underweight assessments from other firms. This pattern indicates a neutral to slightly negative sentiment, suggesting investors should weigh potential risks carefully before adding KLG shares to their portfolios.
Consumer Opinions
Consumers of WK Kellogg Co (KLG) express a mix of appreciation and constructive criticism, reflecting diverse experiences with the brand’s products and services.
| Positive Reviews | Negative Reviews |
|---|---|
| “Consistently high-quality cereals that my family loves.” | “Some products have increased in price recently.” |
| “Great variety of healthy and tasty options.” | “Packaging could be more environmentally friendly.” |
| “Reliable availability in stores and good customer service.” | “Occasional inconsistency in flavor across batches.” |
Overall, customers praise WK Kellogg Co for its product quality and variety but note concerns about pricing and packaging sustainability. These insights suggest opportunities for the company to enhance consumer satisfaction further.
Risk Analysis
The table below summarizes key risks associated with WK Kellogg Co (ticker: KLG), highlighting their category, description, probability, and potential impact on the company’s performance.
| Category | Description | Probability | Impact |
|---|---|---|---|
| Financial Risk | High leverage with debt-to-equity ratio above 2.0 increases financial risk. | Medium | High |
| Liquidity Risk | Current ratio below 1 (0.74 in 2024) indicates potential short-term liquidity issues. | Medium | Medium |
| Market Risk | Beta of 0.69 suggests moderate sensitivity to market volatility. | Medium | Medium |
| Operational Risk | Dependence on key cereal brands and concentrated geographic markets. | Medium | Medium |
| Profitability Risk | Declining net profit margin from 3.98% in 2023 to 2.66% in 2024. | High | High |
| Dividend Risk | Dividend payout ratio at 76% may limit reinvestment and financial flexibility. | Medium | Medium |
| Economic Risk | Exposure to inflation and commodity price fluctuations affecting input costs. | High | High |
The most significant risks for WK Kellogg Co stem from its moderate financial leverage and declining profitability margins, which could constrain growth and shareholder returns. Recent financials show a drop in net profit margin to 2.66% in 2024 and a debt-to-equity ratio exceeding 2, signaling elevated financial risk. Investors should monitor liquidity and cost pressures closely to manage potential downside.
Should You Buy WK Kellogg Co?
WK Kellogg Co shows moderate profitability with a net profit margin of 2.66% in 2024 and a positive ROIC of 7.61% exceeding its WACC, indicating value creation. The company carries a significant debt load with a debt-to-equity ratio of 2.04 and a debt-to-capital ratio of 67.15%. Its interest coverage ratio stands at 3.63, reflecting manageable debt servicing. The financial metrics might suggest a cautious approach given the leverage.
Favorable signals
The company shows a favorable gross margin of 29.28% and a favorable interest expense ratio of 1.11%, indicating efficient cost control on debt. Additionally, there is a positive growth in gross profit by 5.17% over the last year. The recent trading volume indicates a strongly buyer-dominant behavior with buyer volume significantly exceeding seller volume, which suggests investor interest and confidence in the stock.
Unfavorable signals
Despite some positive points, WK Kellogg Co faces multiple unfavorable trends. Revenue has declined by 1.99% in the past year and by 5.55% over the overall period. Operating expenses relative to revenue also decreased by 1.99%, which might indicate cost issues. EBIT and net margin both experienced steep declines of 25.81% and 33.22% respectively in the last year. The overall net income and EPS have dropped dramatically by over 60% over the period, leading to an overall unfavorable income statement evaluation. The recent price trend shows a slight negative slope of -0.01 over the last months, indicating some weakening momentum despite the long-term bullish trend.
Conclusion
Although WK Kellogg Co benefits from a favorable gross margin and controlled interest expenses, the company’s income statement reflects significant declines in profitability and growth metrics, which weighs heavily against the positive signals. The long-term bullish price trend combined with strong buyer dominance could imply renewed investor interest, but the unfavorable income statement might suggest it would be more prudent to wait for clearer signs of financial recovery before considering a long-term position.
Disclaimer: This article is not financial advice. Each investor is responsible for their own investment decisions.
Additional Resources
- FERRERO TO ACQUIRE WK KELLOGG CO – Ferrero (Jul 10, 2025)
- Ferrero Acquires WK Kellogg Co (KLG) Co for $3.1 Billion – Yahoo Finance (Jul 28, 2025)
- WK Kellogg Co Announces Second Quarter Financial Results – WK Kellogg Co (Aug 07, 2025)
- Ferrero completes acquisition of WK Kellogg Co, shareholders to receive $23 per share – WWMT (Sep 26, 2025)
- WK Kellogg Co Launches New K-12 Innovations to Support Student Nutrition and Wellbeing – PR Newswire (Nov 06, 2025)
For more information about WK Kellogg Co, please visit the official website: unleashingourpotential.com/en/wk-kellogg-co