Home > Analyses > Technology > Wix.com Ltd.
Wix.com Ltd. transforms how millions design and manage their online presence, making website creation accessible and intuitive worldwide. As a trailblazer in the software infrastructure sector, Wix leads with innovative tools like its drag-and-drop Editor, AI-powered Logo Maker, and comprehensive business solutions that empower entrepreneurs and enterprises alike. Renowned for its dynamic platform and expansive user base, Wix stands at a critical juncture—does its current valuation fully capture the growth opportunities ahead, or are risks emerging that investors should heed?

Table of contents
Business Model & Company Overview
Wix.com Ltd., founded in 2006 and headquartered in Tel Aviv, Israel, stands as a dominant player in the software infrastructure industry. The company operates a cloud-based platform designed to empower users worldwide—across North America, Europe, Latin America, and Asia—to easily create websites and web applications. Its ecosystem integrates intuitive tools like the Wix Editor, AI-driven Wix ADI, and customizable Corvid development, all aimed at simplifying digital presence creation for millions.
Wix’s revenue engine balances a robust mix of subscription-based services and complementary applications. With over 222M registered users and 6M premium subscribers, its recurring revenue stems from premium plans, app market offerings, and payment solutions such as Wix Payments. Strategic international reach and a diversified product suite underpin Wix’s competitive advantage, positioning it to shape the future of online business infrastructure.
Financial Performance & Fundamental Metrics
In this section, I analyze Wix.com Ltd.’s income statement, key financial ratios, and dividend payout policy to assess its overall financial health and investment potential.
Income Statement
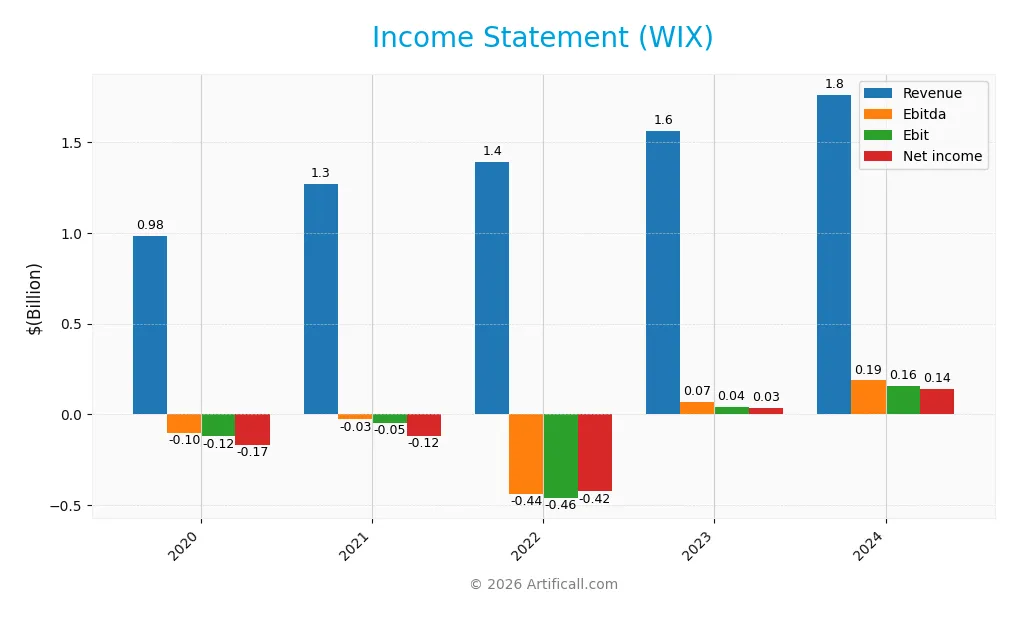
The table below presents Wix.com Ltd.’s income statement for fiscal years 2020 through 2024, showing key financial metrics in USD.

| 2020 | 2021 | 2022 | 2023 | 2024 | |
|---|---|---|---|---|---|
| Revenue | 984M | 1.27B | 1.39B | 1.56B | 1.76B |
| Cost of Revenue | 313M | 489M | 526M | 513M | 565M |
| Operating Expenses | 870M | 1.11B | 1.15B | 1.07B | 1.10B |
| Gross Profit | 671M | 781M | 861M | 1.05B | 1.20B |
| EBITDA | -105M | -29M | -440M | 68M | 186M |
| EBIT | -122M | -48M | -463M | 42M | 155M |
| Interest Expense | 30M | 6.1M | 5.9M | 4.8M | 3.9M |
| Net Income | -167M | -117M | -425M | 33M | 138M |
| EPS | -3.98 | -2.06 | -7.33 | 0.58 | 2.49 |
| Filing Date | 2021-03-25 | 2022-04-01 | 2023-03-30 | 2024-03-22 | 2025-03-21 |
Income Statement Evolution
From 2020 to 2024, Wix.com Ltd. exhibited consistent revenue growth, rising from $984M to $1.76B, a 79% increase overall. Net income followed a positive trajectory, recovering from a loss of $167M in 2020 to a profit of $138M in 2024. Gross margin remained strong and favorable at nearly 68%, while EBIT margin showed neutral stability around 8.8%, reflecting improved operational efficiency.
Is the Income Statement Favorable?
The 2024 income statement reveals favorable fundamentals with a net margin of 7.9% and a low interest expense ratio of 0.22%, supporting profitability. Revenue and gross profit increased by 13% and 14% respectively year-over-year, alongside a significant 269% growth in EBIT and 270% improvement in net margin. These indicators underscore solid financial health and effective cost management for the latest fiscal year.
Financial Ratios
The following table presents key financial ratios for Wix.com Ltd. over the fiscal years 2020 to 2024, offering a snapshot of profitability, efficiency, liquidity, leverage, and returns:
| Ratios | 2020 | 2021 | 2022 | 2023 | 2024 |
|---|---|---|---|---|---|
| Net Margin | -17% | -9% | -31% | 2% | 8% |
| ROE | -58% | -80% | 161% | -61% | -176% |
| ROIC | -15% | -25% | -27% | -2% | 9% |
| P/E | -82 | -77 | -10 | 211 | 86 |
| P/B | 47 | 62 | -17 | -128 | -151 |
| Current Ratio | 1.74 | 1.79 | 0.96 | 1.36 | 0.84 |
| Quick Ratio | 1.71 | 1.76 | 0.95 | 1.36 | 0.84 |
| D/E | 3.24 | 7.10 | -4.29 | -18.29 | -12.31 |
| Debt-to-Assets | 49% | 50% | 64% | 55% | 51% |
| Interest Coverage | -7 | -54 | -48 | -5 | 26 |
| Asset Turnover | 0.52 | 0.62 | 0.79 | 0.87 | 0.92 |
| Fixed Asset Turnover | 7.92 | 8.38 | 4.49 | 2.80 | 3.33 |
| Dividend Yield | 0% | 0% | 0% | 0% | 0% |
Evolution of Financial Ratios
Wix.com Ltd. shows fluctuating trends in key financial ratios over recent years. Return on Equity (ROE) remains deeply negative at -175.57% in 2024, indicating persistent challenges in profitability. The Current Ratio declined to 0.84 in 2024 from above 1.3 in prior years, signaling reduced short-term liquidity. The Debt-to-Equity ratio is negative but marked favorable, reflecting the company’s capital structure peculiarities. Profitability improved modestly in 2024, with net margins rising to 7.86%.
Are the Financial Ratios Favorable?
In 2024, Wix presents a mixed financial profile: profitability ratios such as net margin (7.86%) and return on invested capital (9.13%) are neutral, while ROE is unfavorable. Liquidity is strained with a current ratio below 1, but the quick ratio is neutral. Leverage measures show an unfavorable debt-to-assets ratio of 50.7%, but a favorable debt-to-equity ratio, likely due to negative equity. Efficiency metrics like asset turnover (0.92) are neutral, and market valuation ratios such as price-to-earnings are unfavorable, reflecting cautious investor sentiment. Overall, the financial ratios evaluation is slightly unfavorable.
Shareholder Return Policy
Wix.com Ltd. does not pay dividends, with a dividend payout ratio and yield consistently at zero. The company appears to prioritize reinvestment and growth, supported by positive net income per share and free cash flow per share in recent years. There is no indication of share buyback programs.
This approach aligns with a focus on long-term value creation through business expansion rather than immediate returns to shareholders. The absence of dividends and buybacks suggests a strategy centered on strengthening operational performance and capital allocation for sustainable growth.
Score analysis
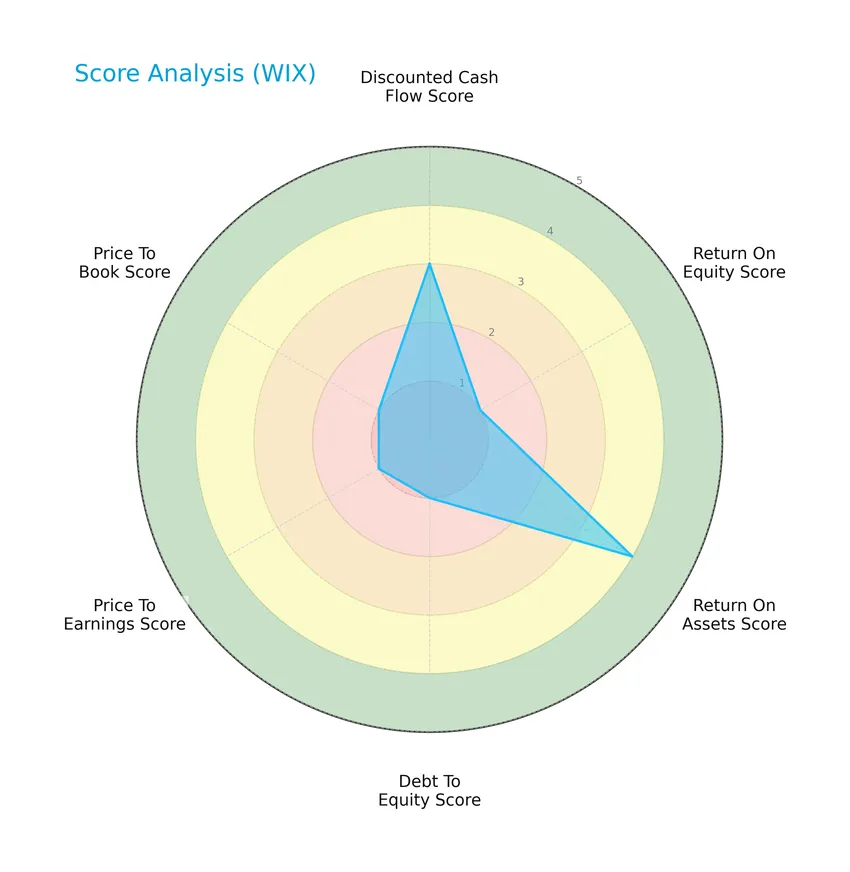
The following radar chart presents an overview of Wix.com Ltd.’s key financial scores, highlighting areas of strength and concern:

Wix.com Ltd. shows a moderate discounted cash flow score and a favorable return on assets score. However, return on equity, debt to equity, price to earnings, and price to book scores are very unfavorable, indicating challenges in profitability and valuation metrics.
Analysis of the company’s bankruptcy risk
The Altman Z-Score places Wix.com Ltd. in the grey zone, suggesting a moderate risk of financial distress and a possible chance of bankruptcy:

Is the company in good financial health?
The Piotroski Score diagram below offers insights into Wix.com Ltd.’s financial strength and stability:

With a Piotroski Score of 6, Wix.com Ltd. is classified in the average range. This reflects a reasonable financial condition but indicates room for improvement in profitability, leverage, or operational efficiency.
Competitive Landscape & Sector Positioning
This sector analysis will examine Wix.com Ltd.’s strategic positioning, revenue by segment, key products, main competitors, competitive advantages, and SWOT analysis. I will assess whether Wix.com Ltd. holds a competitive advantage over its industry peers.
Strategic Positioning
Wix.com Ltd. operates a diversified product portfolio featuring cloud-based website creation tools, business solutions, and complementary services, generating over $1.75B in 2024 revenue. Geographically, it maintains a broad exposure across North America ($1.06B), Europe ($441M), Asia Pacific ($196M), and Latin America ($67M), reflecting a balanced global presence.
Revenue by Segment
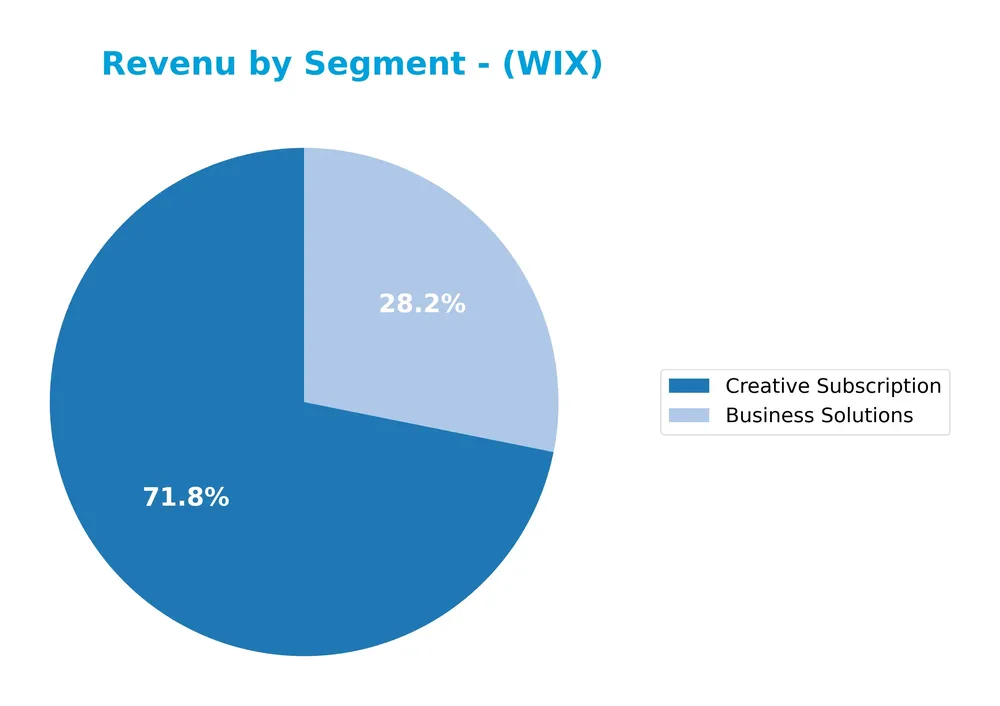
The pie chart illustrates Wix.com Ltd.’s revenue distribution across its main business segments for the fiscal year 2024, highlighting the contributions of Business Solutions and Creative Subscription.

In 2024, Creative Subscription remains the dominant revenue driver at approximately 1.26B USD, showing consistent growth since 2019. Business Solutions also grew significantly to about 496M USD, nearly doubling from 2019. The steady increase in both segments indicates balanced expansion, with Creative Subscription maintaining a larger share. The recent year shows an acceleration in Business Solutions revenue, reducing concentration risk and supporting diversified growth.
Key Products & Brands
The table below outlines Wix.com Ltd.’s main products and brands along with their descriptions:
| Product | Description |
|---|---|
| Wix Editor | A drag-and-drop visual development and website editing environment platform. |
| Wix ADI | An AI-powered tool enabling users to create websites tailored to their specific needs. |
| Corvid by Wix | A platform for creating websites and web applications with advanced development capabilities. |
| Ascend by Wix | A suite of about 20 products/features for customer connection, automation, and business growth. |
| Wix Logo Maker | An AI-based tool allowing users to generate logos. |
| Wix Answers | A multi-channel support infrastructure to assist users in customer service. |
| Wix Payments | A payment platform facilitating payment reception through Wix websites. |
| Vertical-specific apps | Applications designed for business owners to manage various online business aspects. |
| App Market | A marketplace offering free and paid web applications for installation by registered users. |
| Wix Arena | An online marketplace connecting users needing website help with web experts. |
| Wix App | A native mobile application for managing websites and Wix operating systems. |
Wix.com Ltd. offers a diverse cloud-based platform portfolio, including website creation tools, business solutions, and support services, catering to millions of users globally.
Main Competitors
There are 32 competitors in total within the sector; the table below lists the top 10 leaders by market capitalization:
| Competitor | Market Cap. |
|---|---|
| Microsoft Corporation | 3.52T |
| Oracle Corporation | 553B |
| Palantir Technologies Inc. | 383B |
| Adobe Inc. | 140B |
| Palo Alto Networks, Inc. | 120B |
| CrowdStrike Holdings, Inc. | 113B |
| Synopsys, Inc. | 92B |
| Cloudflare, Inc. | 69B |
| Fortinet, Inc. | 59B |
| Block, Inc. | 40B |
Wix.com Ltd. ranks 26th among 32 competitors, with a market cap only 0.14% of the leader, Microsoft Corporation. The company is positioned below both the average market cap of the top 10 competitors (508B) and the sector median (18.8B). Notably, it maintains a 53.09% market cap gap to the next competitor above, indicating a significant distance from its nearest rival.
Comparisons with competitors
Check out how we compare the company to its competitors:
Does WIX have a competitive advantage?
Wix.com Ltd. currently does not present a strong competitive advantage, as indicated by a ROIC below its WACC, suggesting the company is shedding value despite growth in profitability. The overall moat status is slightly unfavorable, reflecting value destruction but improving returns on invested capital.
Looking ahead, Wix benefits from a diversified product suite including AI-driven tools and payment platforms, serving over 222M users worldwide across multiple regions. Expansion in new markets and continuous innovation in cloud-based website creation and business management solutions offer potential growth opportunities.
SWOT Analysis
This SWOT analysis highlights Wix.com Ltd.’s key internal and external factors to inform strategic investment decisions.
Strengths
- strong revenue growth of 12.7% in 2024
- robust gross margin near 68%
- diversified cloud-based platform with 222M registered users
Weaknesses
- high debt-to-assets ratio at 50.7%
- negative return on equity at -175.6%
- current ratio below 1 indicating liquidity concerns
Opportunities
- expanding international markets, especially North America and Europe
- growing demand for easy website and e-commerce solutions
- AI-driven product enhancements like Wix Logo Maker
Threats
- intense competition in website builders and cloud services
- volatility due to high beta of 1.42
- potential technology shifts impacting platform relevance
Wix.com Ltd. demonstrates solid growth and market presence, but financial leverage and profitability metrics raise caution. The company’s strategy should focus on improving balance sheet strength while capitalizing on global expansion and AI innovation to sustain competitive advantage.
Stock Price Action Analysis
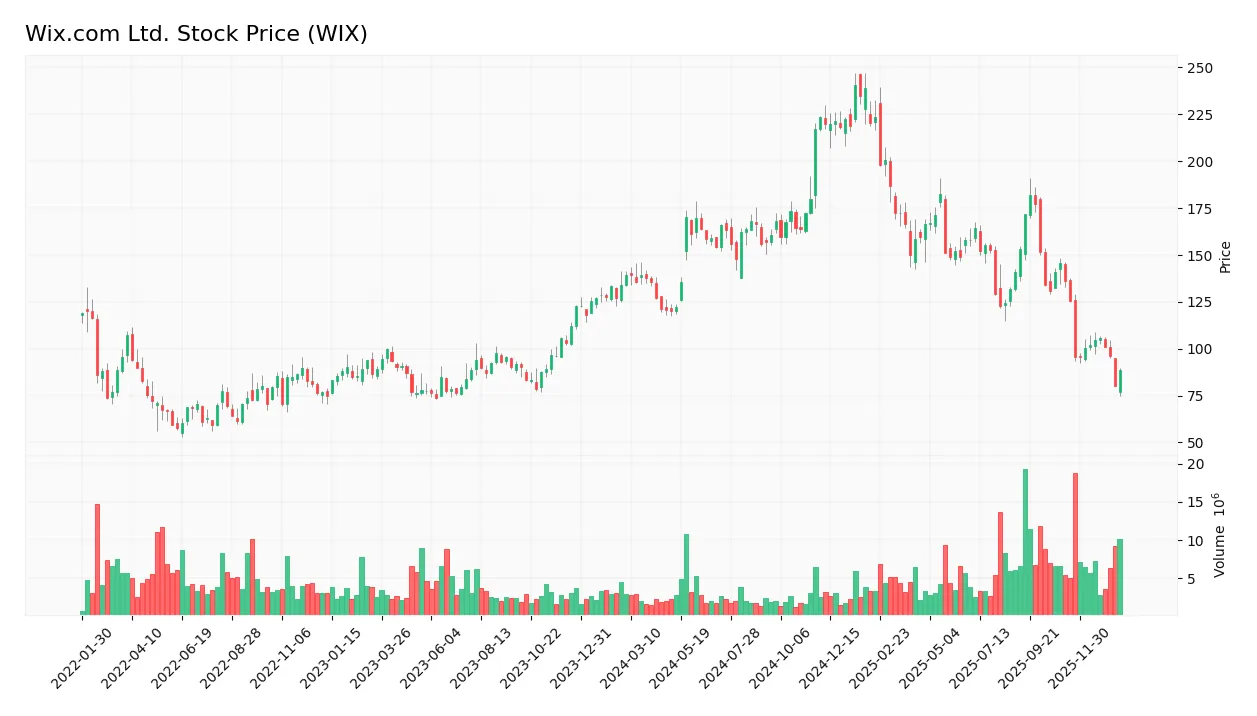
The weekly stock chart of Wix.com Ltd. (WIX) illustrates the price movements and volatility over the past 100 weeks:

Trend Analysis
Over the past 12 months, Wix.com Ltd. stock price declined by 36.47%, indicating a bearish trend. The trend shows deceleration with a high volatility level reflected by a 35.01 standard deviation. The price ranged from a high of 240.89 to a low of 80.16, confirming significant downside pressure.
Volume Analysis
In the last three months, trading volume has been increasing overall, with total volume reaching 505M shares. Despite this, seller volume slightly outweighed buyer volume at 48M versus 39M, indicating a mildly seller-dominant environment. This suggests cautious investor sentiment and selective market participation.
Target Prices
The consensus target prices for Wix.com Ltd. reflect a broad range of analyst expectations.
| Target High | Target Low | Consensus |
|---|---|---|
| 210 | 70 | 159.82 |
Analysts anticipate Wix’s share price to vary significantly, with a consensus around $160, indicating cautious optimism tempered by volatility risk.
Don’t Let Luck Decide Your Entry Point
Optimize your entry points with our advanced ProRealTime indicators. You’ll get efficient buy signals with precise price targets for maximum performance. Start outperforming now!
Analyst & Consumer Opinions
This section examines the latest analyst ratings and consumer feedback regarding Wix.com Ltd.’s market performance and products.
Stock Grades
The following table summarizes recent analyst grades for Wix.com Ltd., highlighting their current recommendations and updates:
| Grading Company | Action | New Grade | Date |
|---|---|---|---|
| Citizens | Maintain | Market Outperform | 2026-01-22 |
| Barclays | Maintain | Overweight | 2026-01-21 |
| Morgan Stanley | Maintain | Overweight | 2026-01-15 |
| Wells Fargo | Maintain | Overweight | 2025-12-19 |
| Cantor Fitzgerald | Maintain | Overweight | 2025-12-11 |
| Oppenheimer | Maintain | Outperform | 2025-11-20 |
| B. Riley Securities | Maintain | Buy | 2025-11-20 |
| Cantor Fitzgerald | Maintain | Overweight | 2025-11-20 |
| RBC Capital | Maintain | Outperform | 2025-11-20 |
| Morgan Stanley | Maintain | Overweight | 2025-11-20 |
The overall trend shows consistent positive ratings, mainly in the Overweight and Outperform categories, with no recent downgrades. Investor sentiment remains broadly favorable, supported by a consensus Buy rating reflecting strong analyst confidence.
Consumer Opinions
Consumer sentiment around Wix.com Ltd. reflects a mix of appreciation for its usability and some frustration with pricing and support.
| Positive Reviews | Negative Reviews |
|---|---|
| “User-friendly platform with great design tools.” | “Subscription costs feel a bit high for small businesses.” |
| “Excellent customization options and templates.” | “Customer support response times can be slow.” |
| “Reliable uptime and smooth website performance.” | “Some advanced features require additional fees.” |
Overall, Wix users praise its intuitive interface and design flexibility, while common critiques focus on pricing structure and occasional customer service delays.
Risk Analysis
Below is a summary table highlighting key risks associated with Wix.com Ltd., focusing on likelihood and potential impact:
| Category | Description | Probability | Impact |
|---|---|---|---|
| Financial Health | Altman Z-Score in grey zone indicates moderate bankruptcy risk amid uneven profitability metrics | Medium | High |
| Profitability | Negative Return on Equity (-175.57%) and high PE ratio (86.21) suggest earnings pressure | High | High |
| Liquidity | Current ratio below 1 (0.84) signals potential short-term liquidity constraints | Medium | Medium |
| Debt Levels | Debt to assets ratio at 50.7% may strain financial flexibility despite favorable interest coverage | Medium | Medium |
| Market Volatility | Beta of 1.418 indicates above-average stock price volatility | High | Medium |
| Dividend Policy | Zero dividend yield limits income generation for investors | High | Low |
The most critical risks for Wix in 2026 lie in its profitability challenges and financial health. Despite a strong market presence with 222M users, the company shows unfavorable ROE and a stretched valuation. The grey zone Altman Z-Score also warrants caution, signaling moderate financial distress risk. Liquidity and leverage risks, while present, are somewhat mitigated by solid interest coverage. Investors should weigh these factors carefully against growth potential before adding Wix shares to their portfolio.
Should You Buy Wix.com Ltd.?
Wix.com Ltd. appears to be a company with improving operational efficiency, evidenced by a growing ROIC despite a slightly unfavorable moat and value destruction. Its leverage profile could be seen as substantial, while the overall rating suggests a moderate investment profile in the grey zone.
Strength & Efficiency Pillars
Wix.com Ltd. exhibits solid profitability with a gross margin of 67.93% and a net margin of 7.86%, both rated favorable or neutral. While its return on equity is deeply negative at -175.57%, the return on invested capital (ROIC) of 9.13% is close to the weighted average cost of capital (WACC) at 9.46%, indicating the company is roughly breaking even on value creation rather than generating excess value. Financial health metrics place Wix in a grey zone with an Altman Z-Score of 1.88 and an average Piotroski score of 6, suggesting moderate stability but room for improvement.
Weaknesses and Drawbacks
Wix faces notable headwinds, especially regarding valuation and leverage. The price-to-earnings ratio stands at a steep 86.21, signaling an expensive premium that could pressure returns. The current ratio of 0.84 indicates liquidity concerns, raising questions about short-term financial flexibility. Although debt-to-equity is negative, reflecting accounting nuances, a high debt-to-assets ratio of 50.7% signals material leverage risk. Recent market dynamics are bearish, with a 34.91% price decline and seller dominance around 55%, suggesting investor caution and downward price momentum.
Our Verdict about Wix.com Ltd.
Wix’s long-term fundamental profile may appear slightly unfavorable due to its value destruction relative to WACC and weak equity returns. Despite improving profitability trends, the elevated valuation and liquidity constraints temper enthusiasm. With bearish technical trends and recent seller dominance, the stock could suggest a wait-and-see approach for a better entry point rather than immediate commitment. Investors may want to monitor improvements in financial health and market sentiment before increasing exposure.
Disclaimer: This content is for informational purposes only and does not constitute financial, investment, or other professional advice. Investing in financial markets involves a significant risk of loss, and past performance is not indicative of future results.
Additional Resources
- Wix.com Ltd. (WIX) Is a Trending Stock: Facts to Know Before Betting on It – Yahoo Finance (Jan 21, 2026)
- Wix Stock Rises as New AI Builder Unveiled Amid Strategic Expansion – StocksToTrade (Jan 24, 2026)
- Wix Harmony Launch And Super Bowl Push Reframe Growth Prospects – simplywall.st (Jan 25, 2026)
- Baillie Gifford & Co. Sells 91,790 Shares of Wix.com Ltd. $WIX – MarketBeat (Jan 24, 2026)
- Wix.com’s New AI Builder and Super Bowl Commercial Boost Stock – timothysykes.com (Jan 24, 2026)
For more information about Wix.com Ltd., please visit the official website: wix.com


