Home > Analyses > Technology > Wipro Limited
Wipro Limited powers the digital transformation of enterprises worldwide, embedding innovation into daily business operations across industries. As a prominent player in the IT services sector, Wipro offers cutting-edge solutions ranging from cloud infrastructure to business process services, earning a reputation for quality and technological leadership. With a vast global footprint and diverse client base, the question remains: can Wipro’s solid fundamentals and strategic initiatives sustain its market momentum and justify its valuation in today’s competitive landscape?

Table of contents
Business Model & Company Overview
Wipro Limited, founded in 1945 and headquartered in Bengaluru, India, stands as a global leader in Information Technology Services. Its operations span IT consulting, business process services, and IT products, forming a comprehensive ecosystem that supports diverse industries worldwide. With 234K employees, Wipro integrates digital strategy, cloud, analytics, and infrastructure solutions to empower enterprises in sectors like healthcare, banking, and manufacturing.
Wipro’s revenue engine is powered by a balanced mix of IT services, third-party IT products, and government-focused offerings under its ISRE segment. Its strategic footprint covers the Americas, Europe, and Asia, securing a robust presence across major markets. This diversified portfolio and global reach create a strong economic moat that positions Wipro as a pivotal force shaping the future of technology services.
Financial Performance & Fundamental Metrics
I will analyze Wipro Limited’s income statement, key financial ratios, and dividend payout policy to provide a clear view of its fundamental strength.
Income Statement
The following table presents Wipro Limited’s key income statement figures for the fiscal years 2021 through 2025, stated in INR.

| 2021 | 2022 | 2023 | 2024 | 2025 | |
|---|---|---|---|---|---|
| Revenue | 612B | 804B | 925B | 904B | 901B |
| Cost of Revenue | 418B | 565B | 660B | 636B | 625B |
| Operating Expenses | 71.8B | 103B | 125B | 132B | 123B |
| Gross Profit | 194B | 239B | 265B | 268B | 276B |
| EBITDA | 166B | 191B | 194B | 194B | 220B |
| EBIT | 141B | 159B | 161B | 161B | 192B |
| Interest Expense | 4.2B | 5.4B | 10.3B | 12.6B | 14.9B |
| Net Income | 107B | 124B | 116B | 111B | 133B |
| EPS | 9.56 | 11.18 | 10.36 | 10.45 | 12.56 |
| Filing Date | 2021-03-31 | 2022-03-31 | 2023-03-31 | 2024-05-22 | 2025-05-22 |
Income Statement Evolution
Between 2021 and 2025, Wipro Limited’s revenue grew by 47.34%, though it slightly declined by 0.24% from 2024 to 2025. Net income increased by 24.66% over the period, with a more notable 19.82% rise in net margin in the last year. Gross profit showed moderate improvement, while operating expenses grew favorably in relation to revenue, supporting margin stability.
Is the Income Statement Favorable?
The fiscal year 2025 presented generally favorable fundamentals. Gross margin stood at 30.65%, EBIT margin at 21.27%, and net margin at 14.74%, all marked as favorable. Interest expenses remained low at 1.66% of revenue. Despite a slight revenue dip, strong EBIT and net income growth, along with a 20.37% EPS increase, reflect solid operational performance and profitability.
Financial Ratios
The table below presents a selection of key financial ratios for Wipro Limited (WIT) over the fiscal years 2021 to 2025, illustrating profitability, valuation, liquidity, leverage, efficiency, and dividend metrics:
| Ratios | 2021 | 2022 | 2023 | 2024 | 2025 |
|---|---|---|---|---|---|
| Net Margin | 17% | 15% | 13% | 12% | 15% |
| ROE | 20% | 19% | 15% | 15% | 16% |
| ROIC | — | — | 11% | 10% | 10% |
| P/E | 24.4 | 26.3 | 17.8 | 22.6 | 20.8 |
| P/B | 4.76 | 4.88 | 2.59 | 3.33 | 3.30 |
| Current Ratio | 2.27 | 2.01 | 2.47 | 2.58 | 2.72 |
| Quick Ratio | 2.27 | 2.01 | 2.46 | 2.57 | 2.71 |
| D/E | 0.19 | 0.27 | 0.22 | 0.22 | 0.23 |
| Debt-to-Assets | 13% | 16% | 15% | 14% | 15% |
| Interest Coverage | 29 | 26 | 14 | 11 | 16 |
| Asset Turnover | 0.75 | 0.73 | 0.77 | 0.78 | 0.69 |
| Fixed Asset Turnover | 6.10 | 7.21 | 8.43 | 9.02 | 8.38 |
| Dividend Yield | 0.21% | 0.17% | 1.62% | 0.21% | 2.29% |
Note:
- ROIC values are reported only for fiscal years 2023 to 2025.
- All percentages are rounded to whole numbers except where below 1%, shown to two decimals.
- D/E refers to Debt-to-Equity ratio.
- Dividend Yield is expressed as a percentage.
Evolution of Financial Ratios
Over the recent years, Wipro Limited’s Return on Equity (ROE) showed a declining trend from 19.52% in 2021 to 15.86% in 2025, indicating a moderate slowdown in profitability growth. The Current Ratio steadily improved from 2.27 in 2021 to 2.72 in 2025, reflecting enhanced short-term liquidity. Meanwhile, the Debt-to-Equity Ratio remained stable and low, around 0.23 in 2025, signaling consistent leverage management.
Are the Financial Ratios Favorable?
In 2025, Wipro’s profitability ratios such as net margin (14.74%) and ROE (15.86%) are favorable, supported by a return on invested capital of 10.33%. Liquidity is strong with a current ratio of 2.72 and quick ratio of 2.71. Leverage metrics including a debt-to-equity of 0.23 and debt-to-assets at 14.93% are favorable, while the price-to-book ratio of 3.3 is unfavorable. Asset turnover is neutral, and dividend yield at 2.29% is favorable. Overall, the financial ratios present a very favorable profile.
Shareholder Return Policy
Wipro Limited maintains a consistent dividend policy with a payout ratio near 48% in FY2025 and a dividend per share rising to 6.0 INR, yielding about 2.3% annually. The dividend is comfortably covered by strong free cash flow, supported by moderate leverage and solid operating margins. The company also engages in share buybacks, complementing its shareholder returns.
This balanced approach reflects prudent capital allocation, combining dividends and buybacks without overextending cash resources. The policy appears sustainable with healthy coverage ratios and stable profitability, aligning with long-term shareholder value creation without evident risk of unsustainable distributions or excessive repurchases.
Score analysis
Below is the radar chart summarizing key financial scores reflecting Wipro Limited’s valuation, profitability, and leverage metrics:
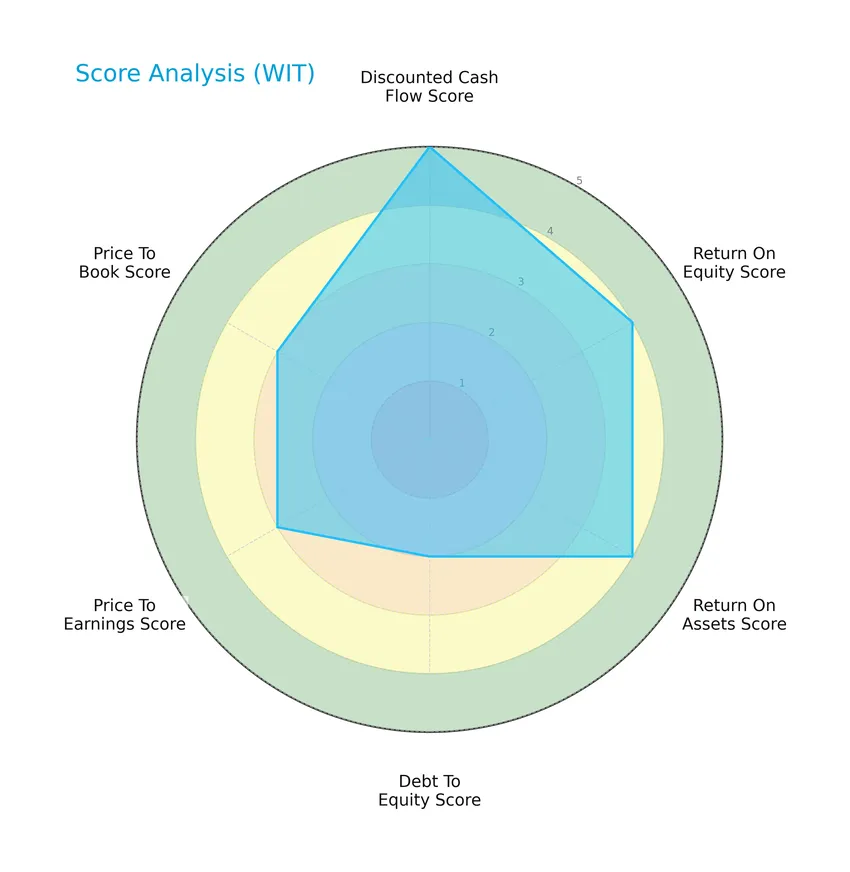
Wipro scores very favorably on discounted cash flow at 5 and favorably on return on equity and assets at 4 each. Debt to equity and valuation multiples show moderate scores of 2 to 3, indicating balanced leverage and pricing relative to earnings and book value.
Analysis of the company’s bankruptcy risk
The Altman Z-Score places Wipro Limited in the grey zone with a score of 2.25, indicating moderate bankruptcy risk and financial uncertainty:

Is the company in good financial health?
The Piotroski F-Score diagram highlights Wipro Limited’s financial condition based on nine fundamental criteria:

With a Piotroski score of 5, Wipro demonstrates average financial health, suggesting a mix of strengths and weaknesses in profitability, efficiency, and leverage metrics.
Competitive Landscape & Sector Positioning
This sector analysis will explore Wipro Limited’s strategic positioning, revenue by segment, key products, main competitors, and overall market environment. I will examine whether Wipro holds a competitive advantage over its peers in the information technology services industry.
Strategic Positioning
Wipro Limited maintains a diversified portfolio across IT Services, IT Products, and India State Run Enterprise Services, serving global industries including healthcare, finance, and manufacturing, with a strong geographic focus on India and a broad sectoral reach spanning government to private enterprises.
Key Products & Brands
The table below outlines Wipro Limited’s main products and service segments:
| Product | Description |
|---|---|
| IT Services | IT and IT-enabled services including digital strategy advisory, consulting, application design, systems integration, cloud, analytics, and hardware/software design. |
| IT Products | Third-party IT products such as enterprise platforms, networking solutions, software, data storage, contact center infrastructure, enterprise security, and end-user computing solutions. |
| India State Run Enterprise Services (ISRE) | IT services provided to government-owned or controlled entities and departments across Indian states. |
Wipro operates through three distinct segments, delivering comprehensive IT services, a broad range of IT products, and specialized services to Indian government enterprises, serving diverse industries globally.
Main Competitors
There are 16 competitors in total, with the table below listing the top 10 leaders by market capitalization:
| Competitor | Market Cap. |
|---|---|
| International Business Machines Corporation | 272B |
| Accenture plc | 162B |
| Cognizant Technology Solutions Corporation | 40B |
| Fiserv, Inc. | 36B |
| Fidelity National Information Services, Inc. | 34B |
| Wipro Limited | 30B |
| Leidos Holdings, Inc. | 23B |
| Gartner, Inc. | 18B |
| CDW Corporation | 17B |
| Jack Henry & Associates, Inc. | 13B |
Wipro Limited ranks 6th among its competitors with a market cap approximately 10% of the leading company, IBM. It is positioned below the average market cap of the top 10 competitors (64.6B) but remains above the sector median (17.8B). The company enjoys a 25.74% market cap lead over the next closest competitor, highlighting a significant gap in scale.
Does WIT have a competitive advantage?
Wipro Limited presents a competitive advantage as it consistently creates value with an ROIC exceeding its WACC by nearly 3.9%, indicating efficient capital use and favorable profitability metrics. Despite this, the company’s ROIC trend is declining, suggesting some erosion in profitability over recent years.
Looking ahead, Wipro’s diverse IT services segments and its role in digital strategy advisory and cloud solutions position it to capitalize on expanding technology markets and government contracts. Continued investments in innovation and broad industry coverage may offer growth opportunities amid evolving digital transformation demands.
Comparisons with competitors
Check out how we compare the company to its competitors:
SWOT Analysis
This analysis highlights the key internal and external factors impacting Wipro Limited’s strategic position.
Strengths
- strong market presence in IT services
- diversified customer base across industries
- favorable profitability and margin metrics
Weaknesses
- modest recent revenue growth
- declining ROIC trend
- moderate debt levels
Opportunities
- growing demand for digital transformation
- expansion in government IT services
- potential in emerging markets
Threats
- intense competition in IT sector
- geopolitical and regulatory risks
- rapid technology changes requiring constant innovation
Overall, Wipro shows solid strengths in profitability and market reach but faces challenges from slowing revenue growth and declining ROIC. To sustain growth, the company must leverage digital transformation trends while managing competition and innovation risks carefully.
Stock Price Action Analysis
The weekly stock chart for Wipro Limited (WIT) over the past 12 months reveals significant price fluctuations and a clear directional movement:
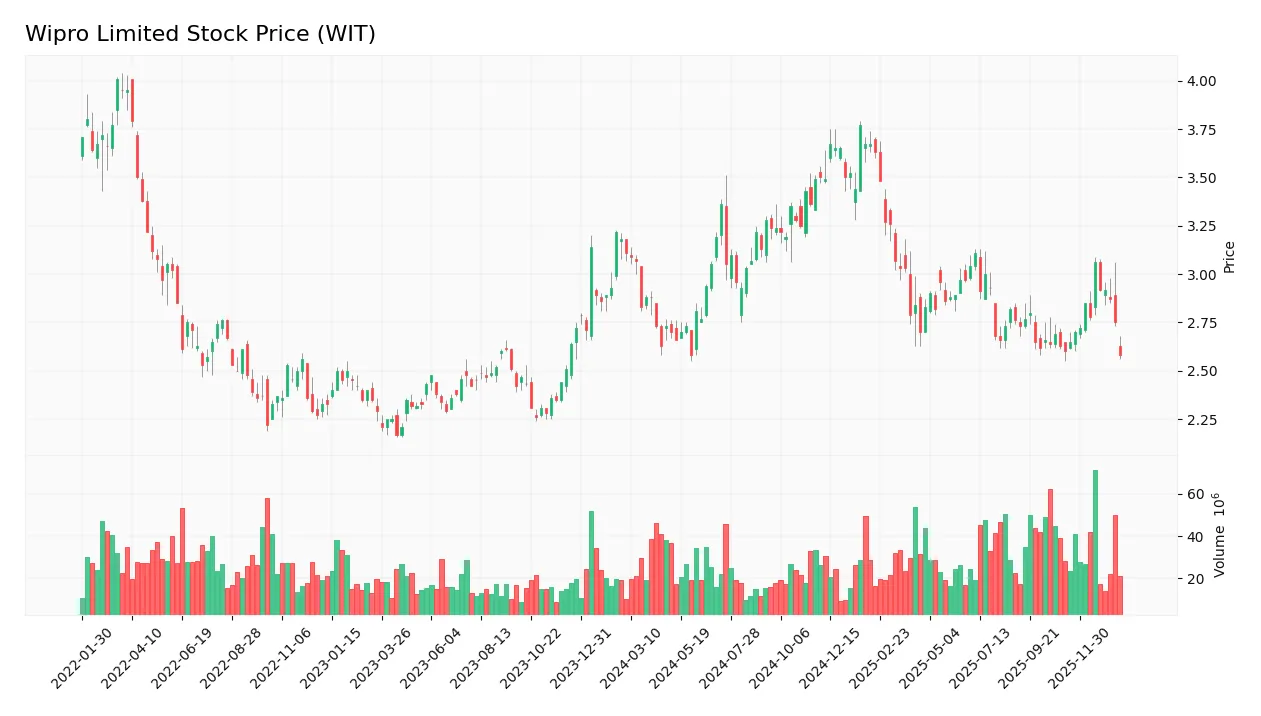
Trend Analysis
Over the past 12 months, WIT’s stock price declined by 17.04%, indicating a bearish trend with accelerating downward momentum. The price ranged between a high of 3.77 and a low of 2.58, with moderate volatility reflected by a standard deviation of 0.31. Recent weeks show a mild 0.77% decrease with a nearly flat slope, suggesting short-term stabilization.
Volume Analysis
Trading volume for WIT has been increasing overall, totaling over 3.2B shares, with sellers accounting for 55.07% historically. However, in the last three months, buyer volume slightly surpassed sellers at 51.27%, indicating neutral buyer behavior and balanced market participation without strong directional conviction.
Target Prices
Analysts present a moderate target consensus for Wipro Limited, reflecting cautious optimism.
| Target High | Target Low | Consensus |
|---|---|---|
| 7.7 | 7.0 | 7.35 |
The target prices suggest a relatively narrow range, indicating steady expectations with limited volatility anticipated by the analyst community.
Analyst & Consumer Opinions
This section reviews recent analyst ratings and consumer feedback related to Wipro Limited’s market performance and services.

Don’t Let Luck Decide Your Entry Point
Optimize your entry points with our advanced ProRealTime indicators. You’ll get efficient buy signals with precise price targets for maximum performance. Start outperforming now!
Stock Grades
The following table presents the latest verified grades for Wipro Limited from major financial institutions:
| Grading Company | Action | New Grade | Date |
|---|---|---|---|
| UBS | Upgrade | Neutral | 2025-01-02 |
| Wedbush | Maintain | Underperform | 2024-01-16 |
| JP Morgan | Maintain | Underweight | 2023-05-24 |
| Bernstein | Downgrade | Underperform | 2023-03-22 |
| Bernstein | Downgrade | Underperform | 2023-03-21 |
| Goldman Sachs | Upgrade | Buy | 2022-09-13 |
| Goldman Sachs | Upgrade | Buy | 2022-09-12 |
| Morgan Stanley | Downgrade | Underweight | 2022-07-14 |
| Morgan Stanley | Downgrade | Underweight | 2022-07-13 |
| Macquarie | Upgrade | Outperform | 2022-06-02 |
The overall trend shows a mix of downgrades to underperform or underweight ratings alongside some upgrades, with the most recent grade from UBS moving to neutral. The consensus remains a hold, reflecting cautious investor sentiment.
Consumer Opinions
Wipro Limited continues to evoke a mix of admiration and constructive criticism from its consumer base, reflecting the company’s evolving market presence.
| Positive Reviews | Negative Reviews |
|---|---|
| Reliable IT services with strong technical expertise. | Customer support can be slow during peak periods. |
| Competitive pricing compared to industry peers. | Some clients report delayed project deliveries. |
| Proactive approach to innovation and digital transformation. | Occasional issues with communication clarity. |
Overall, consumers appreciate Wipro’s technical reliability and innovative solutions, while common concerns focus on customer support responsiveness and project timeline management.
Risk Analysis
Below is a table summarizing key risks associated with investing in Wipro Limited (WIT), highlighting their likelihood and potential impact:
| Category | Description | Probability | Impact |
|---|---|---|---|
| Financial Stability | Altman Z-Score in the grey zone (2.25), indicating moderate bankruptcy risk and financial stress | Medium | Medium |
| Valuation | Unfavorable price-to-book ratio (3.3) suggesting possible overvaluation in the current market | Medium | Medium |
| Market Volatility | Beta of 0.555 implies lower stock volatility but susceptibility to sector-specific downturns | Low | Medium |
| Debt Management | Moderate debt-to-equity score (2), though overall leverage is low (0.23), manageable debt risks | Low | Low |
| Dividend Yield | Dividend yield at 2.29%, stable but potentially sensitive to earnings fluctuations | Low | Low |
The most significant risks for Wipro currently stem from its moderate financial distress signals and valuation concerns. Despite strong operational metrics, the Altman Z-Score in the grey zone warns of caution. Investors should monitor market conditions and company earnings closely to manage downside risk effectively.
Should You Buy Wipro Limited?
Wipro Limited appears to be a company with robust value creation but a slightly declining profitability trend, suggesting a slightly favorable competitive moat. Despite a manageable leverage profile, its overall rating is A-, indicating a very favorable but cautiously moderate investment profile.
Strength & Efficiency Pillars
Wipro Limited exhibits solid profitability with a net margin of 14.74% and a return on equity (ROE) of 15.86%, underscoring operational efficiency and shareholder value generation. The company’s return on invested capital (ROIC) stands at 10.33%, notably above its weighted average cost of capital (WACC) of 6.43%, confirming Wipro as a clear value creator. Financial health indicators further support stability, with an Altman Z-score of 2.25 placing it in the grey zone, and a Piotroski score of 5, reflecting average but stable financial strength. The firm’s leverage is conservatively managed, with a debt-to-equity ratio of 0.23 and robust liquidity ratios (current ratio 2.72, quick ratio 2.71).
Weaknesses and Drawbacks
Despite its strengths, Wipro faces valuation and market pressure concerns. The price-to-book ratio of 3.3 is marked unfavorable, suggesting the stock trades at a premium relative to its book value, which could limit upside. The price-to-earnings ratio of 20.84 is neutral but indicates moderate valuation risk in a competitive sector. Additionally, the company’s overall stock trend remains bearish with a 17.04% price decline over the past year. While recent buyer dominance at 51.27% signals some stabilization, the persistent downward price pressure and seller volume dominance over the longer term caution investors on timing entry points.
Our Verdict about Wipro Limited
Wipro’s long-term fundamental profile is favorable, supported by consistent profitability and value creation metrics. However, the bearish overall stock trend and moderate valuation concerns suggest that despite its financial resilience, the stock might benefit from a cautious approach. The recent neutral buyer behavior and slight price stabilization may appear encouraging, but a wait-and-see stance could better serve investors seeking an optimal entry point in this environment.
Disclaimer: This content is for informational purposes only and does not constitute financial, investment, or other professional advice. Investing in financial markets involves a significant risk of loss, and past performance is not indicative of future results.
Additional Resources
- Morgan Stanley Lowers Wipro Limited (WIT) Target, Cites Sluggish Exit Rate – Yahoo Finance (Jan 24, 2026)
- Wipro: Consider Above-Consensus Earnings And Muted Prospects – Seeking Alpha (Jan 20, 2026)
- Wipro Limited (WIT): Transforming Telecom Operations with TelcoAI360 – Intellectia AI (Jan 24, 2026)
- Wipro Limited to Announce Results for the Third Quarter Ended December 31, 2025, on January 16, 2026 – Business Wire (Jan 07, 2026)
- Wipro (WIT) Reports Mixed Q3 Results with Revenue Shortfall – GuruFocus (Jan 19, 2026)
For more information about Wipro Limited, please visit the official website: wipro.com