Home > Analyses > Financial Services > Willis Towers Watson Public Limited Company
Willis Towers Watson transforms complex risk and human capital challenges into clear, actionable strategies. As a global leader in insurance brokerage and consulting, it pioneers solutions that shape employee benefits, risk management, and investment advisory worldwide. Renowned for sophisticated analytics and innovative tools, WTW influences industries across sectors. As 2026 unfolds, I ask: do its robust fundamentals and strategic positioning still justify its premium valuation and growth prospects?

Table of contents
Business Model & Company Overview
Willis Towers Watson Public Limited Company, founded in 1828 and headquartered in London, leads the advisory and broking industry with a comprehensive ecosystem of risk management and human capital solutions. Its core mission integrates actuarial, consulting, and insurance brokerage services across Health, Wealth and Career, plus Risk and Broking segments, creating a unified platform for clients’ complex needs worldwide.
The company’s revenue engine balances consulting fees, software products, and recurring benefits outsourcing services, driving steady cash flow across Americas, Europe, and Asia. This diversified model reinforces its competitive advantage by blending advisory depth with scalable technology. Willis Towers Watson’s entrenched global presence and wide service offering secure a robust economic moat, shaping the future of risk and talent management.
Financial Performance & Fundamental Metrics
I analyze Willis Towers Watson’s income statement, key financial ratios, and dividend payout policy to reveal its operational efficiency and shareholder return strategy.
Income Statement
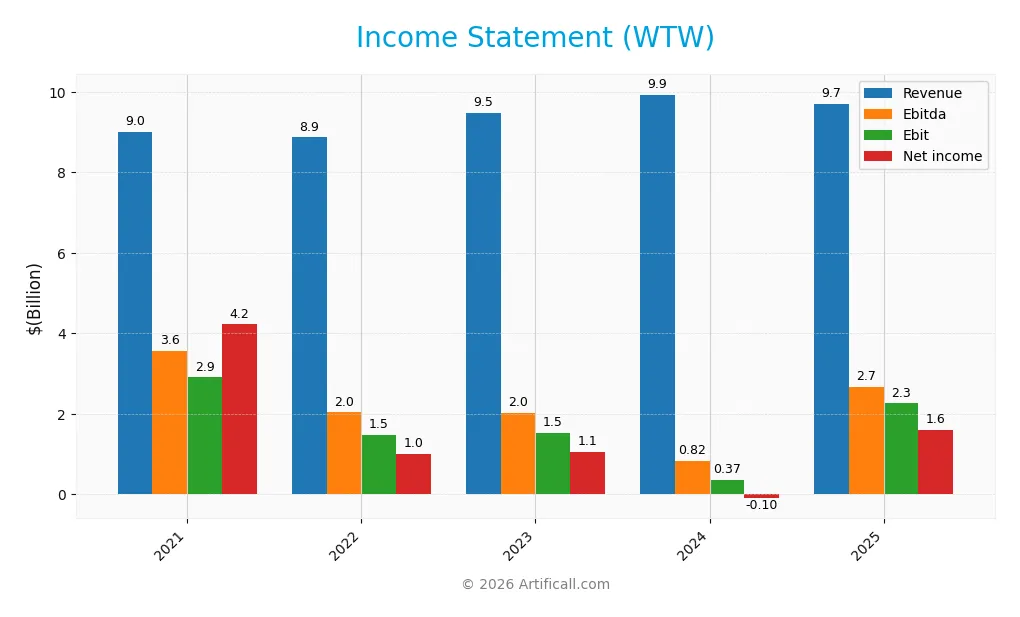
This table summarizes Willis Towers Watson’s key income statement metrics over the past five fiscal years, providing a clear view of its earnings and profitability trends.
| 2021 | 2022 | 2023 | 2024 | 2025 | |
|---|---|---|---|---|---|
| Revenue | 9B | 8.9B | 9.5B | 9.9B | 9.7B |
| Cost of Revenue | 5.3B | 5.1B | 5.3B | 5.5B | 5.6B |
| Operating Expenses | 1.5B | 2.6B | 2.8B | 3.8B | 1.8B |
| Gross Profit | 3.7B | 3.8B | 4.1B | 4.4B | 4.1B |
| EBITDA | 3.6B | 2B | 2B | 823M | 2.7B |
| EBIT | 2.9B | 1.5B | 1.5B | 367M | 2.3B |
| Interest Expense | 211M | 208M | 235M | 263M | 260M |
| Net Income | 4.2B | 1B | 1.1B | -98M | 1.6B |
| EPS | 15.02 | 9 | 10.05 | -0.96 | 16.34 |
| Filing Date | 2022-02-24 | 2023-02-24 | 2024-02-22 | 2025-02-25 | 2026-02-25 |
Income Statement Evolution
Willis Towers Watson’s revenue grew modestly by 7.9% from 2021 to 2025 but declined 2.2% in the last year. Net income fell sharply overall, down 62% across the period, though it surged in 2025 after a prior loss. Margins contracted over time but improved significantly in the latest year, with gross and net margins recovering favorably.
Is the Income Statement Favorable?
In 2025, the company posted $9.7B revenue with a 42.1% gross margin, signaling efficient cost control despite a recent revenue dip. EBIT margin surged to 23.3%, lifting net income margin to 16.5%, a strong rebound from 2024’s negative bottom line. Interest expense remains low at 2.7% of revenue. Overall, fundamentals appear favorable, supported by margin expansion and earnings recovery.
Financial Ratios
The following table presents key financial ratios for Willis Towers Watson Public Limited Company over the last five fiscal years, illustrating profitability, valuation, liquidity, leverage, efficiency, and dividend metrics:
| Ratios | 2021 | 2022 | 2023 | 2024 | 2025 |
|---|---|---|---|---|---|
| Net Margin | 47% | 11% | 11% | -1% | 17% |
| ROE | 32% | 10% | 11% | -1% | 20% |
| ROIC | 8% | 6% | 7% | -3% | 12% |
| P/E | 7.2 | 27.1 | 24.0 | -326.0 | 20.1 |
| P/B | 2.3 | 2.7 | 2.7 | 4.0 | 4.0 |
| Current Ratio | 1.26 | 1.07 | 1.06 | 1.20 | 1.20 |
| Quick Ratio | 1.26 | 1.07 | 1.06 | 1.20 | 1.20 |
| D/E | 0.41 | 0.55 | 0.62 | 0.75 | 0.87 |
| Debt-to-Assets | 16% | 17% | 20% | 21% | 23% |
| Interest Coverage | 10.4 | 5.7 | 5.8 | 2.4 | 8.6 |
| Asset Turnover | 0.26 | 0.28 | 0.33 | 0.36 | 0.33 |
| Fixed Asset Turnover | 5.7 | 6.8 | 7.4 | 8.7 | 8.2 |
| Dividend Yield | 1.23% | 1.35% | 1.39% | 1.11% | 1.11% |
Evolution of Financial Ratios
From 2021 to 2025, Willis Towers Watson’s Return on Equity (ROE) showed volatility, dipping negative in 2024 before rebounding to 20.12% in 2025. The Current Ratio remained stable near 1.2, indicating consistent liquidity. Debt-to-Equity increased moderately, reaching 0.87 in 2025, signaling a steady rise in leverage but within manageable bounds. Profitability improved markedly after the 2024 dip.
Are the Financial Ratios Favorable?
In 2025, profitability ratios such as net margin (16.53%) and ROE (20.12%) stand favorable, exceeding sector norms. Liquidity remains neutral to favorable with a current ratio of 1.2 and quick ratio matching. Leverage metrics show a neutral stance, with debt-to-equity at 0.87 and debt-to-assets favorable at 23.38%. However, asset turnover at 0.33 is unfavorable, suggesting efficiency challenges. Market multiples like P/E are neutral, while P/B ratio is unfavorable, balancing overall to a favorable financial profile.
Shareholder Return Policy
Willis Towers Watson (WTW) maintains a consistent dividend payout with a 2025 dividend payout ratio of 22.3% and a yield near 1.11%. Dividends are supported by solid free cash flow coverage, reflecting prudent capital allocation and a stable distribution approach.
The company also engages in share buybacks, complementing dividends and enhancing shareholder value. This balanced policy aligns with sustainable long-term returns, avoiding excessive payout risks while rewarding shareholders steadily.
Score analysis
The radar chart below visualizes Willis Towers Watson’s key financial metric scores across valuation, profitability, and leverage:
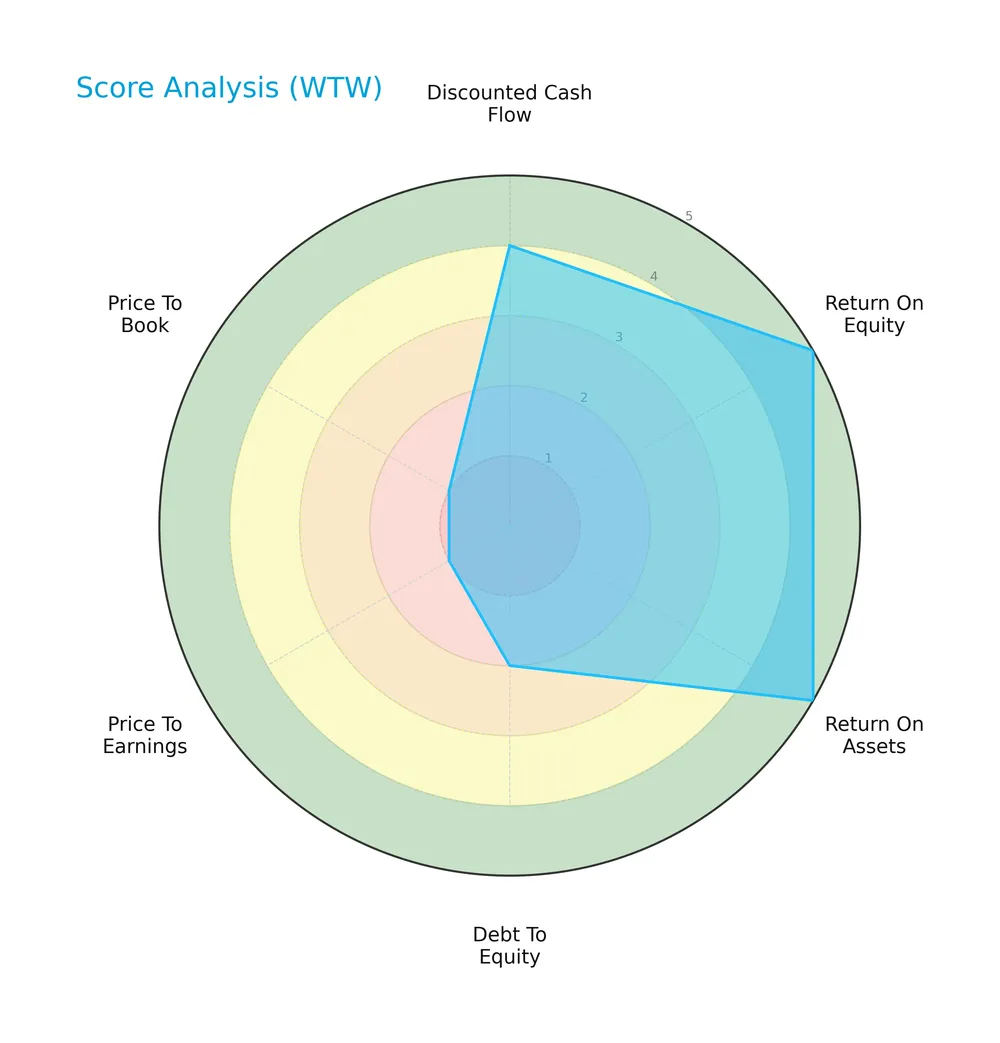
The company scores very favorably on return on equity and assets (both 5), indicating strong profitability. The discounted cash flow score is favorable at 4. However, debt to equity is unfavorable at 2, and valuation scores for price-to-earnings and price-to-book are very unfavorable at 1 each, reflecting potential market concerns.
Analysis of the company’s bankruptcy risk
The Altman Z-Score places Willis Towers Watson in the distress zone, signaling a high risk of financial distress and potential bankruptcy:

Is the company in good financial health?
The Piotroski Score diagram shows an average financial health score for the company:

With a Piotroski Score of 6, Willis Towers Watson demonstrates moderate financial strength but does not reach the threshold of strong or very strong health, suggesting some room for improvement in operational efficiency and balance sheet quality.
Competitive Landscape & Sector Positioning
This analysis examines Willis Towers Watson’s strategic positioning, revenue segments, key products, and main competitors. I will evaluate whether the company holds a competitive advantage over its peers.
Strategic Positioning
Willis Towers Watson operates a diversified product portfolio split between Health, Wealth and Career (5.3B in 2025) and Risk and Broking (4.3B). Geographically, revenue spans the US (4.5B), UK (2.1B), Ireland, and Rest of World (3B), reflecting broad international exposure within financial services.
Revenue by Segment
This pie chart illustrates Willis Towers Watson’s revenue distribution by segment for the fiscal year 2025, highlighting the relative contributions of core business areas.
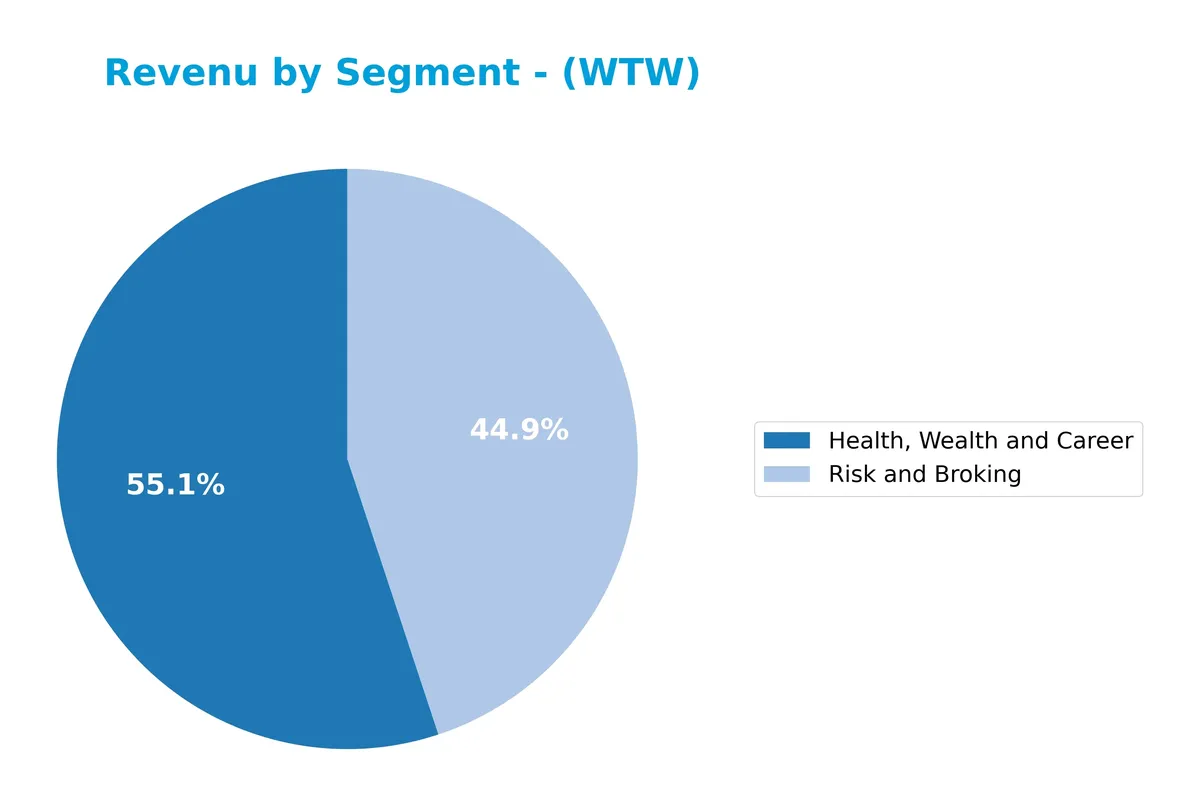
In 2025, “Health, Wealth and Career” leads with $5.3B, followed by “Risk and Broking” at $4.3B. The “Health, Wealth and Career” segment shows a slight decline from $5.8B in 2024, signaling some pressure. Meanwhile, “Risk and Broking” revenue increased, reflecting a shift toward risk advisory services. This mix highlights a diversification but also a concentration risk in the two main segments.
Key Products & Brands
The table below outlines Willis Towers Watson’s primary products and services across its core segments:
| Product | Description |
|---|---|
| Health, Wealth and Career | Actuarial support, plan design, and administration for pensions, health and group benefit programs. |
| Risk and Broking | Risk advice, insurance brokerage, consulting in property, casualty, aerospace, construction, marine. |
| Benefits Delivery and Administration | Outsourcing services including health savings accounts and flexible spending accounts. |
| Investment Consulting and Management | Investment advisory and discretionary management for insurance and reinsurance companies. |
| Insurance Consulting and Technology | Services in risk management, pricing, financial reporting, and capital modeling. |
| Wholesale Insurance Broking | Broking services to retail and wholesale brokers. |
Willis Towers Watson generates the majority of revenue from Health, Wealth and Career and Risk and Broking segments. These offerings combine consulting, broking, and technology-driven solutions across insurance and employee benefits markets.
Main Competitors
There are 6 main competitors in the Insurance – Brokers industry; the table lists the top 6 leaders by market capitalization:
| Competitor | Market Cap. |
|---|---|
| Marsh & McLennan Companies, Inc. | 89.8B |
| Aon plc | 74.4B |
| Arthur J. Gallagher & Co. | 65.7B |
| Willis Towers Watson Public Limited Company | 32.3B |
| Brown & Brown, Inc. | 26.5B |
| Erie Indemnity Company | 12.8B |
Willis Towers Watson ranks 4th among six competitors, holding about 32% of the market cap of the leader, Marsh & McLennan. The company’s capitalization is below both the average market cap of the top 10 (50.3B) and the sector median (49.0B). It maintains a wide gap of +131% above its closest rival, Brown & Brown, indicating a solid positioning in the mid-tier of this concentrated sector.
Comparisons with competitors
Check out how we compare the company to its competitors:
Does WTW have a competitive advantage?
Willis Towers Watson (WTW) demonstrates a very favorable competitive advantage, with ROIC exceeding WACC by 5.7% and a 37% growth trend in ROIC, indicating strong value creation and efficient capital use. This performance places WTW well above typical industry benchmarks, highlighting its ability to sustain profitability and deliver excess returns over the 2021-2025 period.
Looking ahead, WTW’s extensive global footprint, especially in the US and UK markets, supports its growth potential. The company’s diverse advisory and broking services, combined with new offerings in health, wealth, and risk solutions, position it to capitalize on evolving client needs and expanding markets worldwide.
SWOT Analysis
This SWOT analysis highlights Willis Towers Watson’s core strategic factors shaping its market position and future growth prospects.
Strengths
- Strong ROIC exceeding WACC
- Diverse global footprint with $9.6B international revenue
- Robust EBIT margin at 23.25%
Weaknesses
- Declining revenue growth in recent year (-2.24%)
- High price-to-book ratio (4.04) signals premium valuation
- Altman Z-Score in distress zone (1.47)
Opportunities
- Expansion in emerging markets
- Increasing demand for risk management solutions
- Growth in digital insurance services
Threats
- Intense competition in insurance brokerage
- Regulatory changes in financial services
- Economic slowdown impacting client budgets
Willis Towers Watson shows a very favorable moat with growing profitability. However, recent revenue softness and financial distress signals warrant caution. The company should leverage its global scale and innovation to combat competitive and regulatory risks.
Stock Price Action Analysis
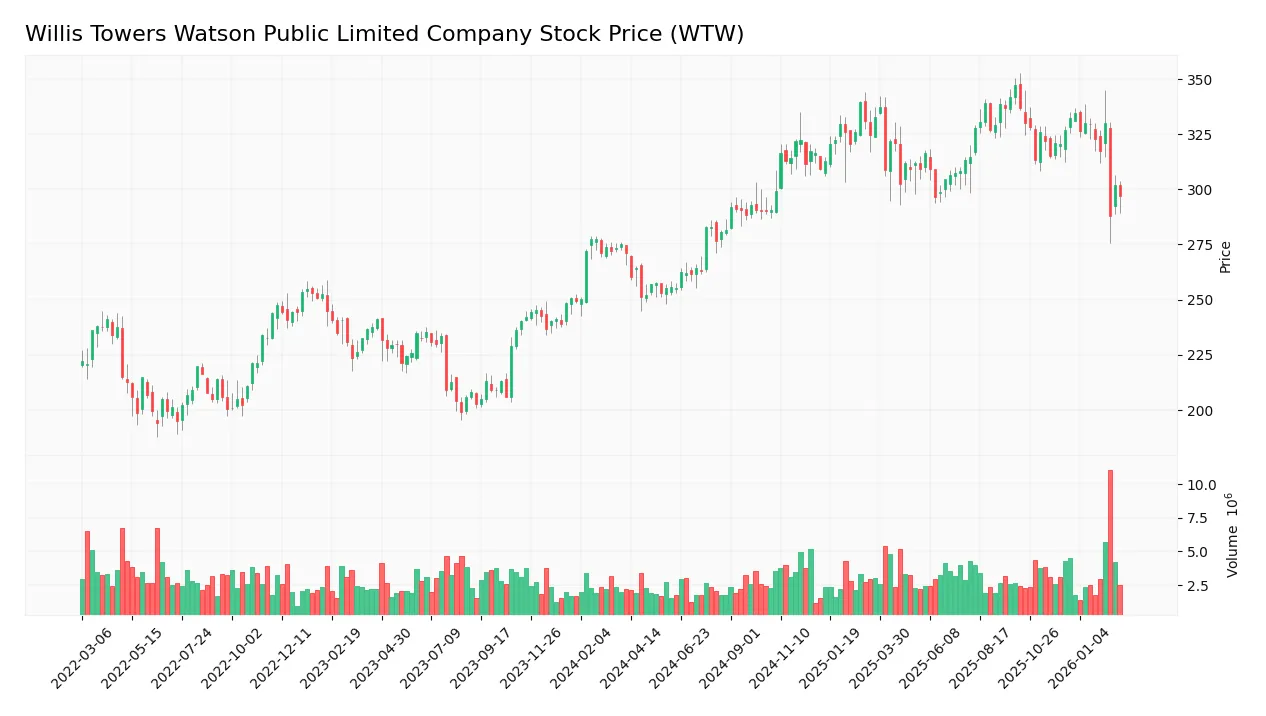
The weekly stock chart displays Willis Towers Watson’s price movement over the past 100 weeks, highlighting notable highs and lows:
Trend Analysis
Over the past 12 months, WTW’s price rose 9.56%, signaling a bullish trend with deceleration. The stock fluctuated between a low of 250.95 and a high of 347.14, showing significant volatility (std dev 25.53). However, recent weeks (Dec 2025–Mar 2026) reveal a -9.2% decline, indicating a short-term bearish slope (-3.36).
Volume Analysis
Trading volume has increased, totaling 340M shares, with buyers representing 55.4%, suggesting buyer-driven activity overall. In the recent period, buyer dominance dipped to 50.65%, showing neutral buyer behavior. This points to balanced market participation without clear directional conviction.
Target Prices
Analysts present a robust target consensus for Willis Towers Watson Public Limited Company.
| Target Low | Target High | Consensus |
|---|---|---|
| 318 | 409 | 371.33 |
The target range from 318 to 409 indicates strong upside potential. The consensus of 371.33 reflects positive market expectations for WTW’s performance.

Don’t Let Luck Decide Your Entry Point
Optimize your entry points with our advanced ProRealTime indicators. You’ll get efficient buy signals with precise price targets for maximum performance. Start outperforming now!
Analyst & Consumer Opinions
This section examines Willis Towers Watson Public Limited Company’s analyst ratings and consumer feedback to provide balanced insights.
Stock Grades
Here are the latest verified stock grades for Willis Towers Watson Public Limited Company from top-tier analysts:
| Grading Company | Action | New Grade | Date |
|---|---|---|---|
| Piper Sandler | Maintain | Overweight | 2026-02-23 |
| UBS | Maintain | Buy | 2026-02-09 |
| Citigroup | Maintain | Neutral | 2026-02-09 |
| Evercore ISI Group | Maintain | Outperform | 2026-02-04 |
| Truist Securities | Maintain | Buy | 2026-02-04 |
| Wells Fargo | Maintain | Overweight | 2026-02-04 |
| Cantor Fitzgerald | Maintain | Neutral | 2026-01-14 |
| Wells Fargo | Maintain | Overweight | 2026-01-13 |
| Barclays | Maintain | Underweight | 2026-01-08 |
| Evercore ISI Group | Maintain | Outperform | 2026-01-07 |
The overall trend favors a positive stance with multiple “Buy,” “Overweight,” and “Outperform” ratings, though a few neutral and one underweight grade indicate cautious views remain among some analysts.
Consumer Opinions
Consumer sentiment around Willis Towers Watson Public Limited Company reflects a mix of appreciation and concern, highlighting key customer experiences.
| Positive Reviews | Negative Reviews |
|---|---|
| “Responsive client service with expert advice.” | “Occasional delays in project delivery.” |
| “Comprehensive risk management solutions.” | “Pricing structure can be confusing.” |
| “Strong industry knowledge and insights.” | “Customer support sometimes lacks follow-up.” |
Overall, clients value Willis Towers Watson’s deep expertise and tailored risk solutions. However, repeated mentions of service delays and communication gaps suggest areas needing operational improvement.
Risk Analysis
Below is a summary table outlining key risks facing Willis Towers Watson Public Limited Company:
| Category | Description | Probability | Impact |
|---|---|---|---|
| Financial Health | Altman Z-Score at 1.47 signals distress zone, indicating elevated bankruptcy risk. | High | High |
| Valuation Metrics | Very unfavorable P/E and P/B ratios suggest overvaluation risk, pressuring future returns. | Medium | Medium |
| Debt Management | Debt-to-equity ratio is unfavorable, raising concerns about leverage and interest burden. | Medium | Medium |
| Operational Efficiency | Unfavorable asset turnover indicates potential inefficiency in using assets to generate revenue. | Medium | Low |
| Market Volatility | Beta of 0.62 implies low sensitivity to market swings, which may limit upside in bullish cycles. | Low | Low |
The most pressing risk is financial distress, as indicated by the Altman Z-Score below 1.8. This metric historically flags companies at heightened bankruptcy risk. Despite strong profitability and returns on equity, Willis Towers Watson’s leverage and valuation metrics present vulnerabilities. Investors should weigh these risks carefully, especially in a potentially volatile macro environment.
Should You Buy Willis Towers Watson Public Limited Company?
Willis Towers Watson appears to be generating improving profitability supported by a durable competitive moat with growing ROIC. Despite a manageable leverage profile, credit risk remains elevated as suggested by a distress-zone Altman Z-Score. The overall rating could be seen as B+, reflecting moderate operational efficiency balanced with valuation concerns.
Strength & Efficiency Pillars
Willis Towers Watson shows solid operational strength with a net margin of 16.53% and a return on equity of 20.12%. Its ROIC stands at 11.52%, comfortably above the WACC of 5.78%, signaling the company is a clear value creator. The firm’s growing ROIC trend reinforces its ability to sustain profitability. These metrics highlight efficient capital allocation and strong profitability, positioning the company well within its industry.
Weaknesses and Drawbacks
The company faces significant financial distress, as indicated by an Altman Z-Score of 1.47, placing it in the Distress Zone with heightened bankruptcy risk. This risk overshadows other concerns. Additionally, Willis Towers Watson’s valuation appears expensive with a high price-to-book ratio of 4.04 and a neutral P/E of 20.06. Although leverage is moderate (debt-to-equity at 0.87), these factors combined with financial distress create substantial risk for investors.
Our Final Verdict about Willis Towers Watson Public Limited Company
Despite operational efficiency and value creation, the company’s Altman Z-Score in the Distress Zone makes its profile highly speculative. The solvency risk weighs heavily against its attractive margins and ROIC. Investors seeking conservative capital preservation might find Willis Towers Watson too risky at this stage, despite its longer-term potential.
Disclaimer: This content is for informational purposes only and does not constitute financial, investment, or other professional advice. Investing in financial markets involves a significant risk of loss, and past performance is not indicative of future results.
Additional Resources
- Is Willis Towers Watson Public Limited Company (WTW) One of the Best Foreign Stocks to Buy Right Now? – Yahoo Finance (Feb 14, 2026)
- Risk & Broking Segment Fuels Positive Momentum for Willis Towers Watson (WTW) – Finviz (Feb 19, 2026)
- Do Wall Street Analysts Like Willis Towers Watson Stock? – Barchart.com (Feb 20, 2026)
- Willis Towers Watson stock rallies after Q4 earnings beat (WTW:NASDAQ) – Seeking Alpha (Feb 03, 2026)
- The Architect of Risk: WTW’s Strategic Transformation and the New Era of Brokerage – FinancialContent (Feb 10, 2026)
For more information about Willis Towers Watson Public Limited Company, please visit the official website: willistowerswatson.com