Home > Analyses > Consumer Cyclical > Williams-Sonoma, Inc.
Williams-Sonoma, Inc. transforms everyday living spaces into personalized retreats with its premium home furnishings and kitchenware. Renowned for iconic brands like Pottery Barn, West Elm, and Williams Sonoma, the company blends craftsmanship with innovation to lead specialty retail. Its omni-channel presence and cutting-edge AR platform deepen customer engagement. As the retail landscape evolves, I question whether Williams-Sonoma’s solid fundamentals still support its market valuation and growth ambitions.
Table of contents
Business Model & Company Overview
Williams-Sonoma, Inc., founded in 1956 and headquartered in San Francisco, commands a leading position in specialty retail. It delivers a cohesive ecosystem of home products spanning cookware, furniture, and decor through multiple lifestyle brands like Williams Sonoma, Pottery Barn, and West Elm. This diversified portfolio caters to cooking, dining, entertaining, and home furnishing needs, reinforcing its core mission of enhancing the home experience across demographics.
The company’s revenue engine balances physical retail—544 stores across the Americas, Europe, and Asia—with robust e-commerce platforms and direct-mail catalogs. It monetizes through hardware sales, complemented by premium services like made-to-order furniture and innovative AR tools for home design. This blend creates a durable economic moat rooted in brand loyalty and multi-channel reach, shaping the specialty retail landscape for years to come.
Financial Performance & Fundamental Metrics
I analyze Williams-Sonoma’s income statement, key financial ratios, and dividend payout policy to reveal its earnings quality and capital return strategy.
Income Statement
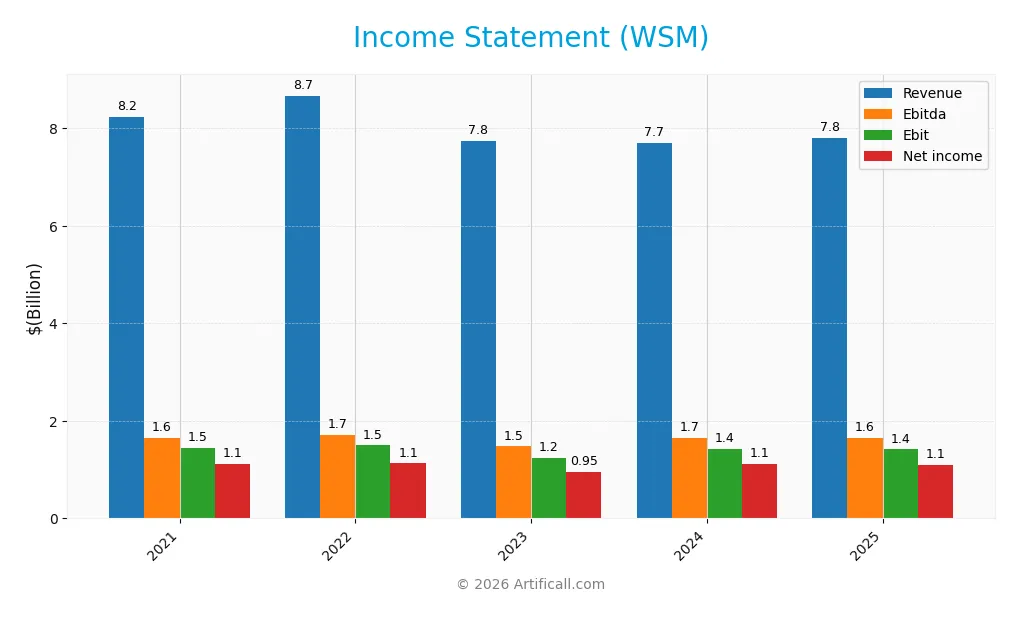
The table below summarizes Williams-Sonoma, Inc.’s key income statement metrics over the past five fiscal years, providing a clear view of its financial performance trajectory.
| 2021 | 2022 | 2023 | 2024 | 2025 | |
|---|---|---|---|---|---|
| Revenue | 8.25B | 8.67B | 7.75B | 7.71B | 7.81B |
| Cost of Revenue | 4.61B | 5.00B | 4.45B | 4.13B | 4.20B |
| Operating Expenses | 2.18B | 2.18B | 2.06B | 2.15B | 2.19B |
| Gross Profit | 3.63B | 3.68B | 3.30B | 3.58B | 3.60B |
| EBITDA | 1.65B | 1.71B | 1.48B | 1.66B | 1.65B |
| EBIT | 1.45B | 1.50B | 1.24B | 1.43B | 1.42B |
| Interest Expense | 1.87M | 0 | 0 | 0 | 0 |
| Net Income | 1.13B | 1.13B | 950M | 1.13B | 1.09B |
| EPS | 7.58 | 8.29 | 7.35 | 8.91 | 8.96 |
| Filing Date | 2022-03-28 | 2023-03-24 | 2024-03-20 | 2025-03-27 | 2026-03-26 |
Income Statement Evolution
Williams-Sonoma’s revenue shows a slight decline of 5.33% over 2021–2025, with a marginal 1.24% growth in the last year, signaling deceleration. Net income also decreased by 3.36% in the period, with a 4.45% net margin contraction recently. Margins remain mostly stable, with a gross margin near 46%, reflecting consistent cost control.
Is the Income Statement Favorable?
The 2025 income statement reveals favorable margin levels: gross margin at 46.15%, EBIT margin at 18.13%, and net margin at 13.94%. Zero interest expense supports profitability. However, recent declines in EBIT and net margins, alongside minimal revenue growth, temper enthusiasm. Overall, fundamentals appear mixed, with slight margin stability offset by unfavorable growth trends.
Financial Ratios
The table below summarizes key financial ratios for Williams-Sonoma, Inc. over the last five fiscal years, illustrating its profitability, liquidity, leverage, and valuation metrics:
| Ratios | 2021 | 2022 | 2023 | 2024 | 2025 |
|---|---|---|---|---|---|
| Net Margin | 13.7% | 13.0% | 12.5% | 14.6% | 13.9% |
| ROE | 67.7% | 66.3% | 44.6% | 52.5% | 52.3% |
| ROIC | 36.7% | 34.6% | 25.6% | 29.9% | 28.8% |
| P/E | 10.6 | 8.1 | 13.1 | 23.7 | 23.9 |
| P/B | 7.16 | 5.40 | 5.87 | 12.5 | 12.5 |
| Current Ratio | 1.31 | 1.24 | 1.45 | 1.44 | 1.39 |
| Quick Ratio | 0.61 | 0.35 | 0.78 | 0.74 | 0.64 |
| D/E | 0.77 | 0.85 | 0.65 | 0.63 | 0.70 |
| Debt-to-Assets | 27.8% | 31.0% | 26.4% | 25.4% | 26.9% |
| Interest Coverage | 779 | 0 | 0 | 0 | 0 |
| Asset Turnover | 1.78 | 1.86 | 1.47 | 1.45 | 1.44 |
| Fixed Asset Turnover | 4.02 | 3.69 | 3.46 | 3.49 | 3.30 |
| Dividend Yield | 1.57% | 2.37% | 1.86% | 1.05% | 1.22% |
Evolution of Financial Ratios
Williams-Sonoma’s Return on Equity (ROE) remained robust at 52.26% in 2025, showing consistent strength over the period. The Current Ratio held steady around 1.39, indicating stable liquidity. The Debt-to-Equity ratio fluctuated moderately, settling at 0.7 in 2025, reflecting balanced leverage. Profitability margins showed slight variations but overall remained solid and consistent.
Are the Financial Ratios Favorable?
The 2025 ratios present a slightly favorable outlook. Profitability metrics, including net margin (13.94%) and ROE (52.26%), rank as favorable, supported by a strong return on invested capital (28.83%). Liquidity ratios like the current ratio (1.39) are neutral, while the quick ratio (0.64) signals caution. Leverage is moderate, with debt-to-assets at 26.92% favorable, and market multiples show mixed signals—P/E is neutral, but P/B is unfavorable.
Shareholder Return Policy
Williams-Sonoma maintains a consistent dividend payout ratio near 25-30%, with a dividend yield around 1.2%. The dividend per share has steadily increased from $1.26 in 2021 to $2.61 in 2025, supported by free cash flow coverage above 80%. The company also engages in share buybacks, complementing its dividend distribution strategy.
This balanced approach shows prudent capital allocation, avoiding excessive payouts while returning value to shareholders. The coverage by operating cash flows and free cash flow suggests sustainability, aligning with long-term shareholder value creation. However, investors should monitor payout ratio trends to mitigate distribution risks.
Score analysis
Here is a radar chart illustrating Williams-Sonoma, Inc.’s key financial scores across valuation, profitability, and leverage metrics:
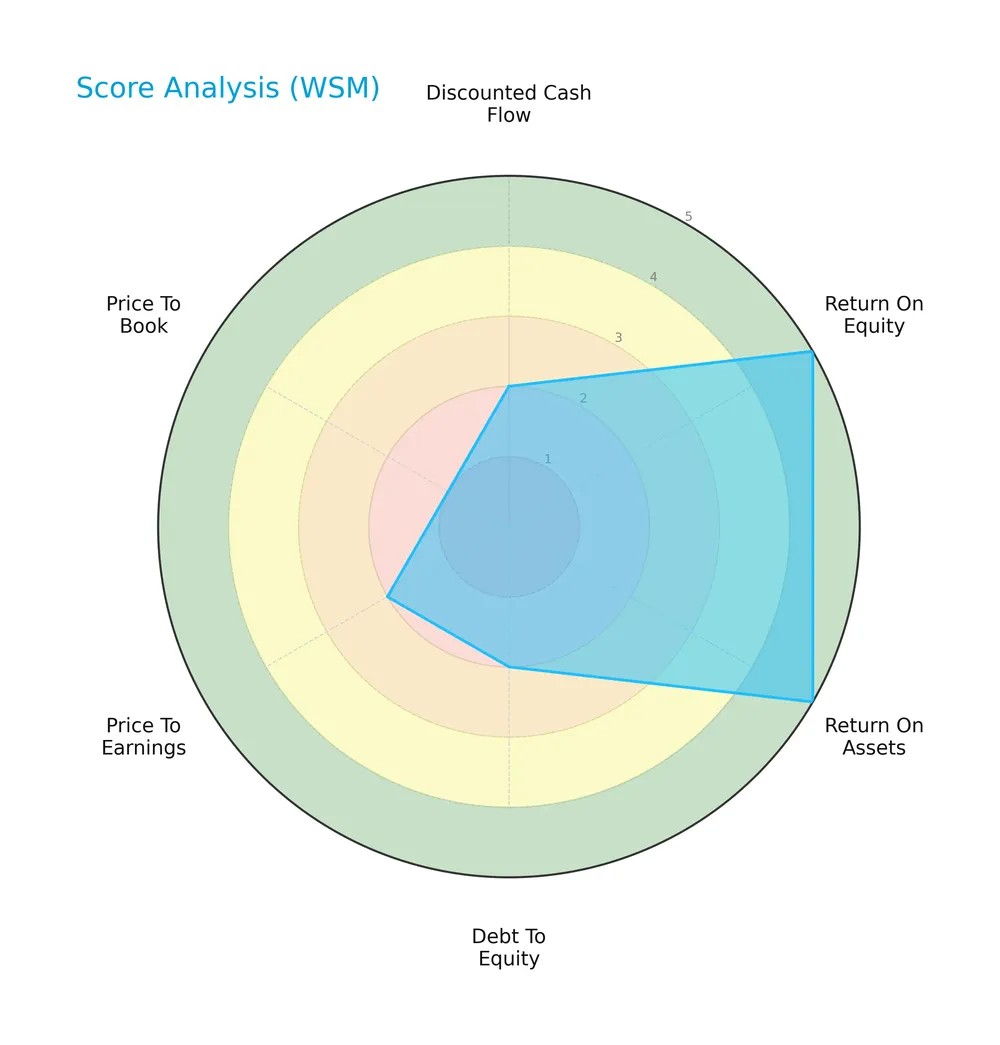
The company scores very favorably on return on equity and assets, indicating strong profitability. However, discounted cash flow, debt-to-equity, price-to-earnings, and price-to-book scores are unfavorable to very unfavorable, reflecting valuation and leverage concerns.
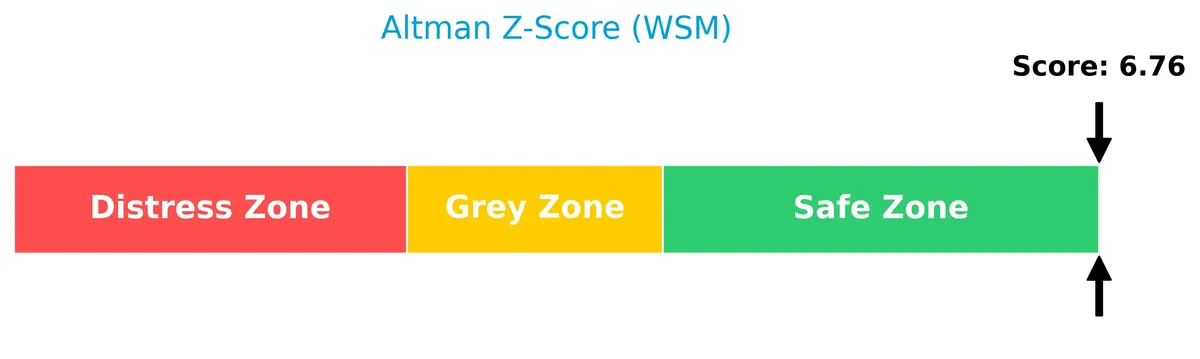
Analysis of the company’s bankruptcy risk
Williams-Sonoma, Inc. is in the safe zone according to its Altman Z-Score, indicating very low bankruptcy risk at this time:
Is the company in good financial health?
The Piotroski Score chart provides insight into Williams-Sonoma’s overall financial strength based on profitability, leverage, liquidity, and efficiency:

With an average Piotroski Score of 6, the company exhibits moderate financial health, suggesting stable but not exceptional fundamentals.
Competitive Landscape & Sector Positioning
This analysis explores Williams-Sonoma, Inc.’s position within the specialty retail sector, focusing on key market dynamics. I will assess whether Williams-Sonoma holds a competitive advantage over its main industry peers.
Strategic Positioning
Williams-Sonoma, Inc. maintains a diversified product portfolio spanning cookware, home furnishings, and decor across multiple brands. Its geographic exposure is concentrated in the US with 502 stores, supplemented by a modest international presence through 42 stores and e-commerce in select countries.
Revenue by Segment
The pie chart illustrates Williams-Sonoma, Inc.’s revenue distribution by product segment for fiscal year 2025, highlighting the relative contribution of each business unit.
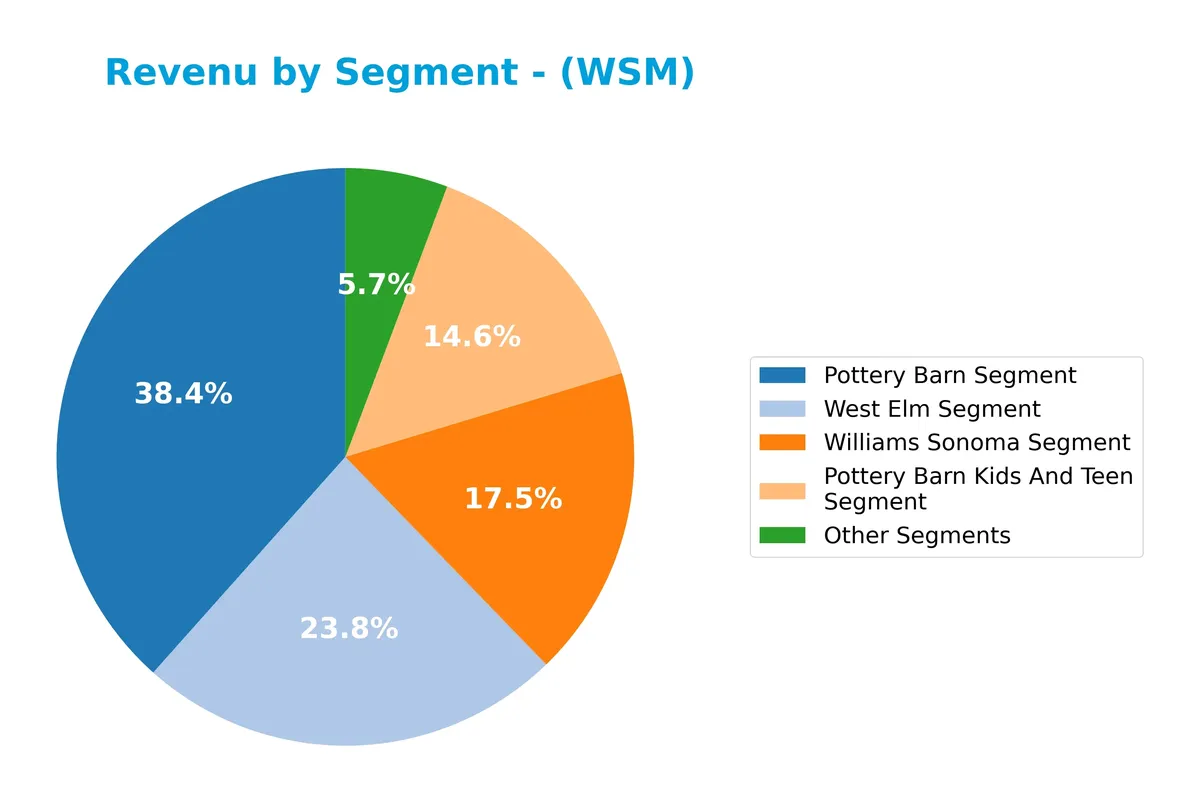
In 2025, Pottery Barn leads with $3B revenue, maintaining its dominant role despite a slight decline from prior years. West Elm and Williams Sonoma segments show steady growth, reaching $1.9B and $1.4B respectively. Pottery Barn Kids and Teen also grows modestly to $1.1B. Other Segments remain under $500M, indicating concentration risk around core brands but stable performance overall.
Key Products & Brands
Williams-Sonoma, Inc. offers a diverse portfolio of home-related products and lifestyle brands, detailed below:
| Product | Description |
|---|---|
| Williams Sonoma | Cooking, dining, entertaining products including cookware, tools, electrics, cutlery, and cookbooks. |
| Pottery Barn | Home furnishings, decorative accessories, furniture, bedding, lighting, rugs, and table essentials. |
| West Elm | Home decor products with a contemporary style. |
| Pottery Barn Kids And Teen | Kids accessories, organic bedding, and multi-purpose furniture for teens. |
| Rejuvenation | Made-to-order lighting, hardware, furniture, and home decor inspired by history. |
| Mark and Graham | Women’s and men’s accessories, travel, entertaining, bar items, home decor, and seasonal products. |
| Other Segments | Additional miscellaneous products and services within the company’s portfolio. |
Williams-Sonoma’s brand portfolio spans from premium kitchenware to upscale home furnishings and decor. Each brand targets specific customer segments, strengthening the company’s omni-channel specialty retail offering.
Main Competitors
There are 10 competitors in total, with the table below listing the top 10 leaders by market capitalization:
| Competitor | Market Cap. |
|---|---|
| Amazon.com, Inc. | 2.42T |
| Alibaba Group Holding Limited | 340B |
| PDD Holdings Inc. | 159B |
| MercadoLibre, Inc. | 102B |
| eBay Inc. | 39.4B |
| Ulta Beauty, Inc. | 27.8B |
| Tractor Supply Company | 26.9B |
| Williams-Sonoma, Inc. | 23.0B |
| Genuine Parts Company | 17.2B |
| Best Buy Co., Inc. | 14.5B |
Williams-Sonoma ranks 8th among its top 10 competitors. It holds just 0.86% of the market cap of the leader, Amazon.com. The company sits below both the average market cap of 317B for the top 10 and the sector median of 33.6B. It maintains a 28.5% gap to the next competitor above, Tractor Supply Company, indicating a notable scale difference.
Comparisons with competitors
Check out how we compare the company to its competitors:
Does WSM have a competitive advantage?
Williams-Sonoma, Inc. demonstrates a competitive advantage by generating returns on invested capital (ROIC) significantly above its cost of capital. This indicates efficient capital use and value creation, despite a declining ROIC trend over 2021-2025.
Looking ahead, the company’s diverse omni-channel retail brands and expansion into international markets offer growth opportunities. Investments in 3-D imaging and augmented reality platforms could further strengthen its position in home furnishings and décor.
SWOT Analysis
This SWOT analysis highlights Williams-Sonoma’s core strategic strengths, weaknesses, opportunities, and threats to guide investment decisions.
Strengths
- strong brand portfolio
- high ROIC of 28.8% well above WACC
- solid net margin near 14%
Weaknesses
- declining revenue trend over 5 years
- unfavorable price-to-book ratio
- quick ratio below 1 signals liquidity risk
Opportunities
- expansion in international markets
- growth in e-commerce and omni-channel retail
- leveraging augmented reality for customer experience
Threats
- intense specialty retail competition
- economic sensitivity of consumer discretionary spending
- rising input costs pressuring margins
Williams-Sonoma’s strong profitability and brand moat underpin value creation despite recent revenue declines. The firm must address liquidity risks and market pressures while exploiting digital and geographic growth avenues. Strategic focus on operational efficiency and innovation remains critical.
Stock Price Action Analysis
The following weekly chart displays Williams-Sonoma, Inc.’s stock price movements over the past 12 months, highlighting key volatility and trend shifts:
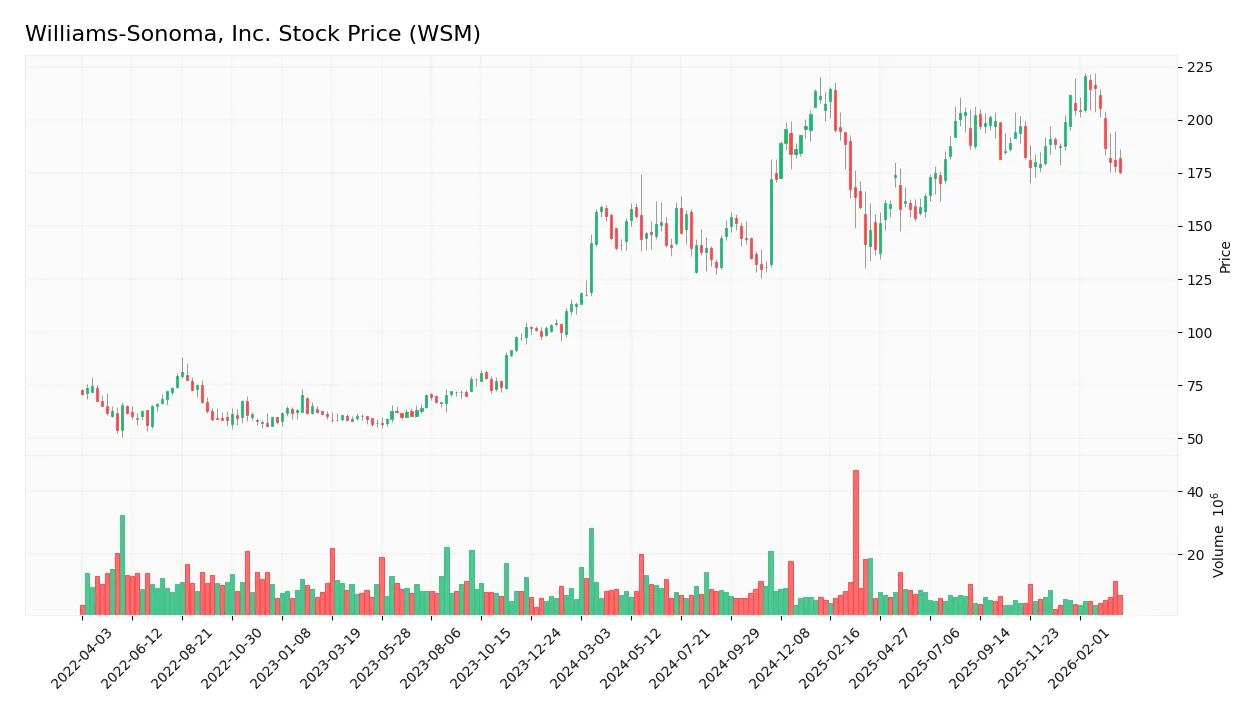
Trend Analysis
Over the past 12 months, WSM’s stock rose 15.06%, indicating a bullish trend with decelerating momentum. The 24.84 standard deviation reflects high volatility. The stock peaked at 220.67 and bottomed at 129.8. However, the recent three-month trend reversed, falling 11.93%, signaling short-term weakness.
Volume Analysis
Trading volumes over the last three months show a seller-driven pattern, with buyer dominance at 35.21%. Volume is decreasing, suggesting waning market participation and increasing bearish sentiment among investors.
Target Prices
Analysts set a confident target consensus for Williams-Sonoma, Inc., reflecting solid growth expectations.
| Target Low | Target High | Consensus |
|---|---|---|
| 175 | 220 | 204 |
The target range from 175 to 220 shows a bullish stance, with consensus at 204 signaling strong upside potential.

Don’t Let Luck Decide Your Entry Point
Optimize your entry points with our advanced ProRealTime indicators. You’ll get efficient buy signals with precise price targets for maximum performance. Start outperforming now!
Analyst & Consumer Opinions
I will review recent analyst ratings and consumer feedback to provide insight into Williams-Sonoma, Inc.’s market perception.
Stock Grades
The latest verified analyst grades for Williams-Sonoma, Inc. reveal a consistent pattern of maintained ratings across respected firms:
| Grading Company | Action | New Grade | Date |
|---|---|---|---|
| Barclays | Maintain | Equal Weight | 2026-03-20 |
| TD Cowen | Maintain | Buy | 2026-03-19 |
| Telsey Advisory Group | Maintain | Outperform | 2026-03-19 |
| RBC Capital | Maintain | Outperform | 2026-03-19 |
| Baird | Maintain | Outperform | 2026-03-19 |
| Telsey Advisory Group | Maintain | Outperform | 2026-03-12 |
| UBS | Maintain | Neutral | 2026-03-11 |
| Citigroup | Maintain | Neutral | 2026-03-06 |
| Evercore ISI Group | Maintain | In Line | 2026-02-10 |
| Evercore ISI Group | Maintain | In Line | 2026-02-03 |
Most analysts maintain positive outlooks with multiple Outperform and Buy ratings. The consensus remains a Hold, reflecting balanced investor sentiment and stable expectations.
Consumer Opinions
Williams-Sonoma, Inc. inspires mixed consumer sentiment, reflecting its upscale market positioning and evolving digital presence.
| Positive Reviews | Negative Reviews |
|---|---|
| High-quality, durable kitchenware that lasts. | Premium prices make products less accessible. |
| Excellent customer service with quick responses. | Shipping delays frustrate some buyers. |
| Stylish and innovative home decor options. | Limited availability of certain popular items. |
Consumers consistently praise Williams-Sonoma for product quality and customer support. However, pricing and occasional logistics issues remain notable drawbacks, suggesting room for operational improvements.
Risk Analysis
Below is a summary of Williams-Sonoma’s key risks, categorized by type, likelihood, and potential impact:
| Category | Description | Probability | Impact |
|---|---|---|---|
| Market Risk | High beta (1.56) indicates sensitivity to market volatility. | High | Medium |
| Liquidity Risk | Quick ratio of 0.64 signals potential short-term liquidity strain. | Medium | Medium |
| Valuation Risk | Elevated P/B of 12.48 suggests overvaluation relative to assets. | Medium | High |
| Debt Risk | Moderate D/E ratio at 0.7 and favorable debt to assets at 26.9%. | Low | Low |
| Competitive Risk | Specialty retail sector faces intense digital disruption pressure. | Medium | High |
Williams-Sonoma’s most pressing risks are market volatility due to a beta well above 1 and valuation stretched well beyond sector norms. The liquidity concern reflected in the low quick ratio merits attention, especially in economic downturns. Despite strong profitability and a safe Altman Z-score, investors must weigh these vulnerabilities carefully.
Should You Buy Williams-Sonoma, Inc.?
Williams-Sonoma appears to be a moderately profitable company with a slightly favorable moat, indicated by value creation despite declining ROIC. Its leverage profile seems manageable, yet valuation metrics raise caution. Overall, the firm could be seen as a B-rated investment with balanced strengths and risks.
Strength & Efficiency Pillars
Williams-Sonoma, Inc. exhibits strong profitability with a net margin of 13.94% and a robust return on equity at 52.26%. Its return on invested capital (ROIC) stands at 28.83%, significantly exceeding the weighted average cost of capital (WACC) of 10.89%, confirming the company as a clear value creator. Operational efficiency is supported by favorable asset turnover ratios and an interest coverage ratio effectively infinite, reflecting solid operational control and low financial burden.
Weaknesses and Drawbacks
The company is not in financial distress, with a healthy Altman Z-Score of 6.76 placing it firmly in the safe zone. However, valuation metrics raise caution: a price-to-book ratio of 12.48 and a price-to-earnings ratio of 23.88 suggest a premium price that may limit upside. Leverage appears moderate with a debt-to-equity ratio of 0.7, but liquidity metrics are mixed; the quick ratio at 0.64 is unfavorable, indicating potential short-term liquidity constraints. Recent market activity shows seller dominance at 35.21%, indicating short-term investor hesitation.
Our Final Verdict about Williams-Sonoma, Inc.
Williams-Sonoma, Inc. presents a fundamentally strong profile with clear value creation and solid profitability. Despite a bullish long-term trend, recent seller dominance suggests investors might consider a wait-and-see approach for a more favorable entry point. The premium valuation and mixed liquidity metrics caution against aggressive positioning, though the company’s operational strengths could appeal to patient, risk-tolerant investors.
Disclaimer: This content is for informational purposes only and does not constitute financial, investment, or other professional advice. Investing in financial markets involves a significant risk of loss, and past performance is not indicative of future results.
Additional Resources
- Insider Selling: Williams-Sonoma (NYSE:WSM) CFO Sells 32,684 Shares of Stock – MarketBeat (Mar 28, 2026)
- Williams-Sonoma (WSM) Pottery Barn president granted 5,522 restricted stock units – Stock Titan (Mar 27, 2026)
- Insider Sell: Jeffrey Howie Sells Shares of Williams-Sonoma Inc (WSM) – GuruFocus (Mar 28, 2026)
- Here is What to Know Beyond Why Williams-Sonoma, Inc. (WSM) is a Trending Stock – Yahoo Finance (Mar 25, 2026)
- Williams-Sonoma Q4 earnings top estimates, revenues miss, comps up Y/Y – MSN (Mar 27, 2026)
For more information about Williams-Sonoma, Inc., please visit the official website: williams-sonomainc.com