Home > Analyses > Real Estate > Weyerhaeuser Company
Weyerhaeuser Company shapes the backbone of North America’s timber industry by managing 11 million acres of sustainable forests. As one of the largest private timberland owners and wood product manufacturers, it blends deep-rooted expertise with a commitment to environmental standards. Its influence extends from construction sites to consumer homes. Now, I ask: does Weyerhaeuser’s strong market position and steady cash flow justify its current valuation and growth outlook?

Table of contents
Business Model & Company Overview
Weyerhaeuser Company, founded in 1900 and headquartered in Seattle, stands as one of the largest private timberland owners worldwide. Its core business integrates sustainable forestry management with manufacturing wood products, forming a cohesive ecosystem that balances resource stewardship and industrial output. The company operates as a real estate investment trust, emphasizing long-term value and environmental compliance.
Weyerhaeuser’s revenue engine derives from managing roughly 11M acres of timberlands across the U.S. and Canada, combined with wood product manufacturing that serves global markets. This blend of land assets and production capabilities underpins stable cash flows and recurring value. Its competitive advantage lies in vast timberland control and sustainable practices, securing a formidable economic moat that shapes the future of specialty REITs and forestry industries.
Financial Performance & Fundamental Metrics
I analyze Weyerhaeuser Company’s income statement, key financial ratios, and dividend payout policy to assess its overall financial health and shareholder value.
Income Statement
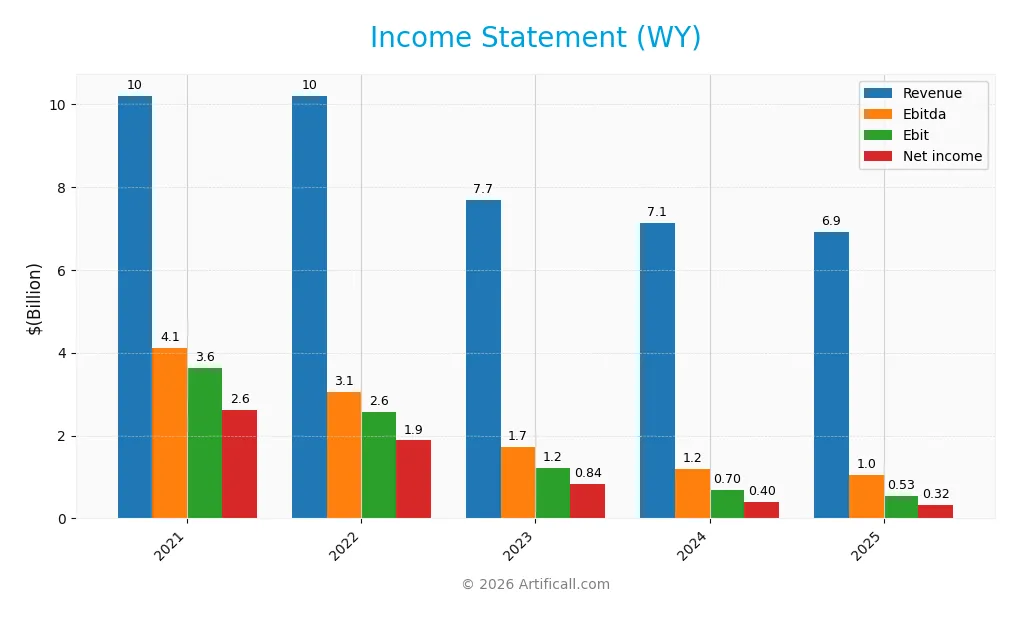
The table below presents Weyerhaeuser Company’s key income statement figures for fiscal years 2021 through 2025, expressed in USD.
| 2021 | 2022 | 2023 | 2024 | 2025 | |
|---|---|---|---|---|---|
| Revenue | 10.2B | 10.2B | 7.7B | 7.1B | 6.9B |
| Cost of Revenue | 6.1B | 6.6B | 6.0B | 5.8B | 6.4B |
| Operating Expenses | 455M | 540M | 496M | 628M | 51M |
| Gross Profit | 4.1B | 3.6B | 1.7B | 1.3B | 516M |
| EBITDA | 4.1B | 3.1B | 1.7B | 1.2B | 1.0B |
| EBIT | 3.6B | 2.6B | 1.2B | 696M | 533M |
| Interest Expense | 313M | 270M | 280M | 269M | 273M |
| Net Income | 2.6B | 1.9B | 839M | 396M | 324M |
| EPS | 3.48 | 2.53 | 1.15 | 0.54 | 0.45 |
| Filing Date | 2022-02-18 | 2023-02-17 | 2024-02-16 | 2025-02-14 | 2026-02-13 |
Income Statement Evolution
Weyerhaeuser’s revenue declined by 3.1% from 2024 to 2025, continuing a downward trend since 2021. Gross profit dropped sharply by 60.7% in the last year, compressing gross margins to a neutral 7.47%. EBIT and net income also fell, with EBIT margin steady at 7.72% and net margin at 4.69%, both neutral but reflecting margin pressure.
Is the Income Statement Favorable?
The 2025 income statement shows unfavorable fundamentals. Revenue and net income decreased significantly, with net income down 87.6% since 2021. Despite a favorable interest expense ratio at 3.95%, overall profitability and earnings per share declined. Operating expenses scaled down proportionally to revenue, but this was insufficient to offset falling margins and earnings declines.
Financial Ratios
The table below presents Weyerhaeuser Company’s key financial ratios for 2021 through 2025, highlighting profitability, liquidity, leverage, and market valuation metrics:
| Ratios | 2021 | 2022 | 2023 | 2024 | 2025 |
|---|---|---|---|---|---|
| Net Margin | 25.56% | 18.46% | 10.93% | 5.56% | 4.69% |
| ROE | 24.21% | 17.49% | 8.20% | 4.07% | 3.44% |
| ROIC | 17.10% | 15.13% | 6.55% | 4.02% | 2.93% |
| P/E | 11.84 | 12.23 | 30.32 | 51.78 | 52.74 |
| P/B | 2.87 | 2.14 | 2.49 | 2.11 | 1.81 |
| Current Ratio | 3.29 | 1.58 | 2.94 | 1.79 | 1.29 |
| Quick Ratio | 2.74 | 1.26 | 2.22 | 1.17 | 1.29 |
| D/E | 0.48 | 0.47 | 0.50 | 0.53 | 0.59 |
| Debt-to-Assets | 29.02% | 29.27% | 29.96% | 30.87% | 33.54% |
| Interest Coverage | 11.64 | 11.41 | 4.24 | 2.55 | 1.70 |
| Asset Turnover | 0.58 | 0.59 | 0.45 | 0.43 | 0.42 |
| Fixed Asset Turnover | 0.72 | 0.71 | 0.53 | 0.49 | 2.50 |
| Dividend Yield | 2.86% | 7.03% | 4.78% | 3.34% | 3.55% |
Evolution of Financial Ratios
Return on Equity (ROE) declined sharply from 24.2% in 2021 to 3.44% in 2025, signaling weakening profitability. The Current Ratio showed volatility, peaking above 3.2 in 2021 before falling to 1.29 in 2025, indicating reduced liquidity. Debt-to-Equity Ratio rose modestly to 0.59 in 2025, reflecting stable but cautious leverage.
Are the Financial Ratios Favorable?
Profitability ratios such as net margin (4.69%) and ROE (3.44%) are unfavorable, pointing to margin pressure and weak returns. Liquidity is mixed: quick ratio is favorable at 1.29, but current ratio remains neutral. Leverage ratios, including debt-to-equity (0.59) and debt-to-assets (33.54%), are neutral. Market multiples like PE ratio (52.74) are unfavorable, while dividend yield (3.55%) is favorable. Overall, the financial ratios appear slightly unfavorable.
Shareholder Return Policy
Weyerhaeuser maintains a dividend policy with a payout ratio exceeding 100%, paying $0.84 per share in 2025 with a 3.55% yield. The dividend is partially covered by free cash flow, raising sustainability concerns amid elevated payout levels.
The company also pursues share buybacks, complementing dividends but increasing capital return risks if cash flow weakens. This policy supports shareholder returns but requires careful monitoring to ensure long-term value preservation.
Score analysis
The radar chart below illustrates Weyerhaeuser Company’s key financial scores across valuation and profitability metrics:
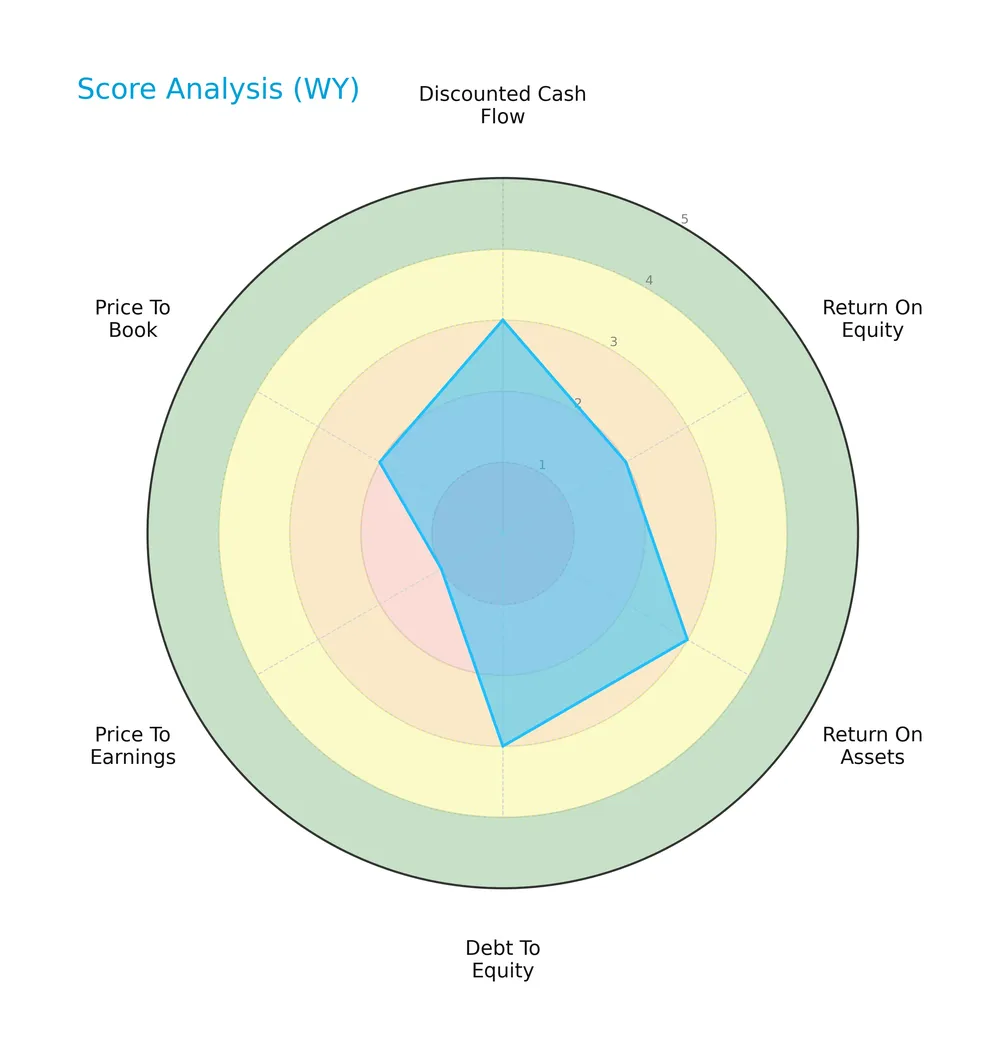
The company shows moderate scores in discounted cash flow, return on assets, and debt to equity. However, return on equity and price to book ratios remain unfavorable. The price to earnings score is very unfavorable, indicating valuation concerns.
Analysis of the company’s bankruptcy risk
Weyerhaeuser’s Altman Z-Score places it in the grey zone, signaling a moderate risk of bankruptcy:

Is the company in good financial health?
This Piotroski diagram highlights Weyerhaeuser’s financial strength based on nine key criteria:
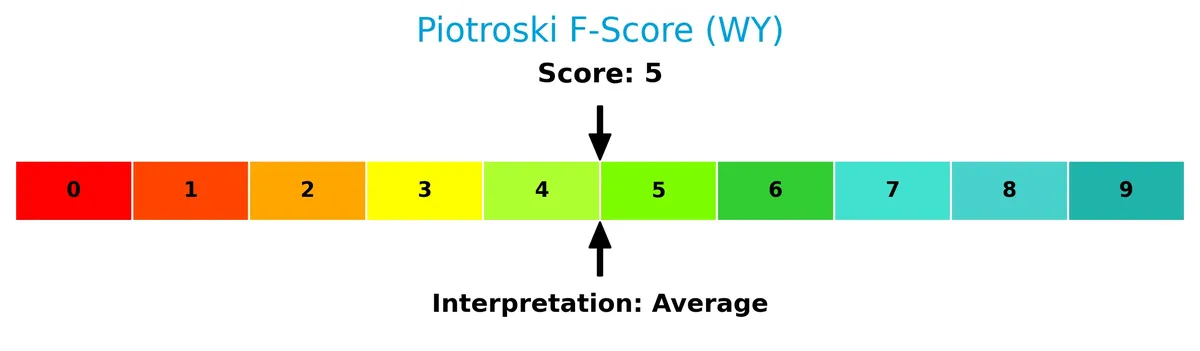
With a Piotroski score of 5, the company is in average financial health, showing neither clear strength nor weakness in profitability, leverage, and liquidity measures.
Competitive Landscape & Sector Positioning
This sector analysis examines Weyerhaeuser Company’s strategic positioning, revenue segments, key products, and main competitors. I will assess whether Weyerhaeuser holds a competitive advantage within the real estate investment trust (REIT) specialty sector.
Strategic Positioning
Weyerhaeuser concentrates primarily on wood products (4.96B in 2025) and timberlands (2.09B), with smaller renewable energy revenue (454M). Its geographic exposure centers on the U.S. (6B), followed by Canada (543M) and Japan (271M), reflecting a North American-focused, product-diversified portfolio.
Revenue by Segment
This pie chart illustrates Weyerhaeuser Company’s revenue breakdown by segment for fiscal year 2025, highlighting contributions from Timberlands, Wood Products, and R E E N R.
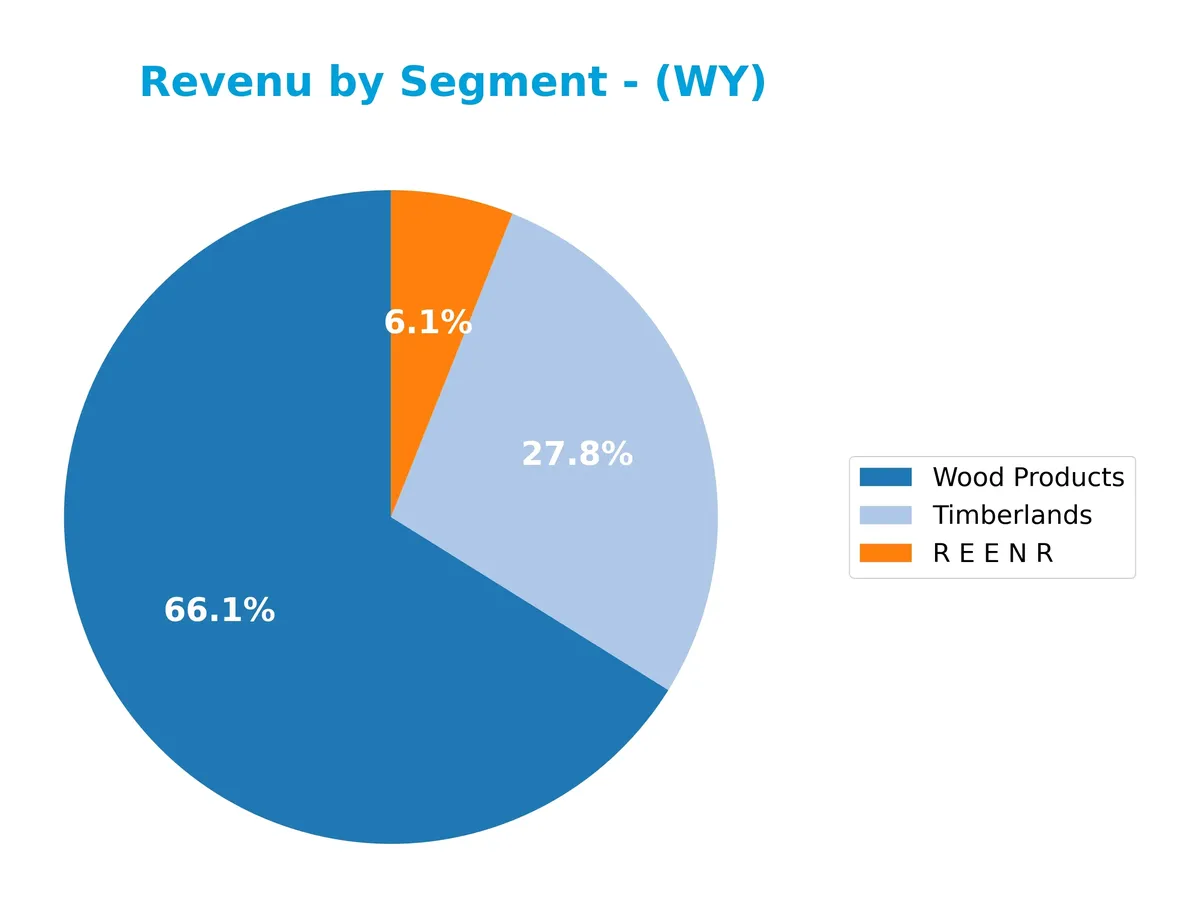
Wood Products leads with $4.96B in revenue, followed by Timberlands at $2.09B and R E E N R at $454M. The data shows a shift from 2024, where Wood Products slightly declined from $5.22B, but Timberlands surged from $1.51B. This suggests a rebalancing toward Timberlands, reducing concentration risk and signaling strategic diversification in 2025.
Key Products & Brands
The following table outlines Weyerhaeuser Company’s key products and brands with their core descriptions:
| Product | Description |
|---|---|
| Timberlands | Owns or controls approximately 11M acres of timberlands in the U.S., managed sustainably. |
| Wood Products | One of North America’s largest manufacturers of wood products serving global customers. |
| R E E N R | Segment reported revenues varying over years, specific product details not disclosed. |
Weyerhaeuser’s business centers on timberland ownership and wood product manufacturing. Timberlands provide sustainable raw materials. Wood products represent the largest revenue source. The “R E E N R” segment lacks detailed public product description.
Main Competitors
There are 6 competitors in the Real Estate REIT – Specialty industry, with the table showing the top 6 leaders by market capitalization:
| Competitor | Market Cap. |
|---|---|
| American Tower Corporation | 81.8B |
| Equinix, Inc. | 74.5B |
| Crown Castle Inc. | 38.6B |
| Iron Mountain Incorporated | 24.6B |
| SBA Communications Corporation | 20.7B |
| Weyerhaeuser Company | 17.2B |
Weyerhaeuser ranks 6th among its competitors. Its market cap is 23.56% of the leader, American Tower Corporation. The company sits below both the average market cap of the top 10 (42.9B) and the median sector market cap (31.6B). It maintains a 7.32% gap below its nearest rival, SBA Communications.
Comparisons with competitors
Check out how we compare the company to its competitors:
Does Weyerhaeuser Company have a competitive advantage?
Weyerhaeuser Company currently lacks a competitive advantage, as it consistently destroys value with an ROIC well below its WACC and a sharply declining profitability trend. This very unfavorable moat status signals inefficient capital allocation and weakening returns over the 2021-2025 period.
Looking ahead, Weyerhaeuser’s extensive timberland holdings and manufacturing scale provide avenues to explore new markets and products. However, recent unfavorable revenue and profit growth raise concerns about the company’s ability to capitalize on these opportunities amid challenging industry dynamics.
SWOT Analysis
This SWOT analysis highlights Weyerhaeuser Company’s key strategic factors to guide investment decisions.
Strengths
- largest private timberland owner in US
- recognized sustainability standards
- stable dividend yield of 3.55%
Weaknesses
- declining revenue and net income over 5 years
- ROIC below WACC, destroying value
- unfavorable profitability metrics
Opportunities
- expanding sustainable wood product demand
- potential for efficiency improvements
- geographic diversification in North America and Asia
Threats
- commodity price volatility
- regulatory risks in forestry and environmental policies
- economic slowdown impacting construction
Weyerhaeuser’s strengths lie in its scale and sustainability credentials, but persistent declines in profitability and value destruction pose risks. The company must leverage growth opportunities while managing sector cyclicality and regulatory pressures.
Stock Price Action Analysis
The weekly price chart shows Weyerhaeuser Company’s stock movement over the past year, highlighting key highs and lows:
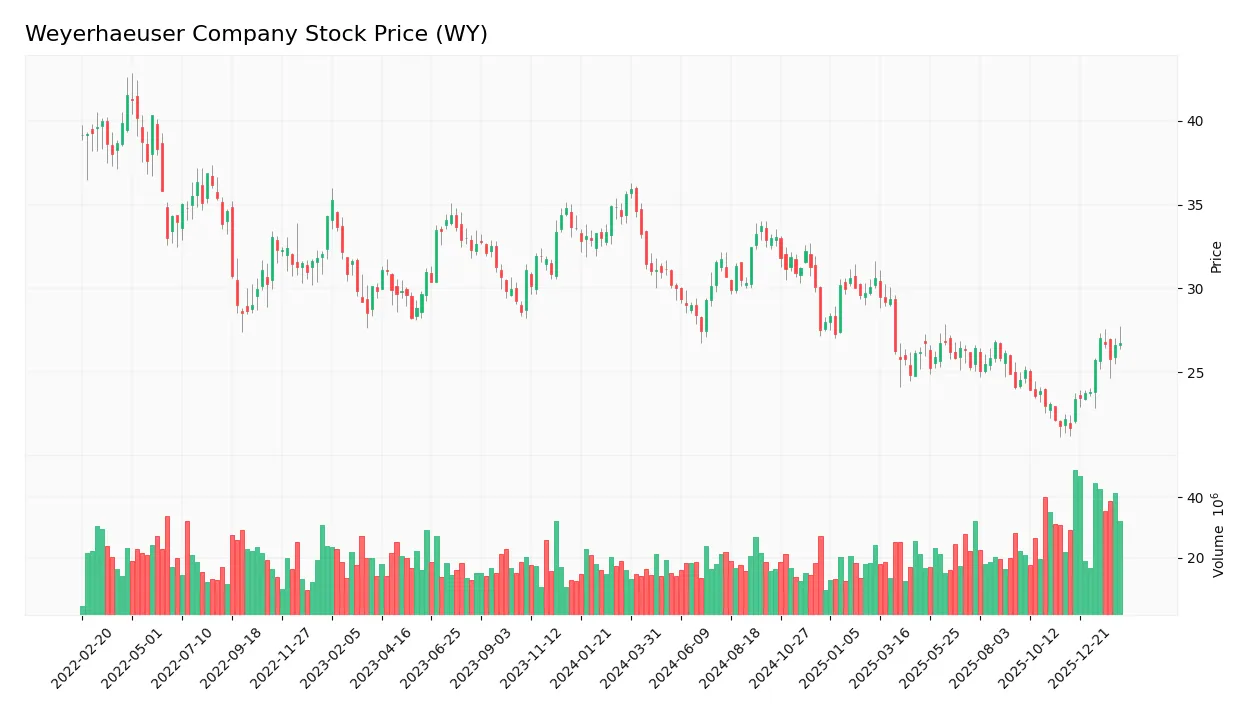
Trend Analysis
Over the past 12 months, WY’s stock price fell by 24.88%, indicating a clear bearish trend with accelerating decline. The price ranged between 35.91 and 21.69, showing heightened volatility at 3.31 standard deviation. However, a recent 2.5-month period shows a 20.44% rebound with moderate volatility (1.82), suggesting a short-term recovery.
Volume Analysis
Trading volume has increased recently, with a total buyer volume of 314M against seller volume of 103M in the last 2.5 months. Buyer dominance at 75.29% signals strong buying interest, reflecting heightened investor participation and potentially growing confidence during the recent upward price move.
Target Prices
Analysts set a clear target consensus for Weyerhaeuser Company, reflecting moderate upside potential.
| Target Low | Target High | Consensus |
|---|---|---|
| 28 | 33 | 30.2 |
The consensus target price of $30.2 suggests steady growth expectations, with a reasonable range between $28 and $33. This aligns with historical valuation trends in the timber sector.

Don’t Let Luck Decide Your Entry Point
Optimize your entry points with our advanced ProRealTime indicators. You’ll get efficient buy signals with precise price targets for maximum performance. Start outperforming now!
Analyst & Consumer Opinions
This section examines analyst ratings and consumer feedback to provide insight into Weyerhaeuser Company’s market perception.
Stock Grades
Here are the latest verified stock grades for Weyerhaeuser Company from leading financial institutions:
| Grading Company | Action | New Grade | Date |
|---|---|---|---|
| Citigroup | Maintain | Buy | 2026-02-13 |
| Truist Securities | Maintain | Hold | 2026-02-02 |
| DA Davidson | Maintain | Buy | 2026-02-02 |
| Citigroup | Maintain | Buy | 2026-01-14 |
| Truist Securities | Maintain | Hold | 2026-01-06 |
| CIBC | Maintain | Outperform | 2025-12-12 |
| B of A Securities | Downgrade | Neutral | 2025-11-17 |
| JP Morgan | Maintain | Overweight | 2025-11-14 |
| Citigroup | Maintain | Buy | 2025-11-12 |
| RBC Capital | Maintain | Outperform | 2025-11-03 |
The consensus reflects a predominantly positive stance, with most firms maintaining Buy or Outperform ratings. A few Hold and Neutral grades indicate some caution among analysts.
Consumer Opinions
Weyerhaeuser Company consistently draws mixed consumer sentiments, reflecting its complex position in the timber and forestry sector.
| Positive Reviews | Negative Reviews |
|---|---|
| Reliable product quality and sustainable sourcing | Customer service response times are slow |
| Competitive pricing compared to industry peers | Delivery delays reported during peak seasons |
| Strong commitment to environmental responsibility | Limited product variety in some regions |
Overall, consumers appreciate Weyerhaeuser’s focus on sustainability and quality. However, recurring complaints about service speed and regional product availability suggest areas for operational improvement.
Risk Analysis
Below is a summary of key risks facing Weyerhaeuser Company, categorized by type, with assessed probability and impact:
| Category | Description | Probability | Impact |
|---|---|---|---|
| Financial Risk | Low ROIC (2.93%) vs. higher WACC (7.56%) indicates weak capital returns. | High | High |
| Market Risk | Elevated P/E ratio (52.74) signals overvaluation vulnerability. | Medium | Medium |
| Liquidity Risk | Interest coverage ratio at 1.95 suggests limited buffer for debt servicing. | Medium | High |
| Operational Risk | Asset turnover (0.42) is low, implying inefficient asset use. | High | Medium |
| Dividend Risk | Dependence on stable cash flow to sustain 3.55% dividend yield. | Medium | Medium |
I observe that Weyerhaeuser’s most pressing risks lie in its subpar profitability metrics amid a cost of capital that outpaces returns. This dynamic heightens financial strain, especially given the marginal interest coverage ratio. The stock’s lofty valuation invites market corrections. Prudence suggests monitoring cash flow stability closely to safeguard dividend payouts.
Should You Buy Weyerhaeuser Company?
Weyerhaeuser appears to have weakening operational efficiency with a declining ROIC and a very unfavorable moat. While its leverage profile might be manageable, profitability suggests value destruction. The overall B- rating reflects a cautiously moderate investment profile amid notable risks.
Strength & Efficiency Pillars
Weyerhaeuser Company posts modest operational margins, with a net margin of 4.69% and an EBIT margin of 7.72%, reflecting some efficiency in cost control. However, its return on invested capital (2.93%) trails well below the weighted average cost of capital (7.56%), signaling value erosion rather than creation. The return on equity stands low at 3.44%, further underscoring limited profitability. While interest expense remains favorable at 3.95%, these metrics collectively depict operational stability but weak capital efficiency.
Weaknesses and Drawbacks
The company resides in the Altman Z-Score grey zone at 2.28, signaling moderate bankruptcy risk and financial caution. Its valuation metrics alarm: a steep price-to-earnings ratio of 52.74 suggests an overvalued stock relative to earnings. The price-to-book ratio at 1.81 is neutral but does not offset P/E concerns. Interest coverage is weak at 1.95, signaling vulnerability to rising debt costs. Additionally, a bearish long-term trend with a 24.88% price decline and only recent short-term bounce raises questions about sustained market confidence.
Our Final Verdict about Weyerhaeuser Company
Despite pockets of operational stability, Weyerhaeuser’s profile appears challenged by declining profitability and moderate solvency risk. The Altman Z-Score’s grey zone status suggests caution. Although recent trading shows strong buyer dominance (75.3%), the overall bearish trend and stretched valuation imply that the stock may appear too risky for conservative capital. Investors could consider waiting for clearer signs of financial resilience and valuation normalization before committing.
Disclaimer: This content is for informational purposes only and does not constitute financial, investment, or other professional advice. Investing in financial markets involves a significant risk of loss, and past performance is not indicative of future results.
Additional Resources
- Truist Lifts Price Target on Weyerhaeuser Company (WY) Despite Near-Term Volume Dip – Yahoo Finance (Feb 16, 2026)
- Weyerhaeuser Company Declares Dividend on Common Shares – PR Newswire (Feb 13, 2026)
- Weyerhaeuser Company (NYSE:WY) to Issue Quarterly Dividend of $0.21 – MarketBeat (Feb 13, 2026)
- Does Weyerhaeuser’s (WY) Cash Return Framework Reveal Its True Capital Allocation Priorities? – simplywall.st (Feb 13, 2026)
- Weyerhaeuser: Too Much Optimism About Recovery Potential (NYSE:WY) – Seeking Alpha (Feb 12, 2026)
For more information about Weyerhaeuser Company, please visit the official website: weyerhaeuser.com