Home > Analyses > Technology > Western Digital Corporation
Western Digital Corporation revolutionizes how the world stores and manages data, powering everything from personal devices to enterprise data centers. As a dominant force in computer hardware, WDC crafts cutting-edge hard drives and solid-state drives that fuel innovation across computing, gaming, and connected technologies. Renowned for its quality and market influence, the company stands at the crossroads of significant industry shifts. The key question now is whether Western Digital’s fundamentals continue to support its premium market valuation and growth ambitions.

Table of contents
Business Model & Company Overview
Western Digital Corporation, founded in 1970 and headquartered in San Jose, California, stands as a dominant player in the computer hardware industry. The company integrates a broad spectrum of data storage products—from hard disk drives and solid state drives to embedded flash storage—forming a cohesive ecosystem that serves personal computing, mobile, gaming, and industrial applications. With 51K employees, Western Digital leverages its global reach across the Americas, Europe, and Asia to maintain a robust presence in diverse technology markets.
The company’s revenue engine balances hardware sales with growing software and data center solutions, including enterprise SSDs and storage platforms tailored for critical applications like online transactions and data analysis. Western Digital’s portfolio extends to external storage devices and wireless drives, driving recurring value through its G-Technology, SanDisk, and WD brands. Its strong economic moat is built on comprehensive product diversification and strategic global distribution, positioning it to shape the future of data storage.
Financial Performance & Fundamental Metrics
In this section, I analyze Western Digital Corporation’s income statement, key financial ratios, and dividend payout policy to assess its financial health and investment appeal.
Income Statement
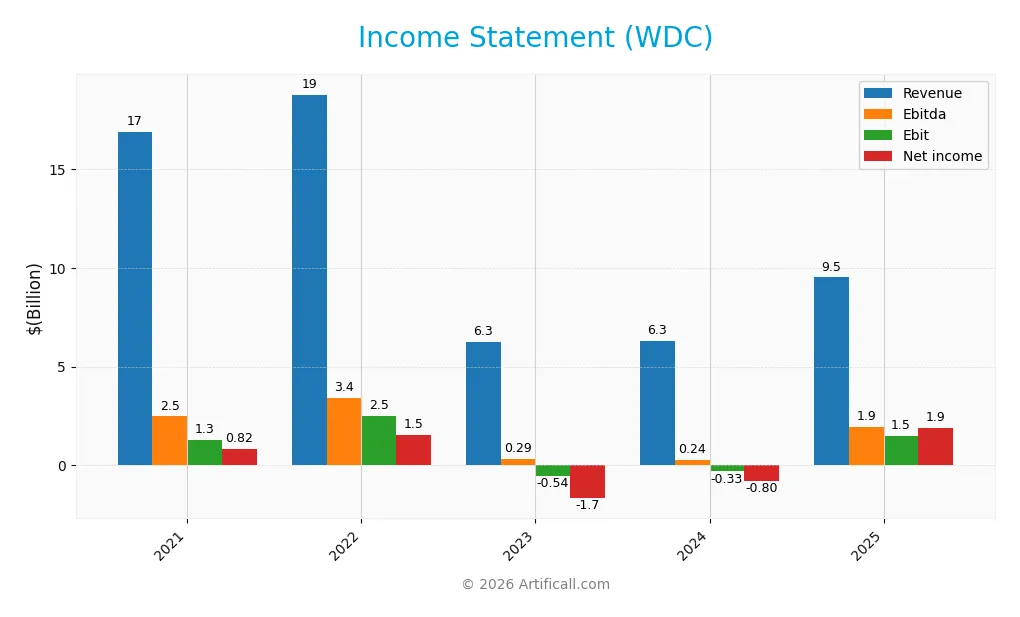
Below is Western Digital Corporation’s Income Statement overview for fiscal years 2021 through 2025, presented in USD.
| 2021 | 2022 | 2023 | 2024 | 2025 | |
|---|---|---|---|---|---|
| Revenue | 16.9B | 18.8B | 6.3B | 6.3B | 9.5B |
| Cost of Revenue | 12.4B | 12.9B | 4.9B | 4.5B | 5.8B |
| Operating Expenses | 3.3B | 3.5B | 1.9B | 2.2B | 1.4B |
| Gross Profit | 4.5B | 5.9B | 1.4B | 1.8B | 3.7B |
| EBITDA | 2.5B | 3.4B | 0.3B | 0.2B | 1.9B |
| EBIT | 1.3B | 2.5B | -0.5B | -0.3B | 1.5B |
| Interest Expense | 326M | 304M | 310M | 414M | 357M |
| Net Income | 821M | 1.5B | -1.7B | -0.8B | 1.9B |
| EPS | 2.69 | 4.81 | -5.37 | -2.61 | 5.31 |
| Filing Date | 2021-08-27 | 2022-08-25 | 2023-08-22 | 2024-08-20 | 2025-08-14 |
Income Statement Evolution
Western Digital Corporation experienced a significant revenue decline of 43.74% over the 2021-2025 period, despite strong net income growth of 126.67%. The most recent year showed a sharp 50.7% revenue increase and a more than fivefold rise in EBIT, reflecting improved operational efficiency. Margins followed a positive trend, with net margin expanding substantially, indicating better profitability control.
Is the Income Statement Favorable?
In fiscal 2025, WDC demonstrated solid fundamentals with revenue at 9.52B USD and net income of 1.86B USD, yielding a favorable net margin of 19.55%. The company maintained strong gross and EBIT margins at 38.78% and 15.62%, respectively. Interest expenses remained manageable at 3.75% of revenue, supporting positive earnings per share growth of 296.17% year-on-year. Overall, the income statement exhibits a broadly favorable profile.
Financial Ratios
The following table presents key financial ratios of Western Digital Corporation (WDC) across the fiscal years 2021 to 2025, offering a snapshot of profitability, liquidity, leverage, efficiency, and shareholder returns:
| Ratios | 2021 | 2022 | 2023 | 2024 | 2025 |
|---|---|---|---|---|---|
| Net Margin | 4.9% | 8.2% | -26.9% | -12.6% | 19.5% |
| ROE | 7.7% | 12.7% | -14.2% | -7.4% | 35.0% |
| ROIC | 5.0% | 8.1% | -2.7% | -2.0% | 21.5% |
| P/E | 20.0 | 6.8 | -5.4 | -23.6 | 11.8 |
| P/B | 1.53 | 0.86 | 0.77 | 1.74 | 4.14 |
| Current Ratio | 2.00 | 1.81 | 1.45 | 1.32 | 1.08 |
| Quick Ratio | 1.26 | 1.11 | 0.77 | 1.10 | 0.84 |
| D/E | 0.81 | 0.57 | 0.60 | 0.72 | 0.96 |
| Debt-to-Assets | 33.4% | 26.7% | 28.8% | 32.3% | 36.3% |
| Interest Coverage | 3.7 | 7.9 | -1.8 | -1.0 | 6.5 |
| Asset Turnover | 0.65 | 0.72 | 0.25 | 0.26 | 0.68 |
| Fixed Asset Turnover | 5.3 | 5.1 | 1.7 | 2.7 | 4.1 |
| Dividend Yield | 0.0% | 0.0% | 0.0% | 0.0% | 0.2% |
Evolution of Financial Ratios
Western Digital Corporation’s Return on Equity (ROE) showed a strong recovery, rising from negative values in 2023 and 2024 to 35.04% in 2025. The Current Ratio declined steadily from 2.00 in 2021 to 1.08 in 2025, indicating reduced short-term liquidity. The Debt-to-Equity Ratio increased from 0.59 in 2022 to 0.96 in 2025. Profitability improved significantly in 2025, with net profit margin reaching 19.55%, a marked turnaround from prior losses.
Are the Financial Ratios Favorable?
In 2025, profitability ratios such as net margin (19.55%), ROE (35.04%), and return on invested capital (21.53%) are favorable, reflecting improved earnings efficiency. Liquidity ratios like the Current Ratio (1.08) and Quick Ratio (0.84) are neutral, suggesting moderate short-term financial health. Leverage ratios, including Debt-to-Equity at 0.96 and Debt-to-Assets at 36.29%, are also neutral, indicating balanced debt levels. Market valuation shows a mixed picture with a favorable P/E of 11.8 but an unfavorable Price-to-Book of 4.14. Overall, the ratios present a slightly favorable financial profile.
Shareholder Return Policy
Western Digital Corporation resumed dividends in fiscal 2025 with a low payout ratio of 2.4% and a modest dividend yield near 0.2%. The dividend per share rose to $0.13, supported by solid free cash flow coverage of about 76%, while share buybacks remain unmentioned.
This restrained distribution approach, following prior years with no dividends amid losses, suggests cautious capital allocation. The low payout ratio and coverage metrics indicate sustainability, potentially backing long-term shareholder value without risking excessive cash outflows or debt increases.
Score analysis
The following radar chart presents a comprehensive overview of Western Digital Corporation’s key financial scores:
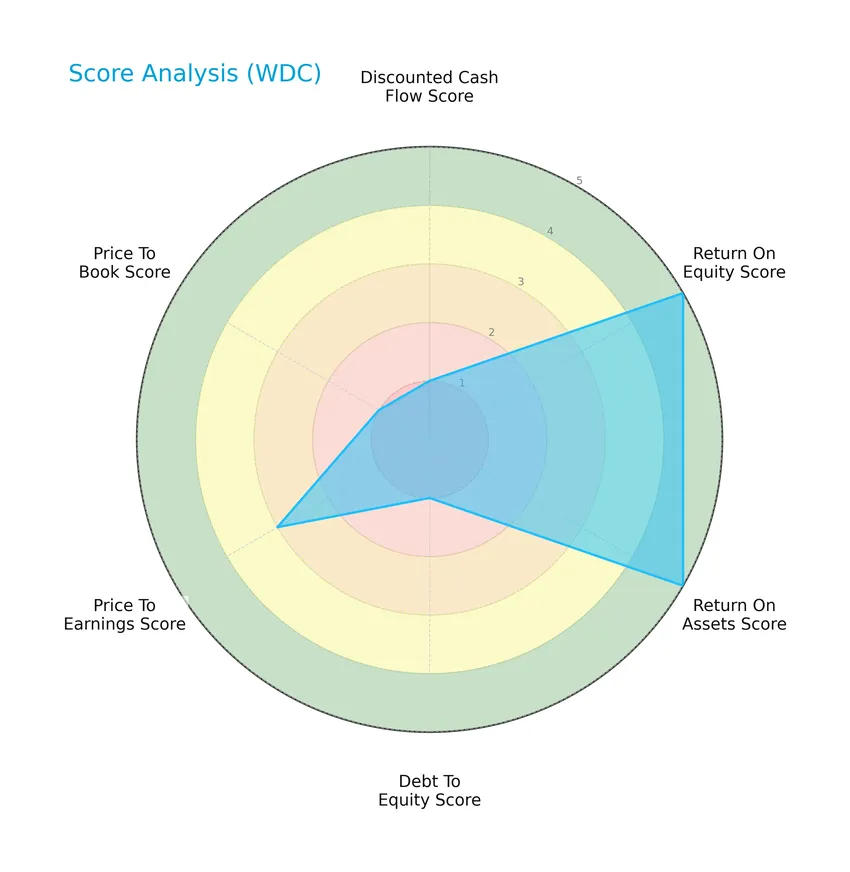
Western Digital shows very favorable returns on equity and assets, indicating strong profitability. However, the discounted cash flow, debt to equity, and price to book scores are very unfavorable, suggesting concerns in valuation and leverage. The price to earnings score is moderate.
Analysis of the company’s bankruptcy risk
Western Digital’s Altman Z-Score places it comfortably in the safe zone, reflecting a low risk of bankruptcy and solid financial stability:

Is the company in good financial health?
The Piotroski diagram below illustrates Western Digital’s financial strength based on its Piotroski Score:

With a Piotroski Score of 6, Western Digital is considered to be in average financial health, indicating moderate strength but room for improvement in some areas to enhance overall financial robustness.
Competitive Landscape & Sector Positioning
This sector analysis will explore Western Digital Corporation’s strategic positioning, revenue segmentation, key products, main competitors, and competitive advantages. I will assess whether Western Digital holds a competitive advantage over its industry peers.
Strategic Positioning
Western Digital Corporation maintains a diversified product portfolio, spanning client devices, cloud storage, and retail products, with revenues shifting notably toward cloud solutions by 2025 (8.3B USD). Geographically, the company operates globally, with significant revenue from the Americas (4.6B USD) and Asia (3.4B USD), reflecting broad international exposure.
Revenue by Segment
The pie chart illustrates Western Digital Corporation’s revenue distribution by product segments for the fiscal year 2025, highlighting the company’s key business areas.
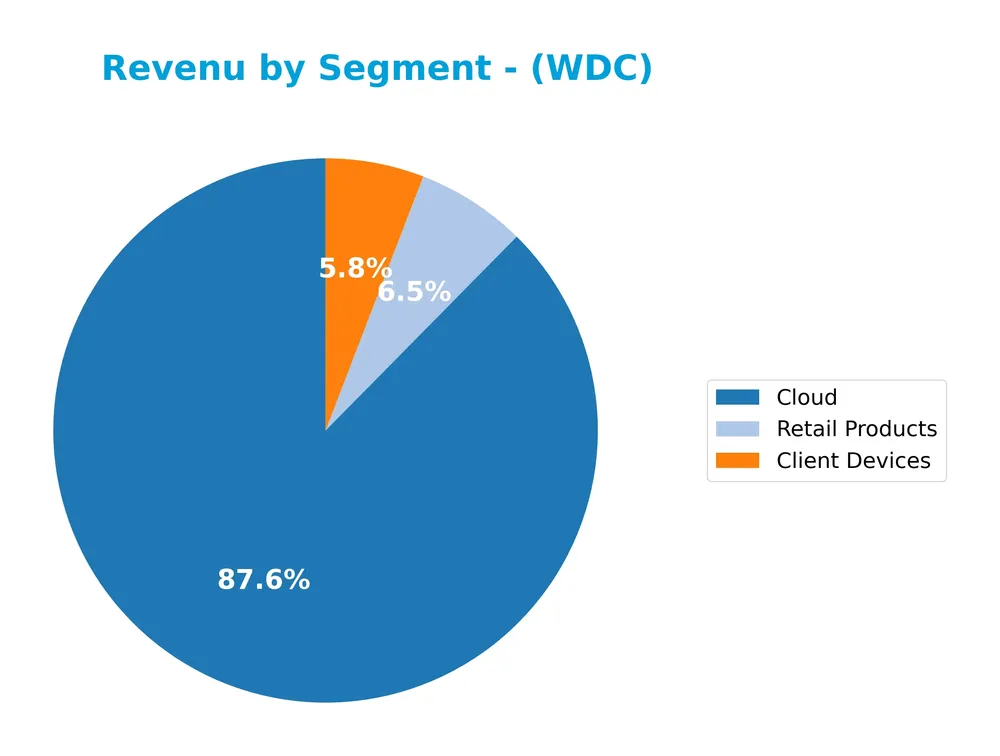
In 2025, Cloud revenue leads with 8.3B, showing its importance in Western Digital’s portfolio, while Client Devices and Retail Products generated 556M and 623M respectively, indicating a sharp decline in these traditional segments. This shift suggests a significant concentration risk toward Cloud services, contrasting with the more balanced segment revenues seen in prior years. The recent year marks an acceleration in Cloud dominance but a notable slowdown in Client Devices.
Key Products & Brands
Below is a table summarizing Western Digital Corporation’s key products and brands:
| Product | Description |
|---|---|
| Client Devices | Hard disk drives (HDDs), solid state drives (SSDs) for PCs, gaming consoles, smart video systems, set-top boxes, and embedded storage for mobile and wearable devices. |
| Cloud | Data center devices and solutions including enterprise helium hard drives, enterprise SSDs, software for servers, and tiered storage platforms. |
| Retail Products | External HDD products, portable SSDs, removable cards, USB flash drives, and wireless drives for consumer devices such as phones, tablets, cameras, and PCs. |
| Brands | Products sold under the G-Technology, SanDisk, and WD brands to OEMs, distributors, resellers, and retailers. |
Western Digital offers a broad range of storage solutions across client, cloud, and retail segments, marketed through well-known brands including SanDisk and WD. The company serves diverse applications from consumer devices to enterprise data centers.
Main Competitors
Western Digital Corporation faces competition from a total of 12 companies, with the table below listing the top 10 leaders by market capitalization:
| Competitor | Market Cap. |
|---|---|
| Arista Networks, Inc. | 168B |
| Dell Technologies Inc. | 85.7B |
| Western Digital Corporation | 65.2B |
| Seagate Technology Holdings plc | 61.1B |
| Pure Storage, Inc. | 21.9B |
| NetApp, Inc. | 21.3B |
| HP Inc. | 20.7B |
| Super Micro Computer, Inc. | 18.4B |
| IonQ, Inc. | 15.9B |
| D-Wave Quantum Inc. | 9.1B |
Western Digital ranks 3rd among its competitors with a market cap approximately 48% that of the leading Arista Networks. It stands above both the average market cap of the top 10 competitors (49B) and the sector median (21B). Its position is secured with a 5.7% market cap advantage over the next competitor above, Dell Technologies.
Comparisons with competitors
Check out how we compare the company to its competitors:
Does WDC have a competitive advantage?
Western Digital Corporation presents a clear competitive advantage, demonstrated by a very favorable moat status with ROIC exceeding WACC by 9.3% and a strong upward ROIC trend of 329% over 2021-2025, indicating efficient capital use and value creation. The company’s consistent profitability and favorable income statement metrics further support its durable competitive position in the computer hardware industry.
Looking ahead, Western Digital’s diverse product portfolio across client and enterprise storage solutions positions it to capitalize on growth opportunities in data center platforms, embedded storage, and connected devices. Its presence in multiple global markets, including Americas, Asia, and EMEA, offers scope for expansion and innovation in emerging technology segments.
SWOT Analysis
This SWOT analysis provides a clear snapshot of Western Digital Corporation’s current strategic position to guide investment decisions.
Strengths
- strong gross margin at 38.78%
- robust net margin of 19.55%
- durable competitive advantage with growing ROIC
- favorable revenue growth in last year
- diversified global presence
Weaknesses
- high beta of 1.845 indicating stock volatility
- unfavorable price-to-book ratio at 4.14
- low dividend yield at 0.2%
- moderate current and quick ratios suggesting liquidity constraints
Opportunities
- expanding data center and enterprise storage markets
- growth potential in flash-based embedded storage for IoT and automotive
- innovation in SSD and next-gen storage solutions
Threats
- intense competition in computer hardware sector
- geopolitical risks affecting Asia sales decline
- technological obsolescence risk due to rapid innovation
Western Digital demonstrates strong profitability and a durable moat, yet faces valuation concerns and market volatility. Its strategy should focus on leveraging innovation and expanding growth areas while cautiously managing financial leverage and geopolitical exposure.
Stock Price Action Analysis
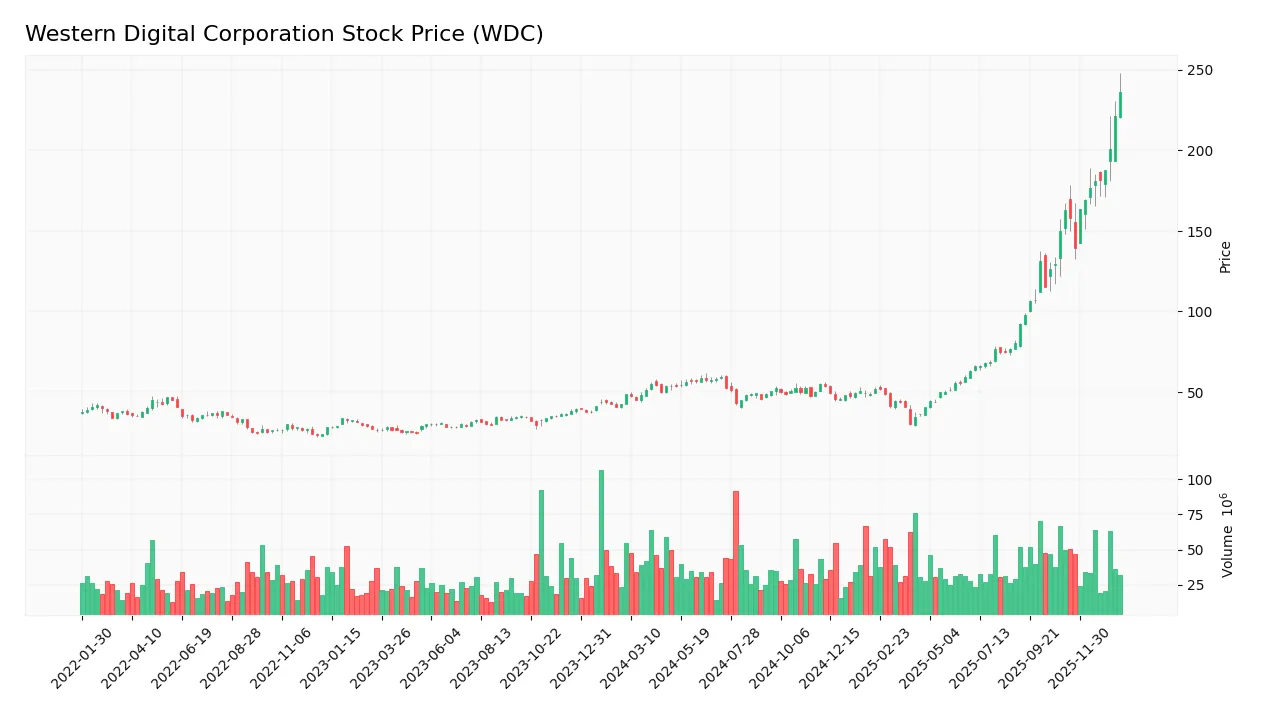
The weekly stock chart for Western Digital Corporation (WDC) illustrates significant price movements and volume changes over the past year:
Trend Analysis
Over the past 12 months, WDC’s stock price increased by 386.5%, indicating a bullish trend with clear acceleration. The price ranged from a low of 30.54 to a high of 236.39, and volatility was notable with a standard deviation of 45.74, reflecting strong upward momentum and increased investor interest.
Volume Analysis
In the last three months, trading volume has been increasing, with buyers dominating 79.4% of activity, suggesting strong buyer-driven demand. This heightened participation indicates positive investor sentiment and confidence in the stock’s continued upward trajectory.
Target Prices
The consensus target prices for Western Digital Corporation (WDC) indicate a positive outlook among analysts.
| Target High | Target Low | Consensus |
|---|---|---|
| 260 | 165 | 226 |
Analysts expect WDC’s stock price to range between 165 and 260, with an average consensus target of 226, reflecting moderate optimism in its future performance.

Don’t Let Luck Decide Your Entry Point
Optimize your entry points with our advanced ProRealTime indicators. You’ll get efficient buy signals with precise price targets for maximum performance. Start outperforming now!
Analyst & Consumer Opinions
This section examines recent analyst ratings and consumer feedback regarding Western Digital Corporation’s performance and products.
Stock Grades
The latest verified analyst grades for Western Digital Corporation demonstrate a consistent outlook across major financial institutions:
| Grading Company | Action | New Grade | Date |
|---|---|---|---|
| Morgan Stanley | Maintain | Overweight | 2026-01-22 |
| Citigroup | Maintain | Buy | 2026-01-20 |
| Rosenblatt | Maintain | Buy | 2026-01-20 |
| B of A Securities | Maintain | Buy | 2026-01-20 |
| UBS | Maintain | Neutral | 2026-01-20 |
| Susquehanna | Maintain | Neutral | 2026-01-16 |
| Wells Fargo | Maintain | Overweight | 2026-01-15 |
Most recent ratings hold steady with a majority favoring a Buy or Overweight stance, while a minority maintain a Neutral view. This reflects a broadly positive but cautious market sentiment toward the stock.
Consumer Opinions
Consumers of Western Digital Corporation (WDC) have shared a mix of positive experiences and constructive criticisms, reflecting varied satisfaction levels with the company’s products and services.
| Positive Reviews | Negative Reviews |
|---|---|
| Reliable high-capacity storage solutions ideal for data-heavy applications. | Occasional reports of product failures within warranty period. |
| Competitive pricing compared to other storage brands. | Customer support response times can be slow during peak periods. |
| User-friendly software interface for managing drives. | Some users noted compatibility issues with certain operating systems. |
Overall, consumers appreciate Western Digital’s robust and affordable storage devices but advise caution regarding occasional hardware reliability and customer service delays. These insights suggest the company has solid products but could improve support and quality assurance.
Risk Analysis
Below is a summary table highlighting key risk categories for Western Digital Corporation and their respective likelihood and potential impact:
| Category | Description | Probability | Impact |
|---|---|---|---|
| Market Volatility | High beta of 1.845 indicates sensitivity to market swings, affecting stock price fluctuations. | High | Medium |
| Competitive Pressure | Intense rivalry in storage device industry may compress margins and slow growth. | Medium | High |
| Debt Levels | Moderate debt-to-equity ratio with some unfavorable debt scores could increase financial risk. | Medium | Medium |
| Technological Change | Rapid innovation demands continuous R&D and risk of product obsolescence. | Medium | High |
| Dividend Yield | Low dividend yield (0.2%) may deter income-focused investors, affecting stock demand. | Low | Low |
The most significant risks are competitive pressure and technological changes, given their potential to strongly impact profitability. Despite being in the safe zone with an Altman Z-Score of 7.61, the moderate Piotroski score of 6 suggests some caution on financial strength. Market volatility remains a key consideration due to the company’s elevated beta.
Should You Buy Western Digital Corporation?
Western Digital appears to be enhancing operational efficiency with a durable competitive moat supported by growing ROIC, while its leverage profile could be seen as substantial. Despite moderate financial strength scores, its overall rating suggests a cautiously favorable investment profile.
Strength & Efficiency Pillars
Western Digital Corporation exhibits robust profitability with a net margin of 19.55% and a return on equity (ROE) of 35.04%, underscoring efficient capital use. Its return on invested capital (ROIC) stands at 21.53%, comfortably exceeding the weighted average cost of capital (WACC) at 12.2%, confirming that the company is a clear value creator. Financial health is solid, supported by an Altman Z-Score of 7.61, placing it well within the safe zone, while a Piotroski score of 6 indicates average but stable fundamentals. These metrics collectively reveal a company with durable competitive advantages and improving profitability.
Weaknesses and Drawbacks
Despite strong fundamentals, valuation metrics present some concerns. The price-to-book ratio of 4.14 is unfavorable, suggesting the stock may be trading at a premium relative to its book value, which could limit upside potential. The debt-to-equity ratio at 0.96 is neutral but reflects a moderate leverage level that warrants monitoring. Dividend yield is minimal at 0.2%, which may reduce appeal to income-focused investors. However, liquidity ratios, including a current ratio of 1.08, show only neutral positioning, implying limited cushion against short-term obligations.
Our Verdict about Western Digital Corporation
Western Digital’s long-term fundamental profile appears favorable, supported by strong profitability and value creation metrics. Coupled with a bullish overall stock trend and a recent strongly buyer-dominant market environment, the profile may appear attractive for long-term exposure. Investors could consider it a candidate for portfolio inclusion, while remaining mindful of valuation and leverage nuances that suggest measured risk management.
Disclaimer: This content is for informational purposes only and does not constitute financial, investment, or other professional advice. Investing in financial markets involves a significant risk of loss, and past performance is not indicative of future results.
Additional Resources
- AMF Tjanstepension AB Decreases Stock Holdings in Western Digital Corporation $WDC – MarketBeat (Jan 25, 2026)
- Western Digital: The Storage Sugar High (NASDAQ:WDC) – Seeking Alpha (Jan 21, 2026)
- Western Digital (WDC) Shares Skyrocket, What You Need To Know – Yahoo Finance (Jan 21, 2026)
- Western Digital to Host Innovation Day 2026 in New York City – Business Wire (Jan 20, 2026)
- Western Digital (WDC) soars to all-time high as 2 analysts turn bullish – MSN (Jan 22, 2026)
For more information about Western Digital Corporation, please visit the official website: westerndigital.com