Home > Analyses > Real Estate > Welltower Inc.
Welltower Inc. reshapes healthcare by funding the real estate that enables innovative care delivery. It partners with leading seniors housing operators and health systems to enhance wellness and patient experiences. As a top REIT in healthcare facilities, Welltower commands a strong presence across major U.S., Canadian, and U.K. markets. I’m intrigued to explore whether its robust fundamentals still justify its premium valuation and future growth prospects.

Table of contents
Business Model & Company Overview
Welltower Inc., founded in 1980 and headquartered in Toledo, Ohio, stands as a dominant player in the healthcare real estate sector. As an S&P 500 company, it operates a cohesive ecosystem of seniors housing, post-acute communities, and outpatient medical properties. Welltower partners with leading operators to advance innovative care models that enhance wellness and healthcare delivery. Its footprint spans major growth markets in the United States, Canada, and the United Kingdom, reflecting a strategic focus on high-demand regions.
The company generates value primarily through long-term leases and investments in healthcare infrastructure, balancing stable rental income with growth in high-quality assets. This revenue engine combines real estate investment trust (REIT) structures with partnerships that embed Welltower in the evolving healthcare landscape across North America and Europe. I see its economic moat rooted in its strategic property portfolio and deep industry relationships, positioning Welltower to shape healthcare real estate’s future.
Financial Performance & Fundamental Metrics
I will analyze Welltower Inc.’s income statement, key financial ratios, and dividend payout policy to assess its overall financial health and shareholder value.
Income Statement
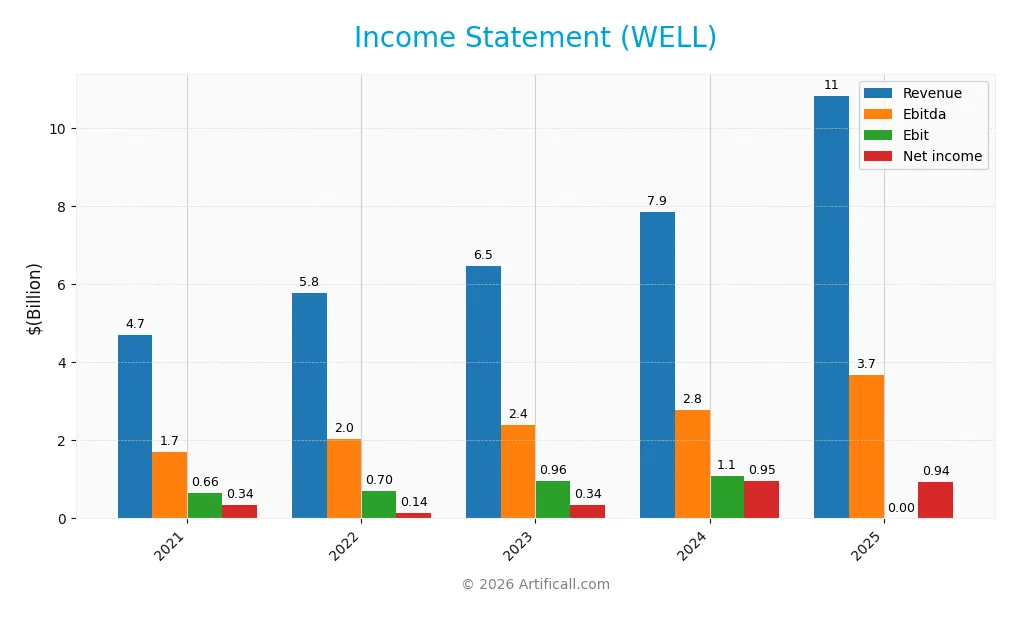
The table below presents Welltower Inc.’s key income statement figures for fiscal years 2021 through 2025 in USD.
| 2021 | 2022 | 2023 | 2024 | 2025 | |
|---|---|---|---|---|---|
| Revenue | 4.71B | 5.78B | 6.48B | 7.85B | 10.84B |
| Cost of Revenue | 2.77B | 3.56B | 3.95B | 4.83B | 0 |
| Operating Expenses | 1.17B | 1.47B | 1.59B | 1.88B | 6.49B |
| Gross Profit | 1.93B | 2.22B | 2.53B | 3.02B | 0 |
| EBITDA | 1.71B | 2.04B | 2.40B | 2.78B | 3.68B |
| EBIT | 661M | 703M | 958M | 1.10B | 0 |
| Interest Expense | 490M | 530M | 608M | 574M | 652M |
| Net Income | 336M | 141M | 340M | 952M | 937M |
| EPS | 0.79 | 0.31 | 0.66 | 1.58 | 1.41 |
| Filing Date | 2022-02-16 | 2023-02-21 | 2024-02-15 | 2025-02-12 | 2026-02-10 |
Income Statement Evolution
Welltower’s revenue surged 38% in 2025, continuing a 130% growth since 2021. However, gross profit and EBIT margins collapsed in 2025, erasing prior gains. Net income grew overall by 179%, yet net margin slipped 29% last year. Operating expenses rose in line with revenue, diluting profitability despite top-line strength.
Is the Income Statement Favorable?
In 2025, fundamentals show mixed signals. Revenue growth and net margin remain favorable at 8.6%, while interest expense is neutral at 6%. Yet, the absence of reported gross profit and EBIT margins signals weakness. Declines in EPS and net margin growth raise caution. Overall, the income statement’s unfavorable status reflects uneven earnings quality.
Financial Ratios
The table below presents key financial ratios for Welltower Inc. spanning fiscal years 2021 through 2025, illustrating profitability, valuation, liquidity, leverage, and efficiency measures:
| Ratios | 2021 | 2022 | 2023 | 2024 | 2025 |
|---|---|---|---|---|---|
| Net Margin | 7.1% | 2.4% | 5.2% | 12.1% | 8.6% |
| ROE | 1.9% | 0.7% | 1.3% | 3.0% | 0% |
| ROIC | 2.2% | 1.9% | 2.2% | 2.3% | 0% |
| P/E | 108.4 | 214.5 | 136.7 | 79.9 | 131.9 |
| P/B | 2.1 | 1.5 | 1.8 | 2.4 | 0 |
| Current Ratio | 1.9 | 2.6 | 4.5 | 5.3 | 0 |
| Quick Ratio | 1.9 | 2.6 | 4.5 | 5.3 | 0 |
| D/E | 0.83 | 0.74 | 0.63 | 0.52 | 0 |
| Debt-to-Assets | 42.0% | 39.5% | 36.6% | 32.8% | 0% |
| Interest Coverage | 1.56 | 1.41 | 1.55 | 2.00 | 1.48 |
| Asset Turnover | 0.13 | 0.15 | 0.15 | 0.15 | 0 |
| Fixed Asset Turnover | 9.0 | 17.8 | 18.5 | 6.5 | 0 |
| Dividend Yield | 2.8% | 3.7% | 2.7% | 2.0% | 1.5% |
Evolution of Financial Ratios
Return on Equity (ROE) data is unavailable for 2025, marking a sharp contrast versus prior years where ROE hovered between 1.3% and 3%. The Current Ratio dropped to zero in 2025 after steady improvement from 1.9 in 2021 to 5.3 in 2024. Debt-to-Equity Ratio also fell to zero in 2025 from a range of 0.52 to 0.83 in the preceding years. Profitability showed mixed signals with net margin at 8.64% in 2025, lower than previous years’ 5.2% to 12.1%.
Are the Financial Ratios Fovorable?
The 2025 ratios lean unfavorable overall. Profitability is neutral with a net margin of 8.64%, but ROE and ROIC lack data, raising concerns. Liquidity ratios like Current and Quick are zero, signaling unfavorable liquidity. Leverage metrics show favorable zero values, although absence of debt figures complicates interpretation. High P/E at 131.88 is unfavorable versus typical market benchmarks. Dividend yield is neutral at 1.52%. Asset efficiency ratios are also unfavorable or missing. The global opinion classifies the financial ratios as unfavorable.
Shareholder Return Policy
Welltower Inc. maintains a consistent dividend policy with a dividend per share rising from $2.44 in 2021 to $2.82 in 2025. The payout ratio has fluctuated above 100%, reaching 200% in 2025, indicating distributions may exceed net income.
While the dividend yield declined from 2.84% in 2021 to 1.52% in 2025, the company also executes share buybacks. The high payout ratios could strain cash flow sustainability, suggesting risks for long-term value if earnings fail to support dividends and buybacks consistently.
Score analysis
The following radar chart presents key financial scores for Welltower Inc., highlighting strengths and weaknesses across valuation and profitability metrics:
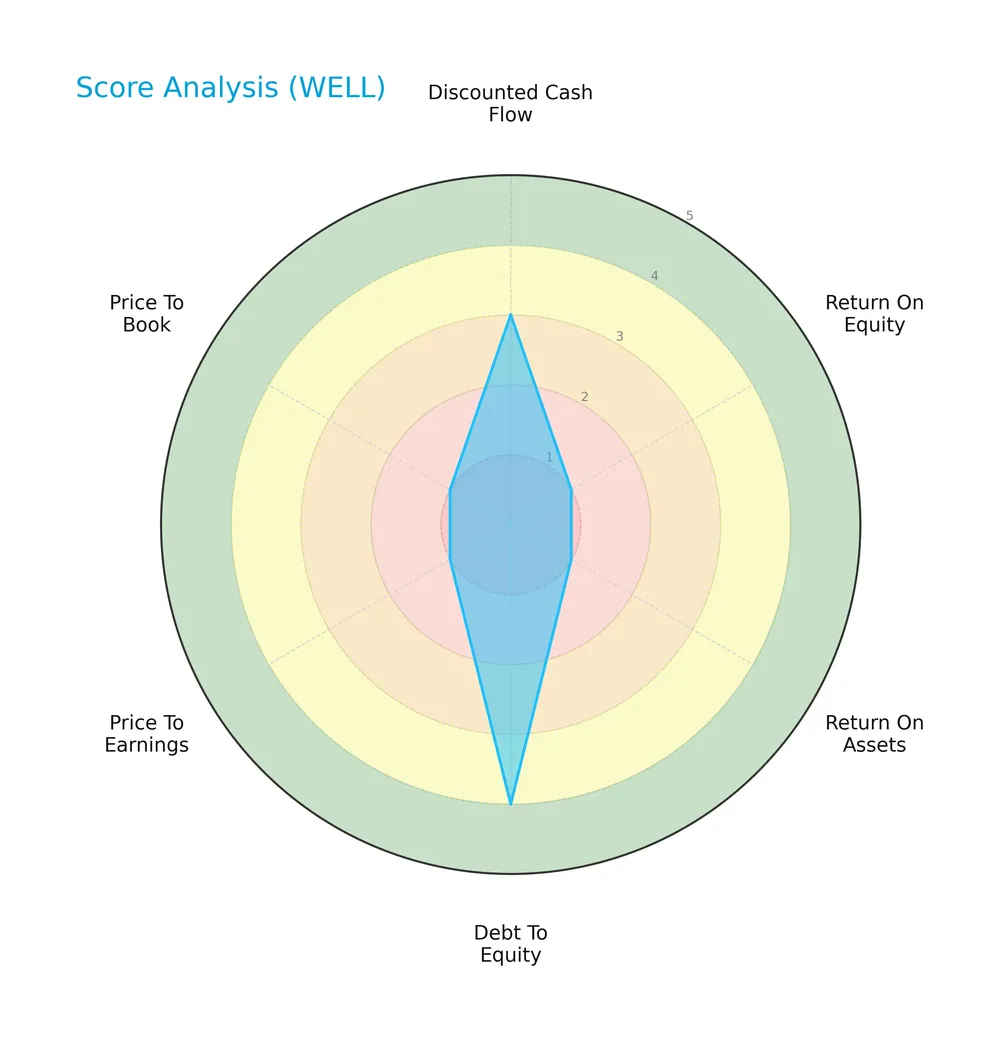
Welltower shows a moderate discounted cash flow score of 3 and a favorable debt-to-equity score of 4. However, profitability scores like return on equity and return on assets are very unfavorable at 1. Valuation metrics price-to-earnings and price-to-book also score very low at 1.
Analysis of the company’s bankruptcy risk
Welltower’s Altman Z-Score places it comfortably in the safe zone, indicating low bankruptcy risk based on its financial stability and leverage:

Is the company in good financial health?
The Piotroski Score diagram illustrates Welltower’s moderate financial health status:

With a Piotroski Score of 4, Welltower falls into the average category. This suggests the company shows some financial strengths but also faces notable weaknesses, reflecting mixed signals for investors.
Competitive Landscape & Sector Positioning
This sector analysis will explore Welltower Inc.’s strategic positioning, revenue segments, key products, and main competitors. I will assess whether Welltower holds a competitive advantage within the healthcare facilities REIT industry.
Strategic Positioning
Welltower concentrates on seniors housing, outpatient medical, and triple net properties, with revenue growing to $7.4B in 2024. Its geographic focus spans the U.S., U.K., and Canada, emphasizing major high-growth markets. This strategy balances sector specialization with diversified regional exposure.
Revenue by Segment
This pie chart illustrates Welltower Inc.’s revenue breakdown by segment for the fiscal year 2024, highlighting the primary drivers of its business model.
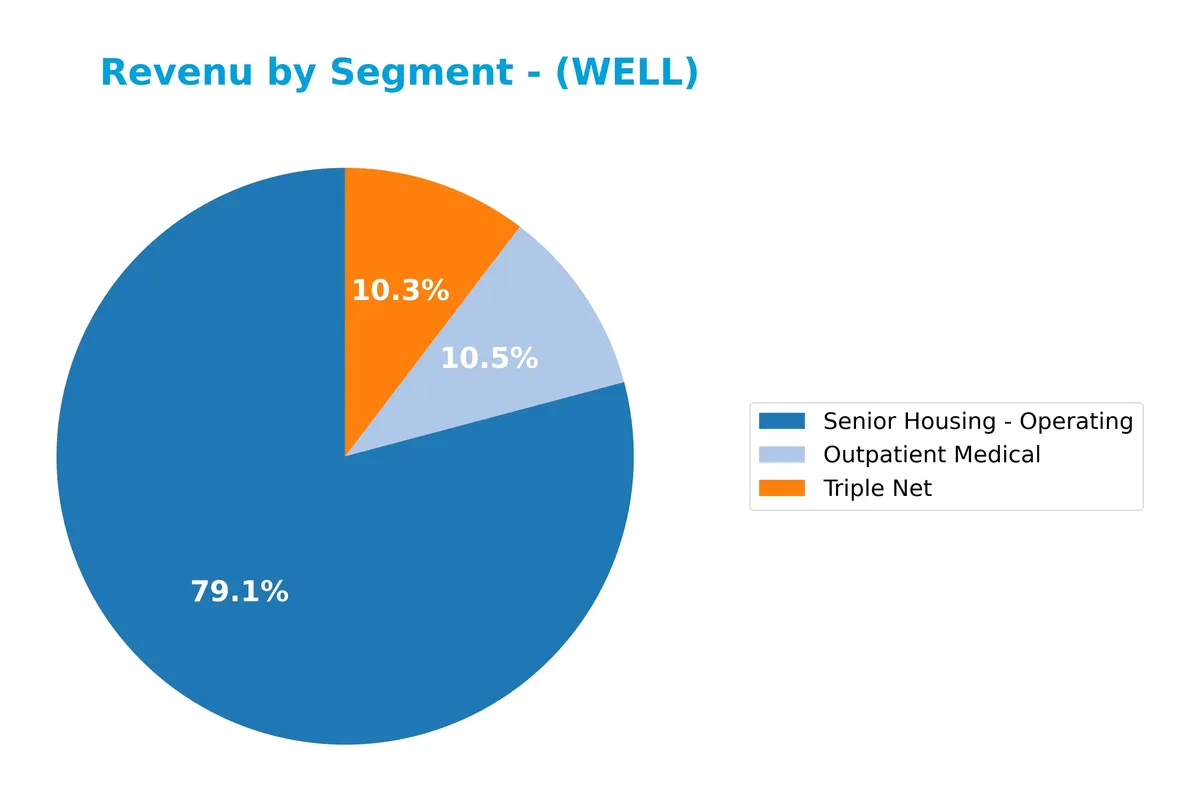
In 2024, Senior Housing – Operating dominates with $6.04B, showing strong growth from $4.77B in 2023. Outpatient Medical contributed $802M, a modest increase, while Triple Net revenue declined to $789M from $1.04B. The shift indicates a strategic focus on operating senior housing, reducing reliance on Triple Net leases, which may affect stability but boosts growth potential.
Key Products & Brands
Welltower’s revenue streams span several healthcare real estate segments and related services:
| Product | Description |
|---|---|
| Senior Housing – Operating | Revenue from leasing and managing senior housing communities providing residential care. |
| Outpatient Medical | Income generated from outpatient medical properties serving non-hospital healthcare needs. |
| Triple Net | Revenues from triple net leases where tenants cover property expenses including taxes and maintenance. |
| Management Service | Fees earned for managing healthcare facilities and related services. |
| Interest Revenue | Income from interest on financial assets or loans. |
| Product and Service, Other | Miscellaneous revenues from non-core products and services. |
Welltower’s portfolio primarily focuses on senior housing and outpatient medical properties, with solid contributions from triple net leases and management services. The company’s diversified healthcare real estate approach anchors its revenue base.
Main Competitors
There are 3 main competitors in the Real Estate sector, with the table listing the top 3 leaders by market capitalization:
| Competitor | Market Cap. |
|---|---|
| Welltower Inc. | 128.3B |
| Ventas, Inc. | 34.2B |
| Healthpeak Properties, Inc. | 11.3B |
Welltower Inc. ranks 1st among its competitors with a market cap 1.112 times larger than the next leader. It stands well above both the average market cap of the top 10 (58B) and the sector median (34B). The company shows a significant gap to the next competitor below, emphasizing its dominant position in this niche.
Comparisons with competitors
Check out how we compare the company to its competitors:
Does Welltower Inc. have a competitive advantage?
Welltower Inc. presents some competitive edge through its focus on senior housing and healthcare real estate in major, high-growth markets across the US, Canada, and the UK. Its net margin of 8.6% and 130% revenue growth over five years reflect operational strength despite mixed income statement metrics and a declining ROIC trend.
Looking ahead, Welltower aims to capitalize on expanding healthcare infrastructure needs by partnering with leading operators to scale innovative care models. This positions it to tap into growing demand for seniors housing and post-acute care, potentially broadening its market footprint and revenue streams.
SWOT Analysis
This SWOT analysis highlights Welltower Inc.’s key internal and external factors shaping its strategic position.
Strengths
- Strong market cap at $143B
- Leading REIT in healthcare facilities
- Diversified presence in US, UK, Canada
Weaknesses
- Declining ROIC trend
- Unfavorable income and ratio evaluations
- High P/E at 132 signals overvaluation
Opportunities
- Aging population driving demand
- Expansion in high-growth healthcare markets
- Innovation in care delivery real estate
Threats
- Rising interest rates increasing debt costs
- Regulatory risks in healthcare real estate
- Competitive pressure from peers and new entrants
Welltower’s scale and sector focus position it well for growth amid demographic trends. However, its weakening profitability metrics and stretched valuation warrant caution. Strategic emphasis on operational efficiency and selective growth is critical to mitigate risks and sustain long-term value.
Stock Price Action Analysis
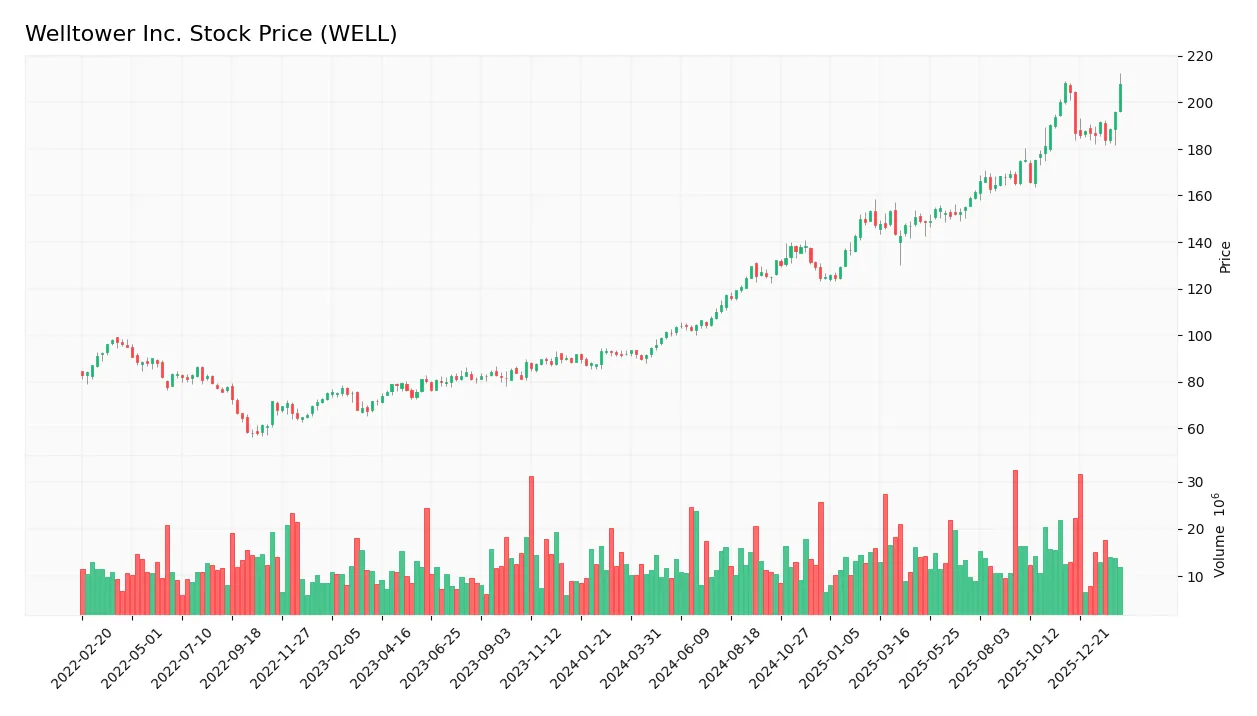
The weekly stock chart below illustrates Welltower Inc.’s price movements over the last 12 months:
Trend Analysis
Over the past 12 months, Welltower’s stock price rose 125.76%, indicating a strong bullish trend. The price peaked at 208.22 and bottomed at 89.79, with volatility reflected by a 30.8 standard deviation. However, recent data from Nov 2025 to Feb 2026 shows a slight -0.16% decline, signaling a neutral trend with deceleration.
Volume Analysis
In the last three months, trading volume increased overall. Yet, seller volume (107.5M) exceeded buyer volume (71.7M), creating a slightly seller-dominant environment at 40.01% buyer dominance. This suggests cautious investor sentiment with lower market participation from buyers despite rising volume.
Target Prices
Analysts set a clear target consensus for Welltower Inc., reflecting modest upside potential.
| Target Low | Target High | Consensus |
|---|---|---|
| 182 | 246 | 212.56 |
The target prices suggest analysts expect Welltower to trade between $182 and $246, with a consensus near $213, indicating cautious optimism.

Don’t Let Luck Decide Your Entry Point
Optimize your entry points with our advanced ProRealTime indicators. You’ll get efficient buy signals with precise price targets for maximum performance. Start outperforming now!
Analyst & Consumer Opinions
This section examines ratings and consumer feedback concerning Welltower Inc. (WELL) to gauge market sentiment.
Stock Grades
Here are the latest verified analyst grades for Welltower Inc., reflecting recent changes and stability across firms:
| Grading Company | Action | New Grade | Date |
|---|---|---|---|
| Wells Fargo | Downgrade | Equal Weight | 2024-10-01 |
| Scotiabank | Maintain | Sector Outperform | 2024-09-23 |
| Evercore ISI Group | Maintain | In Line | 2024-09-16 |
| Evercore ISI Group | Maintain | In Line | 2024-08-28 |
| Deutsche Bank | Maintain | Buy | 2024-08-21 |
| RBC Capital | Maintain | Sector Perform | 2024-08-09 |
| Scotiabank | Maintain | Sector Outperform | 2024-08-07 |
| Wedbush | Maintain | Neutral | 2024-08-05 |
| Evercore ISI Group | Maintain | In Line | 2024-07-16 |
| Morgan Stanley | Maintain | Overweight | 2024-07-11 |
Most analysts maintain stable views, with Wells Fargo’s recent downgrade standing out. The consensus remains generally favorable, with no sell ratings reported.
Consumer Opinions
Welltower Inc. receives mixed consumer sentiment as investors weigh its healthcare real estate focus amid evolving market conditions.
| Positive Reviews | Negative Reviews |
|---|---|
| Strong portfolio in senior housing and healthcare | Rising debt levels raise financial concerns |
| Consistent dividend payments attract income investors | Slower growth compared to peers |
| Strategic acquisitions enhance long-term value | Exposure to regulatory risks in healthcare sector |
Overall, consumers praise Welltower’s stable dividends and strategic asset base. However, concerns about debt and regulatory exposure persist as key risks.
Risk Analysis
Below is a summary of key risks facing Welltower Inc., including their probabilities and potential impacts:
| Category | Description | Probability | Impact |
|---|---|---|---|
| Financial Health | Low ROE and ROIC indicate weak profitability and inefficient capital usage. | High | High |
| Valuation Risk | Extremely high P/E ratio (131.88) suggests overvaluation risk. | Medium | Medium |
| Liquidity Risk | Unfavorable current and quick ratios raise concerns about short-term liquidity. | High | High |
| Interest Coverage | Very low interest coverage signals vulnerability to rising interest rates. | High | High |
| Market Volatility | Beta of 0.832 implies moderate sensitivity to market swings. | Medium | Medium |
| Dividend Yield | Modest 1.52% yield may limit appeal to income-focused investors. | Low | Low |
The most pressing risks relate to weak profitability, liquidity shortfalls, and interest coverage. Despite a strong Altman Z-Score placing Welltower safely away from bankruptcy, the company’s financial ratios signal operational challenges. The sky-high P/E ratio also warns of valuation stress, especially in a rising rate environment. Investors should weigh these risks against the company’s stable market position and healthcare real estate focus.
Should You Buy Welltower Inc.?
Welltower Inc. appears to be a company with modest profitability and an eroding operational moat, while maintaining a manageable leverage profile. Despite average financial strength and a safe bankruptcy risk, its overall rating suggests a cautious investment profile.
Strength & Efficiency Pillars
Welltower Inc. posts a solid net margin of 8.64%, reflecting operational profitability. The Altman Z-Score at 3.90 places the company firmly in the safe zone, signaling strong solvency. Despite unavailable ROIC and WACC data, the company’s sustained revenue growth of 130.13% over the 2021-2025 period underscores its capacity to generate value. I observe that the favorable debt-to-equity ratio further enhances financial stability, offering a foundation for efficient capital management.
Weaknesses and Drawbacks
The stock suffers from a stretched valuation, with a P/E ratio at 131.88, indicating a premium that may pressure future returns. Return on equity and assets scores are very unfavorable, highlighting weak capital efficiency. Liquidity metrics such as current and quick ratios stand at zero, a red flag for short-term financial flexibility. Recent market behavior shows slight seller dominance at 40.01% buyer volume, suggesting cautious investor sentiment in the near term.
Our Final Verdict about Welltower Inc.
Welltower’s profile appears mixed. The company maintains long-term operational strength with safe solvency, but stretched valuation and recent seller dominance suggest prudence. Despite bullish overall trends, the current market pressure might warrant a wait-and-see approach for a better entry point. Investors seeking stability may find the risk-reward balance less compelling at present.
Disclaimer: This content is for informational purposes only and does not constitute financial, investment, or other professional advice. Investing in financial markets involves a significant risk of loss, and past performance is not indicative of future results.
Additional Resources
- Welltower Inc (WELL) Q4 2025 Earnings Call Highlights: Record Revenue and Strategic Growth Initiatives – GuruFocus (Feb 11, 2026)
- Welltower Inc. $WELL Shares Sold by Rhumbline Advisers – MarketBeat (Feb 11, 2026)
- Welltower reports 28% jump in quarterly FFO on robust seniors housing demand – AlphaStreet News (Feb 11, 2026)
- Welltower Inc (NYSE:WELL) Registers Strongs Revenue Growth – FXDailyReport.Com (Feb 11, 2026)
- Welltower’s Q4 FFO & Revenues Beat Estimates, Same Store NOI Rises – TradingView (Feb 11, 2026)
For more information about Welltower Inc., please visit the official website: welltower.com