Home > Analyses > Financial Services > Wells Fargo & Company
Wells Fargo shapes the financial landscape by connecting millions with essential banking and investment services. It commands a strong presence across consumer, commercial, corporate, and wealth management sectors, renowned for its broad product suite and trusted brand. I’ve observed that its ability to innovate within a highly regulated industry sets it apart. The key question now is whether Wells Fargo’s current fundamentals justify its sizable market value and growth ambitions in 2026.

Table of contents
Business Model & Company Overview
Wells Fargo & Company, founded in 1852 and headquartered in San Francisco, stands as a diversified financial services powerhouse. It unites consumer banking, commercial banking, investment services, and wealth management under a single ecosystem. This breadth enables it to serve a wide spectrum of clients, from individual consumers to institutional investors, creating a cohesive platform centered on comprehensive financial solutions.
Wells Fargo generates value through a balanced mix of consumer lending, corporate banking, and wealth management services. Its revenue engine spans recurring income from deposit accounts and loan interest, complemented by fee-based advisory and investment products. The company commands a strategic presence across the Americas, Europe, and Asia. Its enduring competitive advantage lies in a vast client base and integrated offerings that fortify its economic moat and influence the future of banking.
Financial Performance & Fundamental Metrics
I analyze Wells Fargo & Company’s income statement, key financial ratios, and dividend payout policy to reveal its core financial health and shareholder value approach.
Income Statement
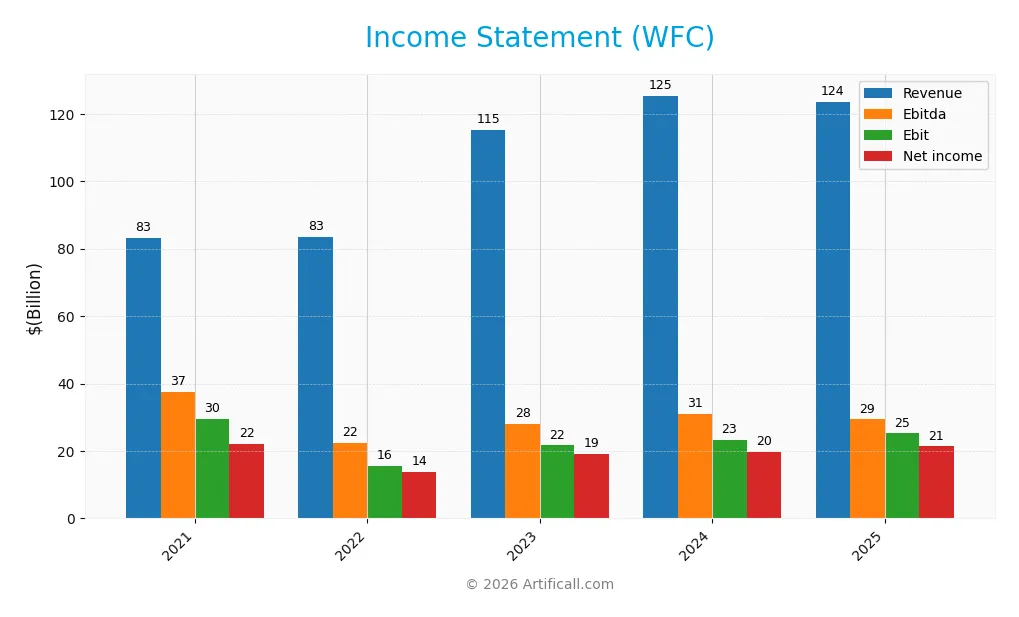
The table below summarizes Wells Fargo & Company’s key income statement figures for fiscal years 2021 through 2025, revealing trends in revenue, profitability, and earnings per share.
| 2021 | 2022 | 2023 | 2024 | 2025 | |
|---|---|---|---|---|---|
| Revenue | 83.1B | 83.4B | 115.3B | 125.4B | 123.5B |
| Cost of Revenue | -240M | 10.6B | 38.1B | 47.4B | 43.5B |
| Operating Expenses | 53.8B | 57.2B | 55.6B | 54.6B | 54.8B |
| Gross Profit | 83.3B | 72.8B | 77.2B | 77.9B | 80.0B |
| EBITDA | 37.5B | 22.5B | 27.9B | 30.9B | 29.3B |
| EBIT | 29.6B | 15.6B | 21.6B | 23.4B | 25.2B |
| Interest Expense | 3.9B | 9.1B | 32.7B | 43.1B | 39.8B |
| Net Income | 22.1B | 13.7B | 19.1B | 19.7B | 21.3B |
| EPS | 4.99 | 3.17 | 4.88 | 5.43 | 6.39 |
| Filing Date | 2022-02-22 | 2023-02-21 | 2024-02-20 | 2025-02-25 | 2026-02-24 |
Income Statement Evolution
Wells Fargo’s revenue grew 49% from 2021 to 2025 but declined 1.5% in the last year, signaling a recent slowdown. Net income contracted 3.5% overall, with margins under pressure. However, gross and EBIT margins improved slightly, reflecting controlled costs despite a dip in operating expenses relative to revenue.
Is the Income Statement Favorable?
In 2025, Wells Fargo reported a 64.8% gross margin and a 20.4% EBIT margin, both favorable versus industry norms. Net margin rose nearly 10% year-over-year, driven by a 17.7% EPS increase. Interest expenses remain a concern at 32.2% of revenue, weighing on profitability. Overall, fundamentals appear favorable but warrant monitoring due to rising financing costs.
Financial Ratios
The table below presents key financial ratios for Wells Fargo & Company over the fiscal years 2021 to 2025, illustrating profitability, valuation, liquidity, leverage, and efficiency metrics:
| Ratios | 2021 | 2022 | 2023 | 2024 | 2025 |
|---|---|---|---|---|---|
| Net Margin | 26.6% | 16.4% | 16.6% | 15.7% | 17.3% |
| ROE | 11.8% | 7.6% | 10.3% | 11.0% | 11.8% |
| ROIC | 6.0% | 3.1% | 3.3% | 3.6% | 6.5% |
| P/E | 8.8x | 11.5x | 9.5x | 12.2x | 13.9x |
| P/B | 1.04x | 0.87x | 0.98x | 1.34x | 1.64x |
| Current Ratio | 0.28 | 0.21 | 0.29 | 0.27 | 13.79 |
| Quick Ratio | 0.28 | 0.21 | 0.29 | 0.27 | 13.79 |
| D/E | 1.04 | 1.25 | 1.60 | 1.57 | 1.07 |
| Debt-to-Assets | 10.0% | 12.0% | 15.4% | 14.6% | 9.0% |
| Interest Coverage | 7.6x | 1.7x | 0.7x | 0.5x | 0.6x |
| Asset Turnover | 0.04x | 0.04x | 0.06x | 0.06x | 0.06x |
| Fixed Asset Turnover | 4.48x | 4.64x | 6.32x | 6.45x | 10.84x |
| Dividend Yield | 1.9% | 3.4% | 3.3% | 2.6% | 0.4% |
Evolution of Financial Ratios
From 2021 to 2025, Wells Fargo’s Return on Equity (ROE) remained relatively stable, fluctuating slightly around 11-12%. The Current Ratio showed an extreme jump in 2025 to 13.79 from sub-1 levels in prior years, indicating a significant change in liquidity management or accounting. The Debt-to-Equity Ratio declined from about 1.6 in 2023-24 to 1.07 in 2025, reflecting moderate deleveraging.
Are the Financial Ratios Fovorable?
In 2025, Wells Fargo’s profitability shows strength with a favorable net margin of 17.27% but a neutral ROE of 11.78%. Liquidity indicators are mixed: an unusually high current ratio (13.79) flags potential asset inefficiency, while the quick ratio is favorable. Leverage is slightly unfavorable with a debt-to-equity ratio of 1.07 and weak interest coverage at 0.63. Market valuation metrics like P/E at 13.89 are favorable, but overall, the ratios lean slightly unfavorable.
Shareholder Return Policy
Wells Fargo maintains a modest dividend payout ratio of around 5% in 2025, with a dividend yield near 0.35%. Dividend coverage by free cash flow appears weak, and the company continues share buybacks, but free cash flow per share is negative.
This payout approach, combined with buybacks despite constrained cash flow, suggests caution. While dividends and buybacks aim to support shareholder returns, reliance on potentially unsustainable distributions may risk long-term value creation.
Score analysis
Here is a radar chart illustrating Wells Fargo & Company’s key financial scores across several valuation and performance metrics:
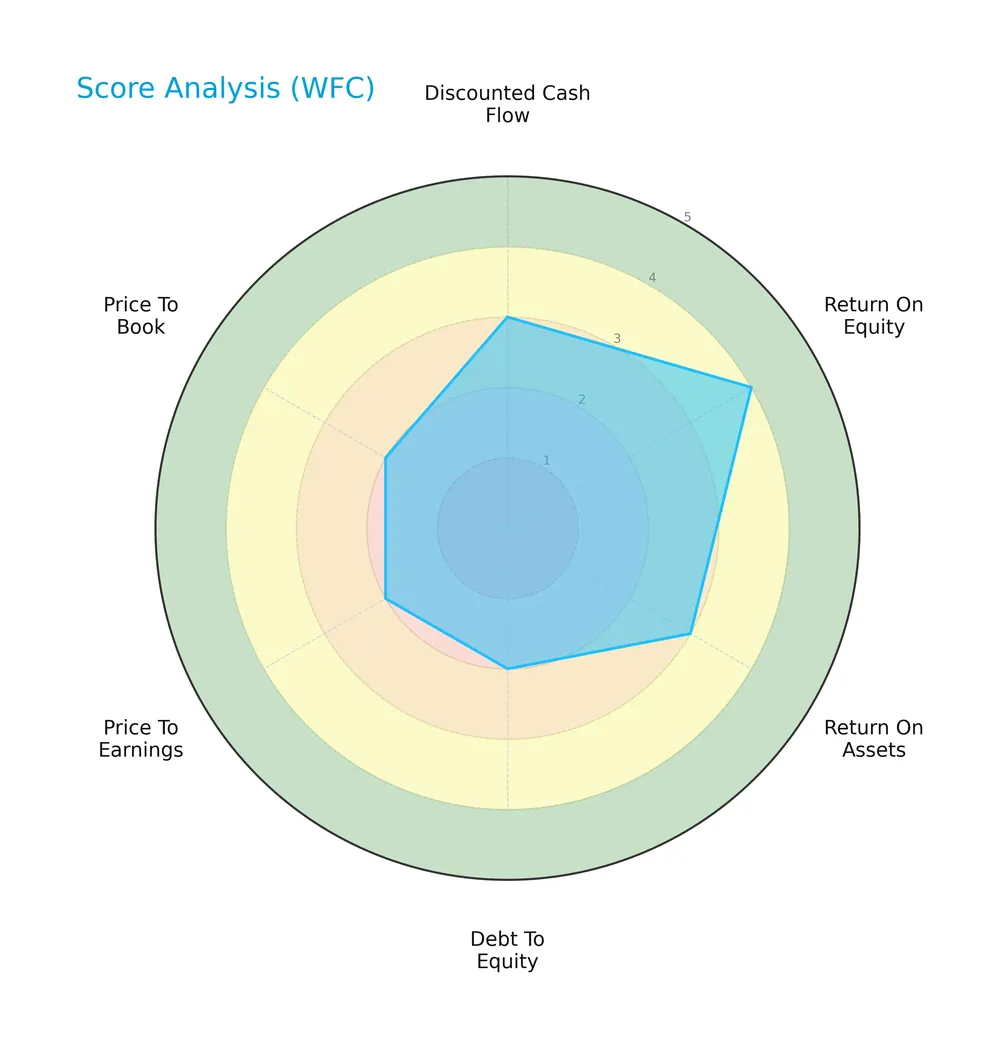
Wells Fargo shows moderate scores in discounted cash flow and return on assets, with a favorable return on equity. However, debt-to-equity, price-to-earnings, and price-to-book scores are unfavorable, indicating valuation and leverage concerns.
Analysis of the company’s bankruptcy risk
The Altman Z-Score places Wells Fargo in the distress zone, signaling a high risk of financial distress and potential bankruptcy:

Is the company in good financial health?
The Piotroski Score diagram reflects Wells Fargo’s average financial health based on key profitability and efficiency metrics:

With a Piotroski score of 5, the company shows moderate financial strength but does not stand out as a particularly strong value investment.
Competitive Landscape & Sector Positioning
This section explores Wells Fargo & Company’s strategic positioning, revenue streams, key products, and main competitors. I will assess whether Wells Fargo holds a competitive advantage over its peers in the diversified banking sector.
Strategic Positioning
Wells Fargo diversifies across four key segments: Community Banking, Wholesale Banking, Corporate and Investment Banking, and Wealth and Investment Management. Its broad product portfolio spans consumer, commercial, and institutional clients, primarily in the US, reflecting a concentrated geographic focus with diversified financial offerings.
Revenue by Segment
The pie chart illustrates Wells Fargo & Company’s revenue distribution by segment for the fiscal year 2024, highlighting the business’s core income sources.
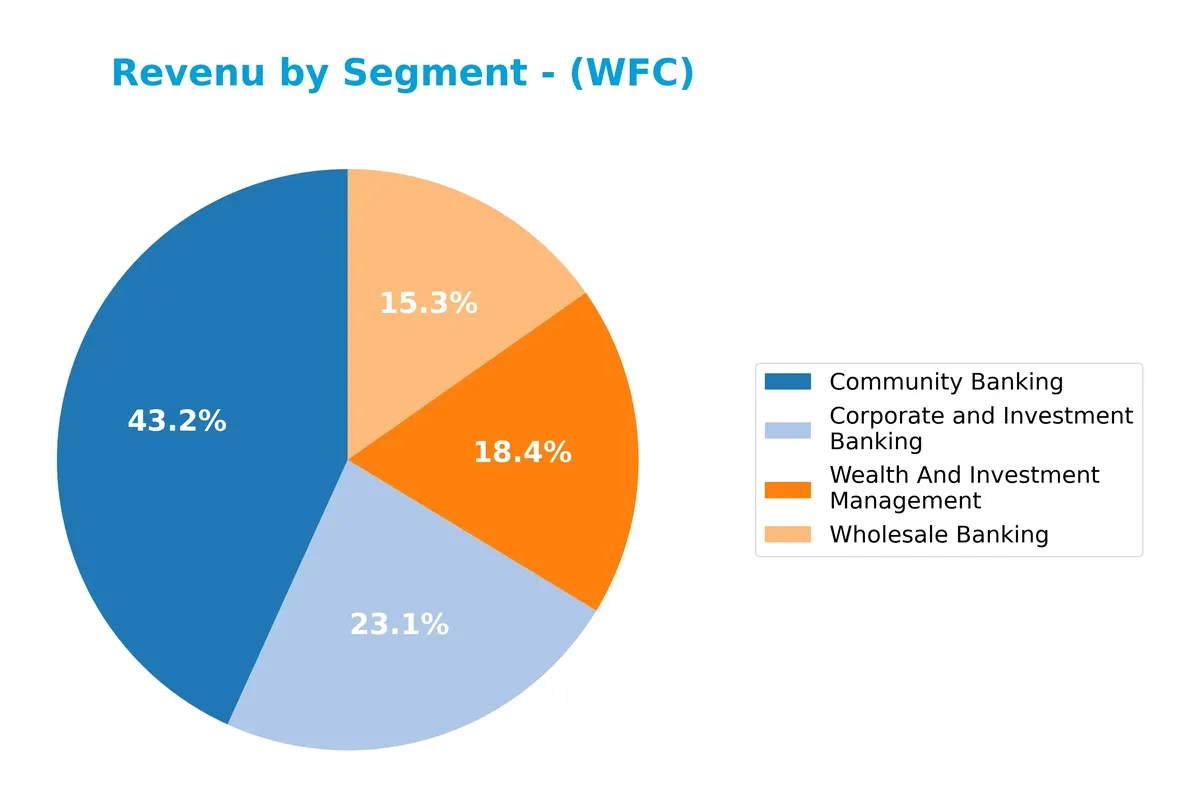
Community Banking leads with $36.2B, reflecting its role as Wells Fargo’s foundational revenue pillar. Corporate and Investment Banking and Wealth and Investment Management contribute $19.3B and $15.4B, respectively, showing steady importance. Wholesale Banking at $12.8B softened slightly from 2023’s peak. The 2024 data signals a modest revenue concentration in Community Banking but stable diversification across segments.
Key Products & Brands
The table below details Wells Fargo & Company’s main product lines and business segments:
| Product | Description |
|---|---|
| Consumer Banking and Lending | Offers checking, savings, credit and debit cards, plus home, auto, personal, and small business loans. |
| Commercial Banking | Provides banking, credit, secured lending, leasing, and treasury management services to private and public companies. |
| Corporate and Investment Banking | Delivers capital markets, investment banking, treasury management, real estate lending, equity, fixed income, trading. |
| Wealth and Investment Management | Provides personalized wealth management, brokerage, financial planning, lending, private banking, and trust services. |
Wells Fargo’s product mix spans retail to institutional clients, with Community Banking generating the largest revenue share, followed by Corporate and Investment Banking and Wealth Management. This diversification supports resilience across economic cycles.
Main Competitors
The sector includes 4 main competitors; below is the list of the top 10 leaders by market capitalization:
| Competitor | Market Cap. |
|---|---|
| JPMorgan Chase & Co. | 886B |
| Bank of America Corporation | 409B |
| Wells Fargo & Company | 310B |
| Citigroup Inc. | 221B |
Wells Fargo ranks 3rd among its competitors, holding about 30% of the market cap of JPMorgan Chase, the leader. It sits below both the average market cap of the top 10 (456B) and the median sector market cap (359B). The company maintains a 53.9% market cap gap to Bank of America above it.
Comparisons with competitors
Check out how we compare the company to its competitors:
Does WFC have a competitive advantage?
Wells Fargo currently lacks a strong competitive advantage, as its ROIC falls below WACC, indicating value destruction despite improving profitability. The bank’s overall moat status is slightly unfavorable.
Looking ahead, Wells Fargo’s diversified segments in consumer, commercial, corporate banking, and wealth management offer avenues for growth. New products and expanding markets could enhance future opportunities and improve competitive positioning.
SWOT Analysis
This analysis highlights Wells Fargo & Company’s key internal and external factors to guide strategic decisions.
Strengths
- strong brand and diversified financial services
- favorable net margin at 17.27%
- growing ROIC trend
Weaknesses
- ROIC below WACC indicates value destruction
- weak interest coverage at 0.63
- high debt-to-equity ratio
Opportunities
- expansion in wealth and investment management
- digital banking growth potential
- recovery in lending markets
Threats
- intense regulatory scrutiny
- rising interest expenses
- economic downturn risks
Wells Fargo’s strengths in diversified services and margin performance provide a solid base. However, persistent value destruction and leverage concerns require cautious capital allocation. The company must leverage digital innovation and wealth management growth while managing regulatory and macroeconomic risks carefully.
Stock Price Action Analysis
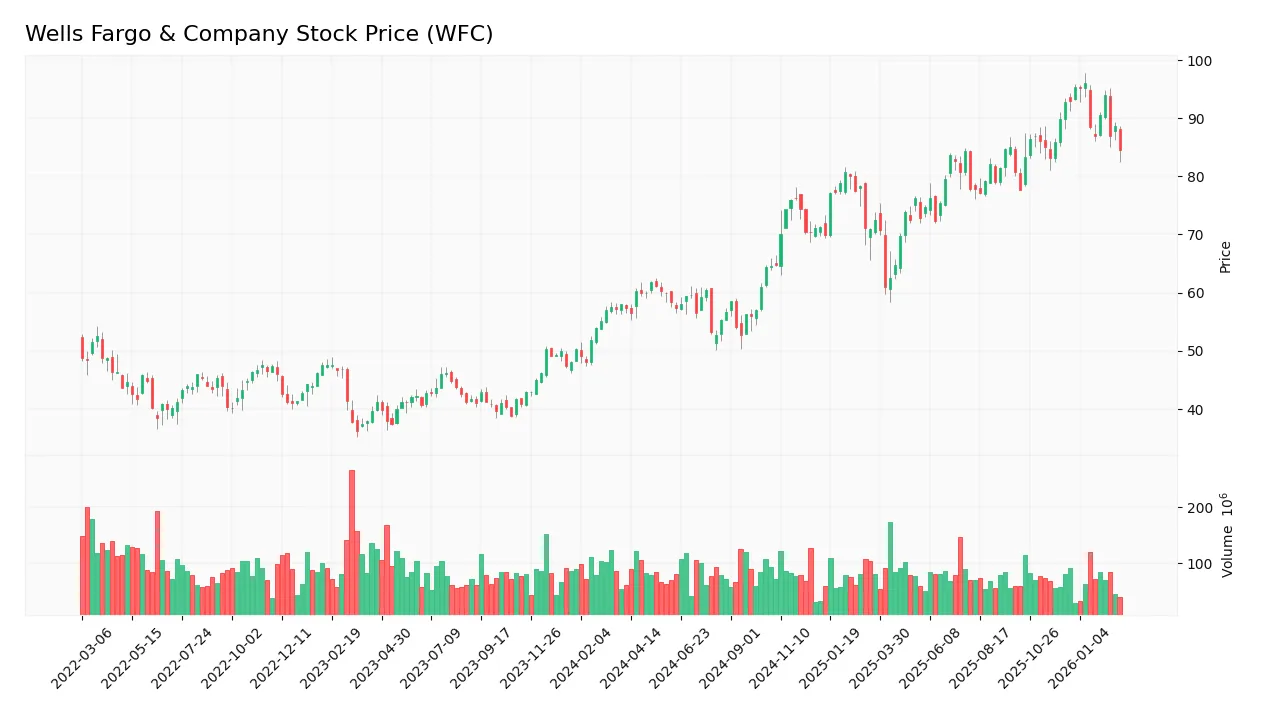
The weekly stock chart of Wells Fargo & Company (WFC) over the past 12 months illustrates significant price movements and volatility:
Trend Analysis
Over the past 12 months, WFC’s stock price rose 47.33%, indicating a bullish trend. The price accelerated earlier but showed deceleration recently. The stock traded between 52.76 and 95.95, with volatility measured by an 11.83% standard deviation.
Volume Analysis
Trading volume for WFC totals 9.7B shares, with buyer volume at 5.8B (59.8%) and seller volume at 3.8B. Volume is decreasing, and recent three-month data show slightly buyer-dominant activity (57.1%), suggesting moderate investor confidence amid waning participation.
Target Prices
Analysts set a clear target consensus for Wells Fargo & Company.
| Target Low | Target High | Consensus |
|---|---|---|
| 74 | 113 | 100 |
The target range reflects cautious optimism, with a consensus price near 100. Analysts expect moderate upside potential balanced by sector risks.

Don’t Let Luck Decide Your Entry Point
Optimize your entry points with our advanced ProRealTime indicators. You’ll get efficient buy signals with precise price targets for maximum performance. Start outperforming now!
Analyst & Consumer Opinions
This section examines Wells Fargo & Company’s recent analyst ratings alongside consumer feedback to gauge market perception.
Stock Grades
Here is the latest consensus and individual analyst grades for Wells Fargo & Company, reflecting diverse opinions and recent rating changes:
| Grading Company | Action | New Grade | Date |
|---|---|---|---|
| Baird | Upgrade | Neutral | 2026-02-13 |
| JP Morgan | Maintain | Neutral | 2026-02-09 |
| TD Cowen | Maintain | Hold | 2026-01-15 |
| RBC Capital | Maintain | Outperform | 2026-01-15 |
| Argus Research | Maintain | Buy | 2026-01-15 |
| Truist Securities | Maintain | Buy | 2026-01-15 |
| Evercore ISI Group | Maintain | Outperform | 2026-01-15 |
| TD Cowen | Maintain | Hold | 2026-01-07 |
| Baird | Downgrade | Underperform | 2026-01-06 |
| Truist Securities | Maintain | Buy | 2026-01-06 |
Analyst ratings show a mix of Buy, Hold, and Outperform grades with recent stability around Neutral from Baird and JP Morgan. The consensus remains Hold, indicating cautious investor sentiment amid varied opinions.
Consumer Opinions
Wells Fargo garners a mixed bag of consumer sentiment, reflecting its complex reputation in banking.
| Positive Reviews | Negative Reviews |
|---|---|
| Efficient online banking platform | Customer service often slow to respond |
| Competitive mortgage rates | Complaints about hidden fees |
| Wide ATM and branch network | Issues with account freezes |
| User-friendly mobile app | Frustration over dispute resolution |
Overall, customers praise Wells Fargo’s convenience and digital tools. However, persistent complaints about service responsiveness and fee transparency remain red flags for cautious investors.
Risk Analysis
Below is a summary of key risks facing Wells Fargo & Company, highlighting their probability and potential impact:
| Category | Description | Probability | Impact |
|---|---|---|---|
| Financial Distress | Altman Z-Score signals high bankruptcy risk (0.46, distress) | High | Very High |
| Capital Efficiency | ROIC (6.47%) below WACC (12.23%), destroying shareholder value | High | High |
| Leverage | Debt-to-Equity ratio unfavorable at 1.07, increasing risk | Medium | Medium |
| Liquidity | Current ratio extremely high (13.79), indicating inefficient asset use | Medium | Low |
| Profitability | Net margin strong (17.27%), but dividend yield low (0.35%) | Low | Low |
| Market Valuation | P/E (13.89) favorable but P/B (1.64) neutral | Medium | Medium |
| Interest Coverage | Very low (0.63), raising concerns about debt servicing ability | High | High |
Wells Fargo’s most urgent risks stem from its weak Altman Z-Score, signaling financial distress despite solid profitability. The firm’s ROIC failing to cover WACC implies capital is not generating adequate returns, a red flag for long-term value. Interest coverage below 1 raises alarms on debt servicing capacity amid volatile credit markets. Investors must weigh these risks carefully against the bank’s diversified revenue streams.
Should You Buy Wells Fargo & Company?
Wells Fargo appears to be in a slight value-destruction phase despite improving profitability and operational efficiency. Its leverage profile remains substantial, reflecting elevated financial risk. Supported by a very favorable overall B rating, the profile could be seen as moderate with caution advised.
Strength & Efficiency Pillars
Wells Fargo & Company posts a solid net margin of 17.27%, reflecting operational strength despite sector pressures. Its return on equity stands at a moderate 11.78%, while ROIC at 6.47% trails its WACC of 12.23%, indicating the company is currently shedding value rather than creating it. Nevertheless, the firm shows improving profitability trends, and favorable gross and EBIT margins of 64.8% and 20.4% respectively underscore efficient core operations.
Weaknesses and Drawbacks
The company is firmly in the financial distress zone with an Altman Z-Score of 0.46, signaling a high bankruptcy risk. This solvency concern overshadows other metrics. Additionally, debt-to-equity at 1.07 suggests elevated leverage, while a current ratio of 13.79 may indicate liquidity management issues. The interest coverage ratio of 0.63 raises red flags about the firm’s ability to service debt. Valuation multiples are mixed, with a reasonable P/E of 13.89 but a neutral P/B at 1.64.
Our Final Verdict about Wells Fargo & Company
Despite operational efficiencies and moderate profitability, Wells Fargo’s Altman Z-Score signals severe financial distress, making the investment profile highly speculative. The solvency risk dominates the outlook, and this caution trumps any positive earnings or margin trends. Investors seeking capital preservation should view this as too risky for conservative portfolios, regardless of the company’s recent market strength.
Disclaimer: This content is for informational purposes only and does not constitute financial, investment, or other professional advice. Investing in financial markets involves a significant risk of loss, and past performance is not indicative of future results.
Additional Resources
- Wells Fargo Lowers PT on PayPal Holdings, Inc. (PYPL) – Yahoo Finance (Feb 24, 2026)
- Wells Fargo upgrades Google parent Alphabet, says it has ‘3 key traits of AI winner’ – CNBC (Feb 23, 2026)
- Google Stock: Wells Fargo Upgrades On Three Traits Of “AI Winner” – Investor’s Business Daily (Feb 23, 2026)
- ‘Time to Get More Constructive,’ Says Wells Fargo on Alphabet Stock (GOOGL) – TipRanks (Feb 23, 2026)
- Qualcomm’s data center strategy prompts upgrade by Wells Fargo – Seeking Alpha (Feb 24, 2026)
For more information about Wells Fargo & Company, please visit the official website: wellsfargo.com