Home > Analyses > Utilities > WEC Energy Group, Inc.
WEC Energy Group powers millions of homes and businesses, weaving energy into daily life across the Midwest. It commands the regulated electric sector with a vast network of transmission lines and diverse generation sources, from renewables to traditional fuels. Renowned for steady innovation and reliability, WEC balances legacy infrastructure with clean energy ambitions. But as the energy landscape evolves rapidly, I ask: does WEC’s financial strength continue to support its growth and justify its valuation today?

Table of contents
Business Model & Company Overview
WEC Energy Group, Inc., founded in 1981 and headquartered in Milwaukee, Wisconsin, dominates the regulated electric sector in the US. It operates a vast energy ecosystem spanning natural gas, electricity, and renewable sources. This integrated approach supports a reliable energy supply across multiple states, leveraging coal, natural gas, hydroelectric, wind, solar, and biomass to meet diverse customer needs.
The company’s revenue engine balances regulated electric transmission and natural gas distribution with nonregulated renewable energy services. Its extensive infrastructure includes 35,800 miles of overhead lines and 50,900 miles of gas mains, serving millions nationwide. With a strategic footprint across the Americas and robust asset control, WEC Energy Group maintains a strong economic moat by blending regulated stability with growth in renewables.
Financial Performance & Fundamental Metrics
I analyze WEC Energy Group’s income statement, key financial ratios, and dividend payout policy to reveal its operational efficiency and shareholder value.
Income Statement
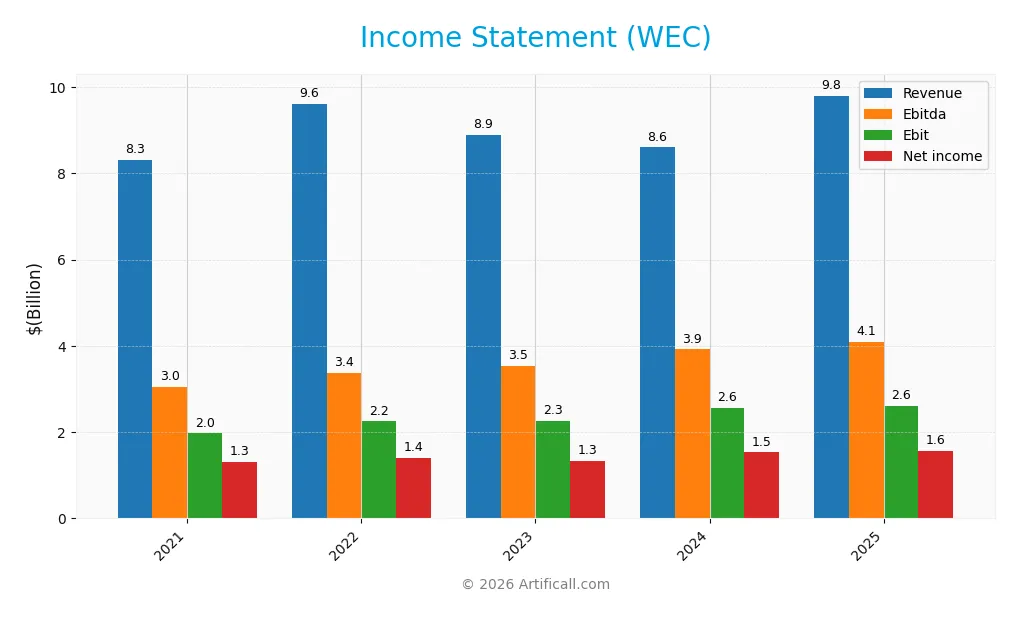
Below is WEC Energy Group, Inc.’s income statement showing key financial metrics for the fiscal years 2021 through 2025.
| 2021 | 2022 | 2023 | 2024 | 2025 | |
|---|---|---|---|---|---|
| Revenue | 8.32B | 9.60B | 8.89B | 8.60B | 9.80B |
| Cost of Revenue | 5.32B | 6.30B | 5.29B | 4.81B | 4.85B |
| Operating Expenses | 1.28B | 1.38B | 1.69B | 1.63B | 2.58B |
| Gross Profit | 3.00B | 3.30B | 3.60B | 3.79B | 4.95B |
| EBITDA | 3.04B | 3.37B | 3.53B | 3.92B | 4.08B |
| EBIT | 1.97B | 2.25B | 2.26B | 2.56B | 2.60B |
| Interest Expense | 471M | 515M | 727M | 815M | 895M |
| Net Income | 1.30B | 1.41B | 1.33B | 1.53B | 1.56B |
| EPS | 4.12 | 4.46 | 4.22 | 4.81 | 4.86 |
| Filing Date | 2022-02-24 | 2023-02-23 | 2024-02-22 | 2025-02-21 | 2026-02-20 |
Income Statement Evolution
WEC Energy Group’s revenue grew 18% from 2021 to 2025, with a sharp 14% rise in the last year. Gross profit expanded faster, rising over 30% year-over-year in 2025, lifting the gross margin to a favorable 50.55%. EBIT margin remained steady near 26.6%, signaling stable operational efficiency despite higher expenses.
Is the Income Statement Favorable?
In 2025, WEC posted $9.8B revenue and $1.56B net income, yielding a strong 15.9% net margin. Interest expense aligned neutrally at 9.13% of revenue, while operating expenses increased in line with revenue, a less favorable dynamic. Overall, 57% of income metrics were favorable, supporting a generally positive fundamental profile with some margin pressure risks.
Financial Ratios
The table below presents key financial ratios for WEC Energy Group, Inc. over recent fiscal years, illustrating profitability, liquidity, leverage, and valuation dynamics:
| Ratios | 2021 | 2022 | 2023 | 2024 | 2025 |
|---|---|---|---|---|---|
| Net Margin | 16% | 15% | 15% | 18% | 16% |
| ROE | 12% | 12% | 11% | 12% | 11% |
| ROIC | 4.0% | 3.9% | 3.9% | 4.1% | 5.2% |
| P/E | 23.5 | 21.0 | 19.9 | 19.5 | 22.0 |
| P/B | 2.80 | 2.59 | 2.26 | 2.39 | 2.52 |
| Current Ratio | 0.71 | 0.69 | 0.55 | 0.60 | 0.47 |
| Quick Ratio | 0.54 | 0.52 | 0.40 | 0.43 | 0.34 |
| D/E | 1.42 | 1.52 | 1.60 | 1.64 | 1.64 |
| Debt-to-Assets | 40% | 41% | 43% | 43% | 43% |
| Interest Coverage | 3.64 | 3.74 | 2.62 | 2.64 | 2.65 |
| Asset Turnover | 0.21 | 0.23 | 0.20 | 0.18 | 0.19 |
| Fixed Asset Turnover | 0.31 | 0.33 | 0.28 | 0.25 | 0.26 |
| Dividend Yield | 2.8% | 3.1% | 3.7% | 3.6% | 3.3% |
Evolution of Financial Ratios
WEC Energy Group’s Return on Equity (ROE) showed modest fluctuation, peaking near 12.3% in 2022-24 before settling at 11.4% in 2025. The Current Ratio steadily declined from 0.71 in 2021 to 0.47 in 2025, signaling weakening liquidity. Meanwhile, the Debt-to-Equity Ratio increased slightly, reaching 1.64 in 2025, indicating stable but elevated leverage. Profitability margins remained relatively stable over the period.
Are the Financial Ratios Favorable?
In 2025, WEC’s profitability shows mixed signals: a favorable net margin of 15.9% contrasts with a neutral ROE of 11.4% and ROIC of 5.25%, close to the WACC at 5.32%. Liquidity ratios are unfavorable, with a low Current Ratio of 0.47 and Quick Ratio of 0.34. Leverage remains high, with a Debt-to-Equity ratio at 1.64. Asset turnover metrics are weak, reflecting operational efficiency challenges. Dividend yield at 3.34% stands out positively. Overall, the ratio profile is slightly unfavorable.
Shareholder Return Policy
WEC Energy Group maintains a consistent dividend policy, with a payout ratio around 70-74% and an annual yield near 3.3-3.7%. Dividend payments are supported but stretch free cash flow coverage, indicating cautious capital allocation amid substantial capex.
The company engages in share buybacks, complementing dividends to return capital. This balanced approach supports sustainable long-term value creation, though investors should monitor cash flow trends given the high payout relative to free cash flow.
Score analysis
Here is a comprehensive overview of WEC Energy Group’s key financial scores and valuation metrics:
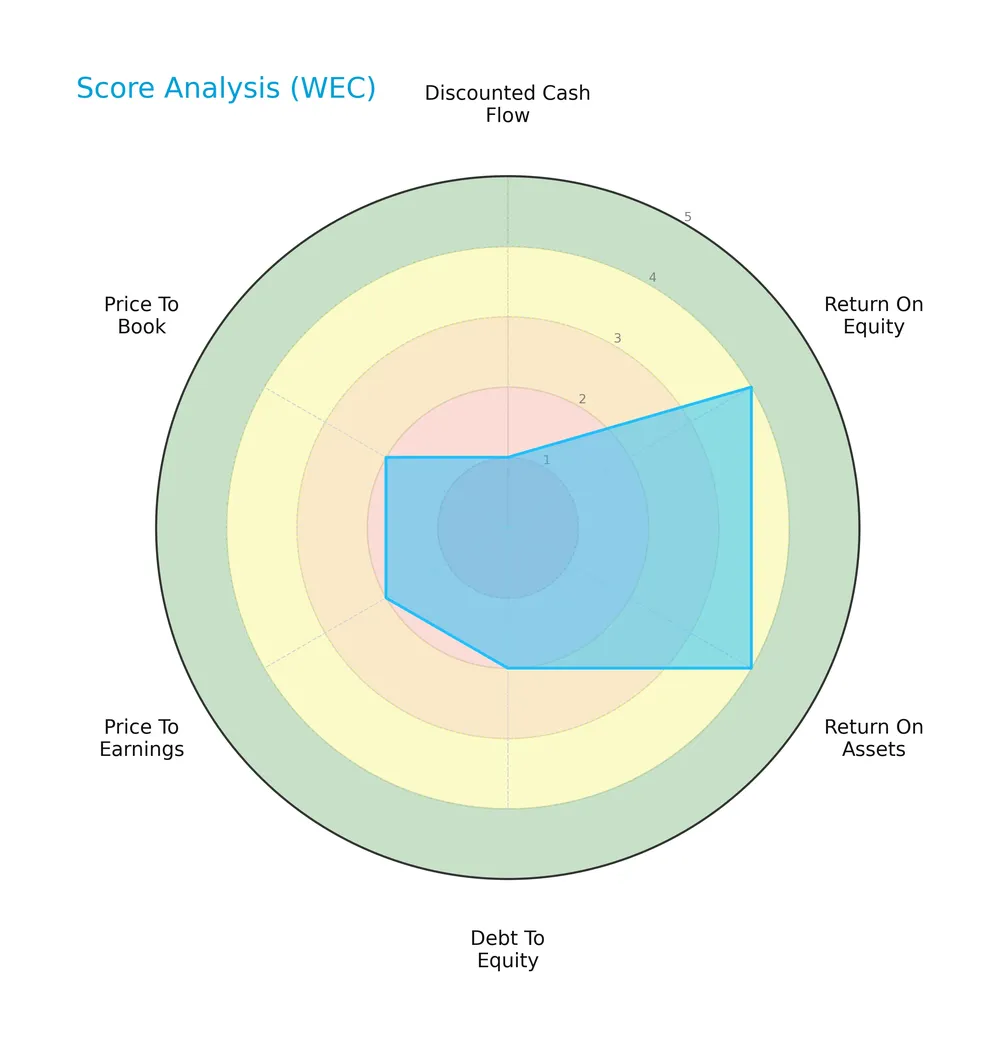
The company’s overall score is moderate at 3. Its discounted cash flow rating is very unfavorable (1), despite favorable returns on equity (4) and assets (4). Debt-to-equity, price-to-earnings, and price-to-book valuations all rate as unfavorable (2), signaling potential cost and leverage concerns.
Analysis of the company’s bankruptcy risk
WEC Energy Group’s Altman Z-Score places it in the distress zone, indicating a high probability of financial distress and potential bankruptcy risk:

Is the company in good financial health?
The Piotroski Score diagram illustrates WEC’s financial health with an average score of 6 points:

A score of 6 suggests moderate financial strength, reflecting a balance of profitable operations and some weaknesses. While not in the top tier, the company maintains a reasonable position but lacks the robustness of stronger peers.
Competitive Landscape & Sector Positioning
This sector analysis examines WEC Energy Group, Inc.’s strategic positioning, revenue segments, key products, and main competitors. I will assess whether WEC holds a competitive advantage within the regulated electric utilities industry.
Strategic Positioning
WEC Energy Group concentrates primarily in Wisconsin, generating $7.3B in 2025, with significant presence in Illinois ($1.7B) and smaller operations in other states and non-utility infrastructure. It maintains a diversified fuel mix and service segments but focuses geographically in the US Midwest.
Revenue by Segment
The pie chart displays WEC Energy Group’s revenue breakdown by segment for the fiscal year 2025, highlighting contributions from Illinois, Wisconsin, Non-Utility Energy Infrastructure, and Other States.
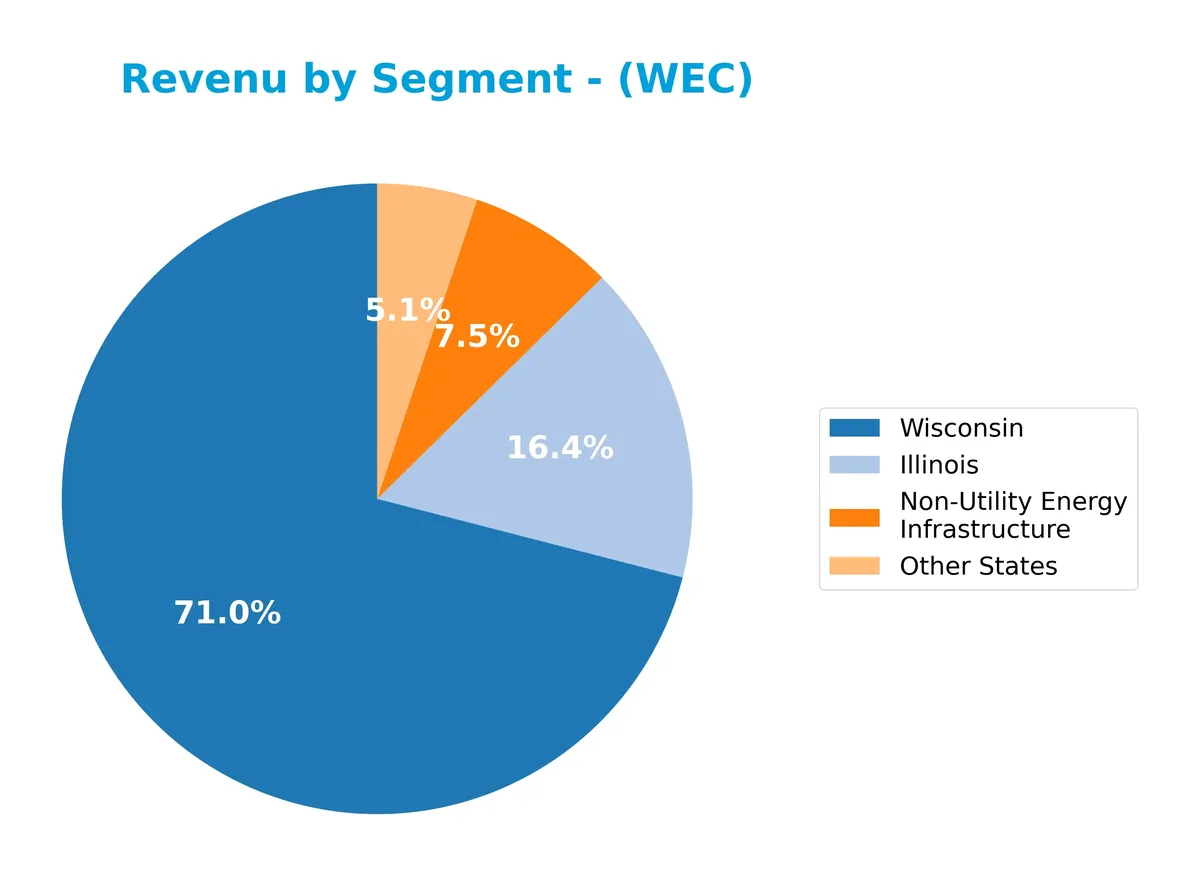
Wisconsin drives the business with $7.3B, followed by Illinois at $1.7B. Non-Utility Energy Infrastructure and Other States contribute $770M and $528M, respectively. Wisconsin’s steady growth contrasts with Illinois’ moderate gains. The Non-Utility segment shows gradual expansion, reducing concentration risks. Overall, the revenue mix reflects geographic diversification with Wisconsin remaining the dominant cash generator.
Key Products & Brands
The following table outlines WEC Energy Group’s main products and brands by segment and service:
| Product | Description |
|---|---|
| Wisconsin | Regulated electric and natural gas services in Wisconsin, including generation from coal, gas, oil, hydro, wind, solar, and biomass. |
| Illinois | Regulated electric and natural gas distribution operations serving Illinois customers. |
| Other States | Natural gas and electric services provided in states outside Wisconsin and Illinois. |
| Non-Utility Energy Infrastructure | Renewable and nonregulated energy services including generation, infrastructure, and energy sales. |
| Electric Transmission | Electric transmission services supporting grid reliability (reported separately in earlier years, now integrated). |
WEC Energy Group’s portfolio spans regulated utilities in Wisconsin and Illinois, supplemented by renewable and nonregulated energy infrastructure. The company’s diversified fuel mix and broad geographic footprint underpin stable, multi-segment revenue streams.
Main Competitors
There are 23 competitors in the Regulated Electric industry; below are the top 10 leaders by market capitalization:
| Competitor | Market Cap. |
|---|---|
| NextEra Energy, Inc. | 169B |
| The Southern Company | 96B |
| Duke Energy Corporation | 91B |
| American Electric Power Company, Inc. | 62B |
| Dominion Energy, Inc. | 51B |
| Exelon Corporation | 44B |
| Xcel Energy Inc. | 44B |
| Entergy Corporation | 42B |
| Public Service Enterprise Group Incorporated | 40B |
| Consolidated Edison, Inc. | 36B |
WEC Energy Group ranks 12th among 23 competitors, holding 22.07% of the market cap of the leader, NextEra Energy. It sits below the average market cap of the top 10 (67.5B) but above the sector median (34B). The company is 3.86% below its nearest competitor above, indicating a narrow gap at this tier.
Comparisons with competitors
Check out how we compare the company to its competitors:
Does WEC have a competitive advantage?
WEC Energy Group shows a slight competitive disadvantage, with ROIC below WACC indicating value destruction despite a growing profitability trend. Its regulated electric utility status supports stable margins but limits excess returns.
Looking ahead, WEC’s broad energy mix and expanding non-utility infrastructure segment offer growth opportunities. Continued investments in renewable sources and geographic diversification could improve future competitive positioning.
SWOT Analysis
This SWOT analysis highlights WEC Energy Group’s core competitive position and challenges to guide strategic decisions.
Strengths
- strong regulated utility footprint
- diversified energy sources including renewables
- stable dividend yield of 3.34%
Weaknesses
- low liquidity ratios (current ratio 0.47)
- high debt-to-equity (1.64)
- asset turnover below industry norms
Opportunities
- expanding renewable energy infrastructure
- regional revenue growth in Illinois and Non-Utility segments
- improving ROIC trend signals operational gains
Threats
- regulatory risks in the utilities sector
- rising operational expenses impacting margins
- Altman Z-score in distress zone signals financial risk
WEC Energy Group benefits from a solid utility base and growth in renewables but faces financial leverage and liquidity concerns. The company must cautiously balance expansion with risk management to sustain long-term value.
Stock Price Action Analysis
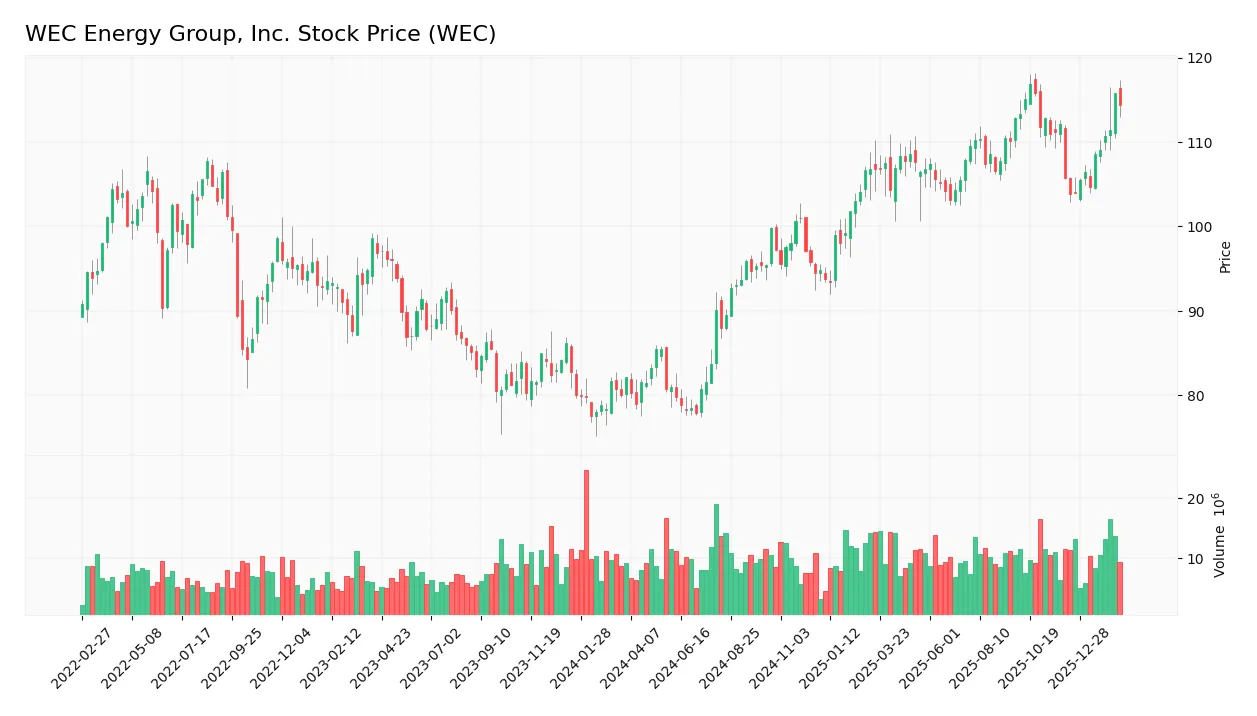
The weekly stock chart displays WEC Energy Group, Inc.’s price movement over the last 12 months, highlighting key support and resistance levels:
Trend Analysis
Over the past 12 months, WEC’s stock price rose 39.24%, indicating a bullish trend with accelerating momentum. The price fluctuated between a low of 77.85 and a high of 116.84, with volatility measured by a 10.88 standard deviation. Recent months show steady gains with an 8.16% increase and moderate volatility.
Volume Analysis
Trading volume over the last three months is increasing, with buyers dominating 66.95% of the activity. This buyer-driven volume suggests strengthening investor confidence and higher market participation supporting the upward price trend. Seller activity remains significantly lower, reinforcing bullish sentiment.
Target Prices
Analysts set a clear target consensus for WEC Energy Group, Inc. reflecting moderate upside potential.
| Target Low | Target High | Consensus |
|---|---|---|
| 105 | 135 | 121 |
The target range spans from $105 to $135, with a consensus near $121, indicating steady confidence in the stock’s growth prospects.

Don’t Let Luck Decide Your Entry Point
Optimize your entry points with our advanced ProRealTime indicators. You’ll get efficient buy signals with precise price targets for maximum performance. Start outperforming now!
Analyst & Consumer Opinions
This section examines the latest analyst ratings and consumer feedback on WEC Energy Group, Inc.’s market performance and reputation.
Stock Grades
Here are the latest verified stock grades for WEC Energy Group, Inc., reflecting recent analyst assessments:
| Grading Company | Action | New Grade | Date |
|---|---|---|---|
| Mizuho | Maintain | Outperform | 2026-02-06 |
| Jefferies | Maintain | Hold | 2026-01-28 |
| Barclays | Maintain | Equal Weight | 2026-01-22 |
| Wells Fargo | Maintain | Overweight | 2026-01-20 |
| JP Morgan | Maintain | Neutral | 2026-01-15 |
| B of A Securities | Maintain | Neutral | 2025-12-31 |
| UBS | Maintain | Neutral | 2025-12-17 |
| Barclays | Maintain | Equal Weight | 2025-12-16 |
| Keybanc | Maintain | Overweight | 2025-12-12 |
| JP Morgan | Maintain | Neutral | 2025-12-11 |
Analyst grades for WEC Energy Group remain largely stable, with a clear consensus toward holding or neutral stances. Occasional overweight and outperform ratings suggest moderate confidence amid a cautious market environment.
Consumer Opinions
Consumer sentiment around WEC Energy Group, Inc. reflects a blend of trust in its service reliability and concerns about cost management.
| Positive Reviews | Negative Reviews |
|---|---|
| Consistently reliable energy supply | Rising energy bills causing frustration |
| Responsive and helpful customer service | Occasional delays in outage restoration |
| Transparent communication during outages | Limited options for renewable energy |
Overall, consumers appreciate WEC’s dependable service and clear communication. However, recurring concerns about rising costs and slower outage recovery highlight areas needing improvement.
Risk Analysis
Below is a summary table outlining key risks facing WEC Energy Group, Inc., with their likelihood and potential impact:
| Category | Description | Probability | Impact |
|---|---|---|---|
| Financial Health | Altman Z-Score at 1.1 signals financial distress risk and potential bankruptcy | High | High |
| Liquidity | Low current ratio (0.47) and quick ratio (0.34) indicate weak short-term liquidity | Medium | Medium |
| Leverage | High debt-to-equity ratio (1.64) raises financial risk amid rising interest rates | Medium | High |
| Operational Efficiency | Low asset turnover (0.19) and fixed asset turnover (0.26) suggest asset underutilization | Medium | Medium |
| Market Valuation | Neutral P/E (22.0) and P/B (2.52) ratios may limit upside in a volatile market | Medium | Medium |
The most concerning risk is the distress-level Altman Z-Score, reflecting vulnerability to financial stress. Liquidity constraints and heavy leverage compound this risk amid tightening credit conditions. Operational inefficiencies also weigh on returns. Investors should watch these factors closely.
Should You Buy WEC Energy Group, Inc.?
WEC Energy Group appears to be improving profitability with a growing ROIC but remains in a slightly unfavorable moat position due to value destruction. Despite a substantial leverage profile and liquidity concerns, the company’s B- rating suggests a moderate investment profile.
Strength & Efficiency Pillars
WEC Energy Group, Inc. reports a solid operational profile, with a gross margin of 50.55% and an EBIT margin of 26.57%, both favorable indicators of efficiency. The net margin stands at 15.9%, reflecting effective cost control. Return on equity (11.42%) and return on invested capital (5.25%) show moderate profitability, yet ROIC trails the WACC of 5.32%, indicating the company is currently shedding value despite growing ROIC trends. Operational margins remain the primary strength amid financial challenges.
Weaknesses and Drawbacks
WEC is in financial distress with an Altman Z-Score of 1.11, signaling a high bankruptcy risk. This solvency concern overshadows profitability. The company’s leverage is elevated, with a debt-to-equity ratio of 1.64 and weak liquidity—current ratio at 0.47 and quick ratio at 0.34—raising red flags on short-term financial flexibility. Valuation metrics are neutral but do not compensate for the solvency risk. Asset turnover ratios are unfavorable, further dampening efficiency prospects.
Our Final Verdict about WEC Energy Group, Inc.
Despite operational margin strength, WEC’s distress-zone Z-Score of 1.11 makes its financial profile highly speculative. The risk of default outweighs profitability and growth signals. Investors seeking capital preservation may find the company too risky. Caution is warranted until solvency improves. The current profile might appear attractive only to those with high risk tolerance and a long-term recovery outlook.
Disclaimer: This content is for informational purposes only and does not constitute financial, investment, or other professional advice. Investing in financial markets involves a significant risk of loss, and past performance is not indicative of future results.
Additional Resources
- WEC Energy Rose 5% in the Last 30 Days. Here’s How Much the Stock Could Rise in 2026 – TIKR.com (Feb 21, 2026)
- Decoding WEC Energy Group Inc (WEC): A Strategic SWOT Insight – GuruFocus (Feb 21, 2026)
- Is WEC Energy Group, Inc. (WEC) One of the Best Infrastructure Stocks to Buy Right Now? – Yahoo Finance (Feb 19, 2026)
- WEC ENERGY GROUP, INC. SEC 10-K Report – TradingView (Feb 20, 2026)
- WEC Energy Group: Earnings Potential Tied To Capital Plan Execution – Seeking Alpha (Feb 16, 2026)
For more information about WEC Energy Group, Inc., please visit the official website: wecenergygroup.com