Home > Analyses > Healthcare > Waters Corporation
Waters Corporation powers breakthroughs in drug discovery and environmental safety with its advanced analytical instruments. Its cutting-edge liquid chromatography and mass spectrometry systems set industry standards globally. Known for innovation and precision, Waters shapes how laboratories solve complex scientific challenges. As the healthcare sector evolves, I examine whether Waters’ robust product portfolio and market position justify its current valuation and growth prospects heading into 2026.
Table of contents
Business Model & Company Overview
Waters Corporation, founded in 1958 and headquartered in Milford, Massachusetts, commands a leading position in medical diagnostics and research. Its ecosystem integrates high-performance liquid chromatography and mass spectrometry with advanced thermal analysis instruments. This cohesive platform supports diverse sectors, including life sciences and environmental testing, driving innovation across drug development and quality assurance.
The company generates value through a balanced mix of hardware sales, consumables, and post-warranty services. Waters maintains a strong footprint across Americas, Europe, and Asia, leveraging software solutions that enhance instrument performance worldwide. Its competitive advantage lies in the seamless integration of precision instruments and support products, building a robust economic moat that shapes the future of analytical measurement.
Financial Performance & Fundamental Metrics
I analyze Waters Corporation’s income statement, key financial ratios, and dividend payout policy to reveal its underlying financial health and shareholder value approach.
Income Statement
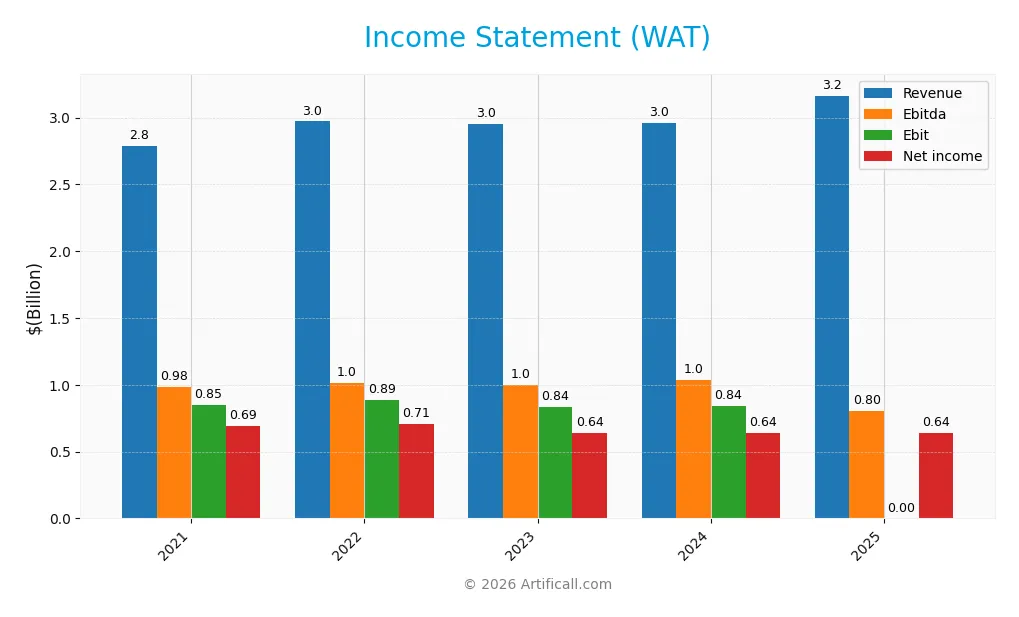
Below is the Waters Corporation income statement summary for the fiscal years 2021 through 2025, showing key profitability and expense metrics.
| 2021 | 2022 | 2023 | 2024 | 2025 | |
|---|---|---|---|---|---|
| Revenue | 2.79B | 2.97B | 2.96B | 2.96B | 3.17B |
| Cost of Revenue | 1.16B | 1.25B | 1.20B | 1.20B | 1.34B |
| Operating Expenses | 808M | 850M | 944M | 932M | 935M |
| Gross Profit | 1.63B | 1.72B | 1.76B | 1.76B | 1.83B |
| EBITDA | 983M | 1.02B | 1.00B | 1.04B | 1.10B |
| EBIT | 851M | 887M | 835M | 845M | 893M |
| Interest Expense | 45M | 49M | 99M | 90M | 51M |
| Net Income | 693M | 708M | 642M | 638M | 643M |
| EPS | 11.25 | 11.80 | 10.87 | 10.75 | 10.80 |
| Filing Date | 2022-02-24 | 2023-02-27 | 2024-02-27 | 2025-02-25 | 2026-02-23 |
Income Statement Evolution
Waters Corporation’s revenue grew 7% in 2025, continuing a moderate upward trend since 2021. Gross profit rose 4% year-over-year, but net income declined 1%, reflecting pressure on profitability. Margins remain robust, with gross margin steady near 58%, while net margin contracted slightly, marking some erosion in bottom-line efficiency.
Is the Income Statement Favorable?
In 2025, Waters shows strong fundamentals with a 28% EBIT margin and a favorable 1.6% interest expense ratio. Despite a slight net margin decline to 20.3%, operating income grew 6%, driven by disciplined cost control. Overall, the income statement reflects solid operational performance tempered by moderate net income challenges.
Financial Ratios
The table below presents key financial ratios for Waters Corporation from 2021 to 2025, illustrating profitability, leverage, liquidity, valuation, and operational efficiency:
| Ratios | 2021 | 2022 | 2023 | 2024 | 2025 |
|---|---|---|---|---|---|
| Net Margin | 25% | 24% | 22% | 22% | 20% |
| ROE | 189% | 140% | 56% | 35% | 25% |
| ROIC | 29% | 29% | 18% | 18% | 15% |
| P/E | 33.1 | 29.0 | 30.3 | 34.5 | 35.2 |
| P/B | 62.4 | 40.7 | 16.9 | 12.0 | 8.8 |
| Current Ratio | 2.39 | 2.24 | 2.22 | 2.11 | 0 |
| Quick Ratio | 1.87 | 1.66 | 1.57 | 1.51 | 0 |
| D/E | 4.36 | 3.30 | 2.12 | 0.93 | 0.55 |
| Debt-to-Assets | 52% | 51% | 53% | 37% | 28% |
| Interest Coverage | 18.3 | 17.9 | 8.3 | 9.2 | 17.6 |
| Asset Turnover | 0.90 | 0.91 | 0.64 | 0.65 | 0.62 |
| Fixed Asset Turnover | 4.40 | 4.44 | 4.09 | 4.08 | 4.93 |
| Dividend Yield | 0% | 0% | 0% | 0% | 0% |
Evolution of Financial Ratios
Waters Corporation’s Return on Equity (ROE) declined from a peak of 188.5% in 2021 to 25.1% in 2025, showing normalization after exceptional profitability. The Current Ratio remained stable above 2.1 until 2024 but dropped to 0 in 2025, indicating a significant liquidity shift. Debt-to-Equity Ratio improved markedly from 4.36 in 2021 to 0.55 in 2025, reflecting reduced leverage.
Are the Financial Ratios Favorable?
In 2025, profitability metrics like net margin (20.3%) and ROE (25.1%) are favorable, demonstrating solid returns above the 8.74% WACC. Liquidity ratios are unfavorable, with a zero current and quick ratio signaling potential short-term risk. Leverage is neutral with a 0.55 debt-to-equity ratio, while efficiency shows mixed signals: asset turnover is neutral, but fixed asset turnover is favorable. Valuation multiples, including P/E and P/B, are unfavorable, and the zero dividend yield may deter income-focused investors. Overall, ratios appear slightly favorable but warrant caution on liquidity and valuation grounds.
Shareholder Return Policy
Waters Corporation does not pay dividends, reflecting a reinvestment strategy rather than direct shareholder payouts. The company maintains no dividend payout ratio or yield; instead, it prioritizes free cash flow generation, with a solid free cash flow per share around 9,071 in 2025.
The absence of dividends aligns with Waters’ focus on growth and capital allocation towards operations or acquisitions. The company does not report share buybacks, indicating a cautious approach to shareholder returns. This policy supports sustainable long-term value creation by reinvesting profits rather than distributing cash prematurely.
Score analysis
The following radar chart presents a comprehensive view of Waters Corporation’s key financial scores across valuation, profitability, and leverage:
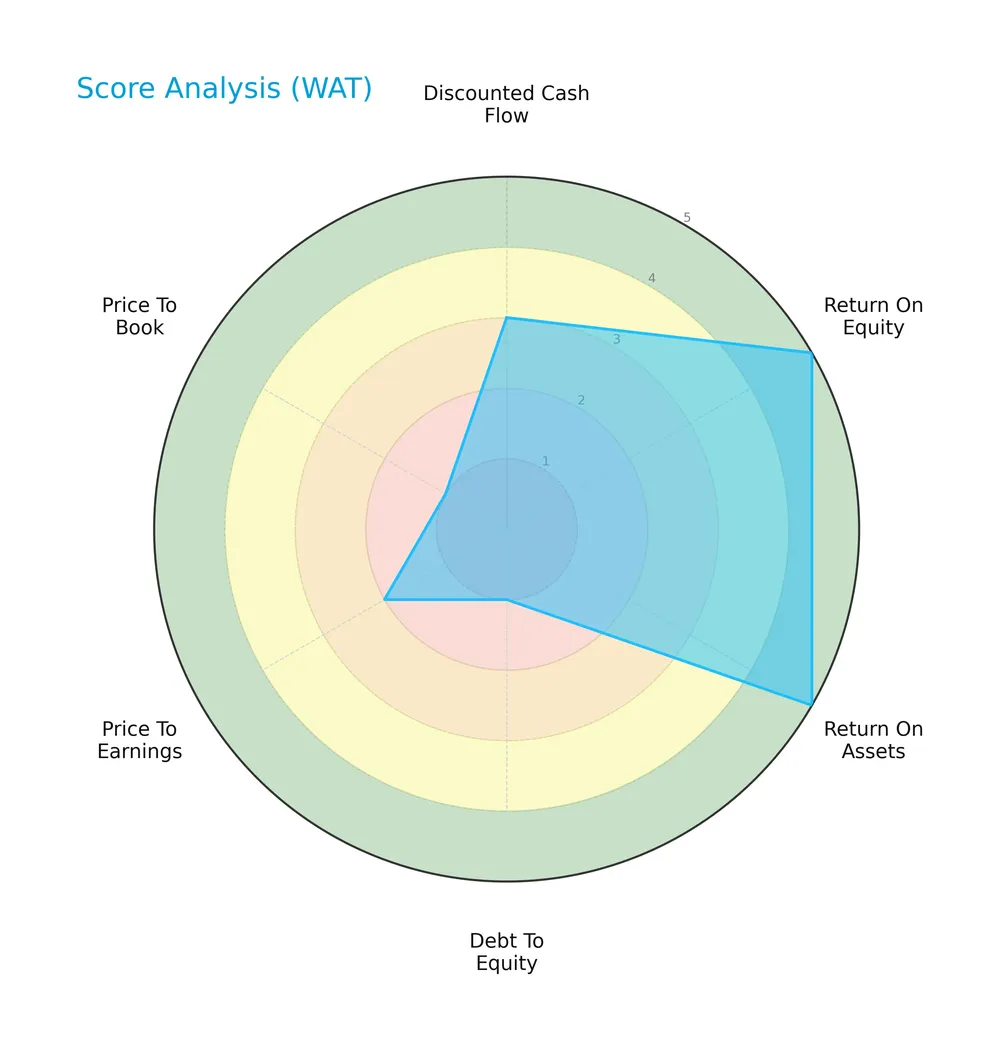
Waters Corporation scores very favorably on return on equity and assets with top marks of 5 each. However, valuation metrics show weakness, with price-to-book at 1 and price-to-earnings at 2, signaling less attractive pricing. Debt-to-equity also scores low at 2, indicating elevated leverage risk.
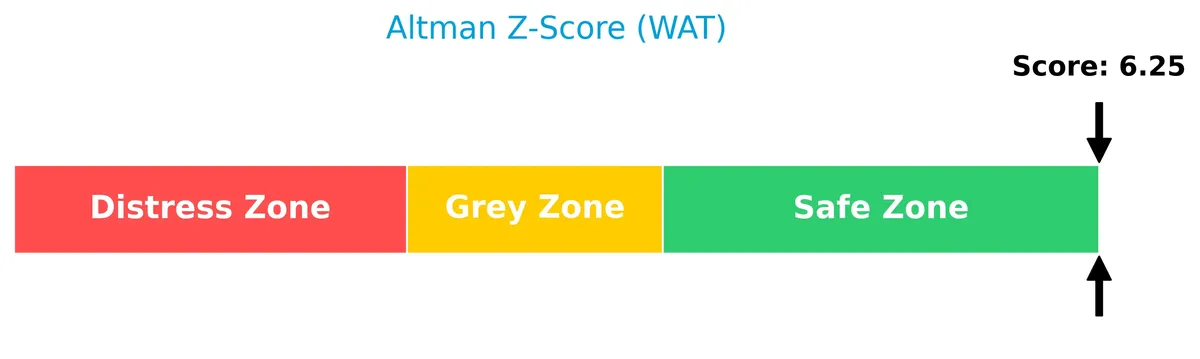
Analysis of the company’s bankruptcy risk
Waters Corporation’s Altman Z-Score places it securely in the safe zone, reflecting low bankruptcy risk and strong financial stability:
Is the company in good financial health?
The Piotroski Score diagram illustrates Waters Corporation’s moderate financial health based on key profitability and efficiency metrics:

With a Piotroski Score of 5, Waters Corporation demonstrates average financial strength, suggesting a balanced but not robust financial condition relative to high-quality benchmarks.
Competitive Landscape & Sector Positioning
This section analyzes Waters Corporation’s sector positioning, revenue segments, key products, and main competitors. I will assess whether Waters holds a competitive advantage in the Medical – Diagnostics & Research industry.
Strategic Positioning
Waters Corporation maintains a diversified product portfolio spanning chromatography, mass spectrometry, and thermal analysis systems, complemented by consumables and services. Geographically, its revenue is balanced across Americas (1.16B), Asia Pacific (1.04B), and Europe (963M), reflecting broad global exposure within the healthcare diagnostics sector.
Revenue by Segment
This pie chart illustrates Waters Corporation’s revenue distribution across key product segments for the fiscal year 2025.
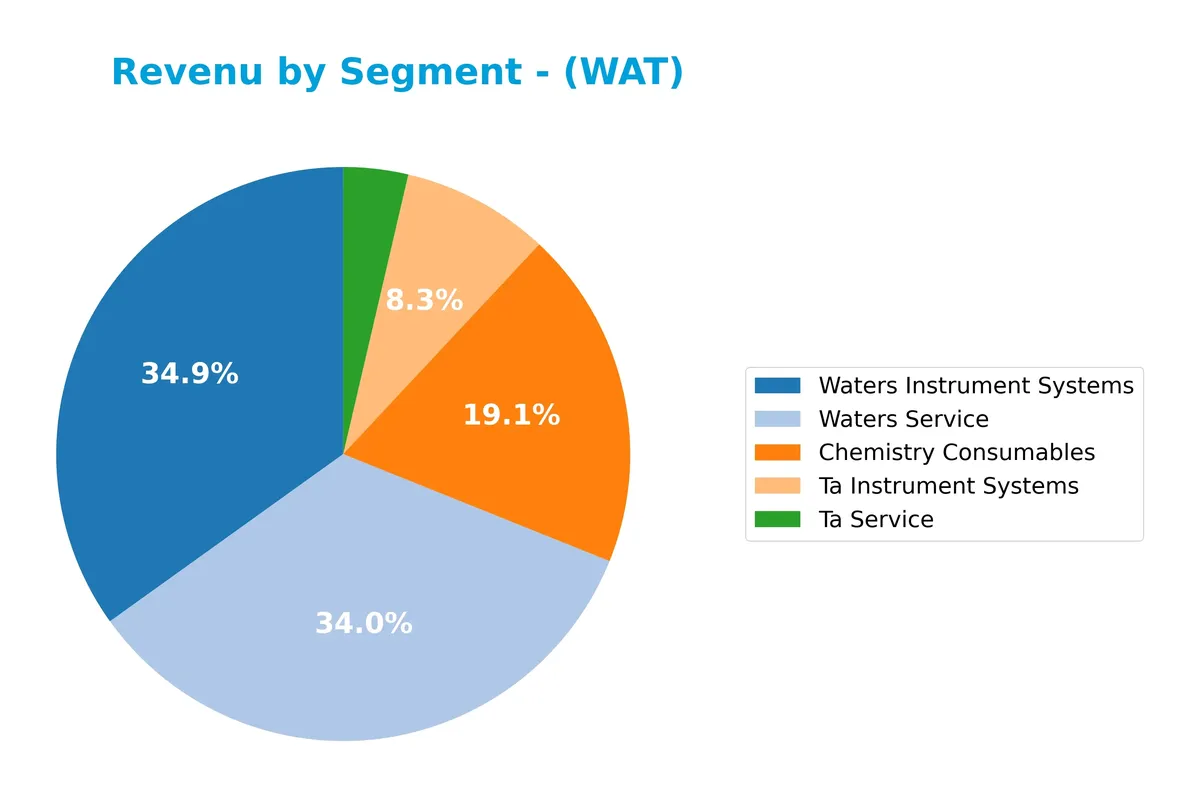
Waters Instrument Systems leads with $1.1B, closely followed by Waters Service at $1.08B, highlighting the company’s strong instrumentation and after-sales support. Chemistry Consumables contribute $631M, showing steady growth since 2018. TA Instrument Systems and TA Service, smaller but stable segments at $244M and $108M respectively, indicate a balanced portfolio. The 2025 figures reveal accelerating sales in consumables and services, reducing concentration risk.
Key Products & Brands
The table below outlines Waters Corporation’s principal products and brands with their descriptions:
| Product | Description |
|---|---|
| Chemistry Consumables | Consumable products supporting chromatography and mass spectrometry instruments, essential for analytical workflows. |
| TA Instrument Systems | Thermal analysis, rheometry, and calorimetry instruments used to assess material stability and suitability. |
| TA Service | Post-warranty service plans and support for TA instrument systems, ensuring operational reliability. |
| Waters Instrument Systems | High and ultra-performance liquid chromatography and mass spectrometry systems for drug discovery and other applications. |
| Waters Service | Maintenance and support services for Waters instrument systems, critical for sustained analytical performance. |
Waters Corporation’s portfolio combines sophisticated instruments and consumables with comprehensive service offerings. This integrated approach supports diverse sectors from pharmaceuticals to environmental testing.
Main Competitors
The sector includes 11 competitors, with the table below listing the top 10 leaders by market capitalization:
| Competitor | Market Cap. |
|---|---|
| Thermo Fisher Scientific Inc. | 225B |
| Danaher Corporation | 165B |
| IDEXX Laboratories, Inc. | 53.5B |
| Agilent Technologies, Inc. | 39.1B |
| IQVIA Holdings Inc. | 38.4B |
| Mettler-Toledo International Inc. | 28.8B |
| Waters Corporation | 22.7B |
| Quest Diagnostics Incorporated | 19.4B |
| Revvity, Inc. | 11.6B |
| Charles River Laboratories International, Inc. | 10B |
Waters Corporation ranks 7th among its competitors, with a market cap roughly 8.7% that of the leader, Thermo Fisher Scientific. It sits below both the average market cap of the top 10 (61.3B) and the sector median (28.8B). The company maintains a significant 47.7% gap to the next larger competitor, Mettler-Toledo.
Comparisons with competitors
Check out how we compare the company to its competitors:
Does WAT have a competitive advantage?
Waters Corporation presents a competitive advantage, creating value with a ROIC 6.2% above its WACC, signaling efficient capital use and profitability. However, its profitability shows a declining trend, indicating emerging challenges.
Looking ahead, Waters operates across diverse regions with strong presence in the Americas, Asia Pacific, and Europe. Continued innovation in high-performance liquid chromatography and mass spectrometry systems offers growth opportunities in pharmaceutical and environmental testing markets.
SWOT Analysis
This SWOT analysis highlights Waters Corporation’s key strategic factors to guide informed investment decisions.
Strengths
- strong gross margin at 57.8%
- robust EBIT margin of 28.2%
- solid ROE at 25.1%
Weaknesses
- declining ROIC trend signals weakening profitability
- high valuation multiples (PE 35.2, PB 8.8)
- no dividend yield limits income appeal
Opportunities
- expanding presence in Asia Pacific with consistent revenue growth
- growing demand for analytical instruments in pharma R&D
- software integration can boost recurring revenues
Threats
- rising competition in diagnostics and research instruments
- macroeconomic sensitivity affecting capital spending
- technological obsolescence risk in measurement solutions
Waters Corporation excels with healthy margins and returns but faces pressure from valuation and declining profitability trends. Its growth strategy should focus on leveraging geographic expansion and tech innovation while managing competitive and market risks prudently.
Stock Price Action Analysis
The upcoming weekly stock chart illustrates Waters Corporation’s price fluctuations over the last 12 months and highlights key support and resistance levels:
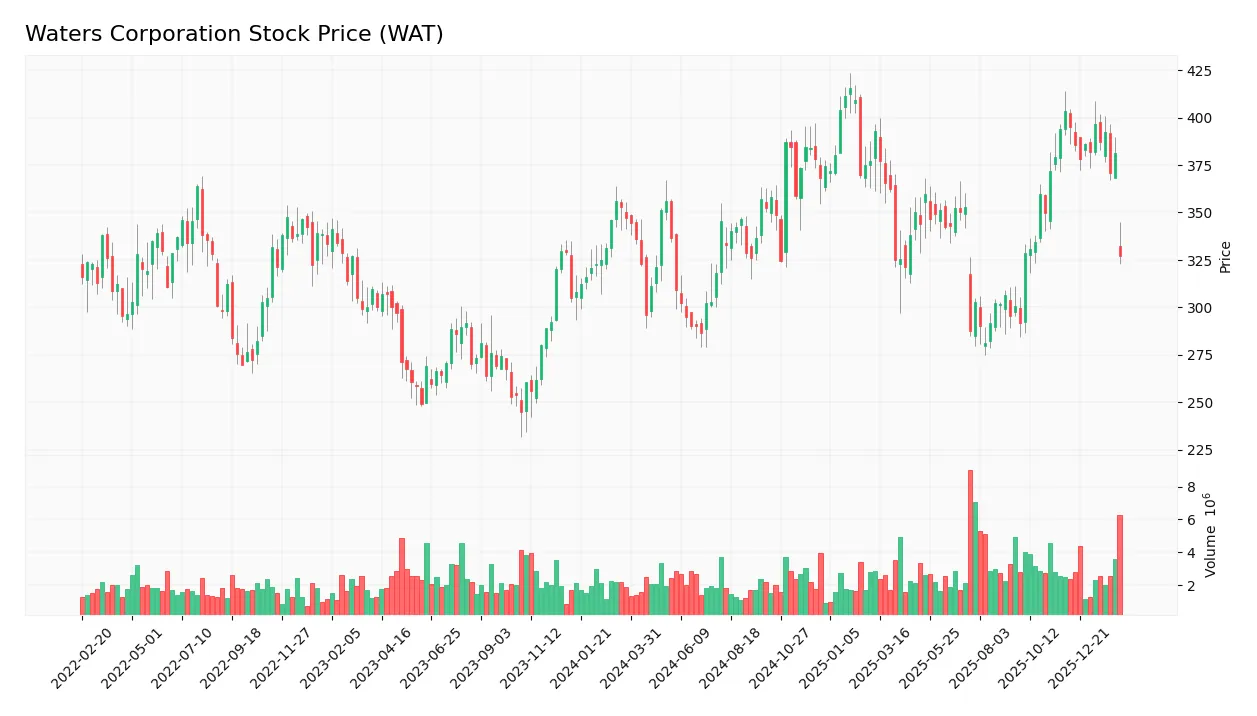
Trend Analysis
Over the past year, WAT’s stock price declined by 2.43%, indicating a bearish trend. The price showed a deceleration in this downtrend, with a high of 415.48 and a low of 281.2. Volatility remains significant, with a 34.2 standard deviation.
Volume Analysis
Trading volume has increased recently, with buyers accounting for 53% overall. However, the last three months show seller dominance at 67%, indicating cautious or negative investor sentiment and reduced buying interest.
Target Prices
Analysts set a clear target consensus for Waters Corporation, signaling measured optimism.
| Target Low | Target High | Consensus |
|---|---|---|
| 350 | 480 | 401 |
The target range from 350 to 480 reflects confidence in growth potential, with a consensus near 400 indicating balanced expectations.

Don’t Let Luck Decide Your Entry Point
Optimize your entry points with our advanced ProRealTime indicators. You’ll get efficient buy signals with precise price targets for maximum performance. Start outperforming now!
Analyst & Consumer Opinions
This section examines the latest analyst ratings and consumer feedback concerning Waters Corporation’s performance and market perception.
Stock Grades
The following table summarizes recent analyst grades for Waters Corporation from leading financial institutions:
| Grading Company | Action | New Grade | Date |
|---|---|---|---|
| Morgan Stanley | Maintain | Equal Weight | 2026-02-23 |
| Wells Fargo | Maintain | Equal Weight | 2026-02-11 |
| UBS | Maintain | Neutral | 2026-02-10 |
| B of A Securities | Maintain | Neutral | 2026-02-10 |
| Guggenheim | Maintain | Buy | 2026-02-10 |
| Wells Fargo | Maintain | Equal Weight | 2025-12-15 |
| Wolfe Research | Upgrade | Outperform | 2025-12-10 |
| Wells Fargo | Maintain | Equal Weight | 2025-11-05 |
| TD Cowen | Maintain | Hold | 2025-11-05 |
| JP Morgan | Maintain | Neutral | 2025-10-09 |
The majority of recent grades cluster around “Equal Weight” and “Neutral,” indicating a cautious stance. Wolfe Research’s upgrade to “Outperform” and Guggenheim’s “Buy” rating stand out as more optimistic views amid general market neutrality.
Consumer Opinions
Waters Corporation inspires mixed emotions among its users, reflecting a blend of trust and areas needing improvement.
| Positive Reviews | Negative Reviews |
|---|---|
| “Exceptional product accuracy and reliability.” | “Customer service response times are slow.” |
| “Innovative analytical solutions that boost labs.” | “High cost of instruments limits accessibility.” |
| “Strong technical support and training programs.” | “Software interface feels outdated compared to competitors.” |
Overall, consumers praise Waters for product precision and innovation. However, cost concerns and service delays recur as notable drawbacks. These insights suggest strengths in technology but highlight operational areas to refine.
Risk Analysis
Below is a summary table outlining the main risks facing Waters Corporation in 2026:
| Category | Description | Probability | Impact |
|---|---|---|---|
| Valuation Risk | High P/E (35.17) and P/B (8.83) ratios suggest overvaluation by market standards | Medium | High |
| Liquidity Risk | Current and quick ratios at 0 indicate potential short-term liquidity issues | Low | High |
| Debt Risk | Moderate debt-to-equity ratio (0.55) with favorable interest coverage | Medium | Medium |
| Market Volatility | Beta of 1.18 implies higher sensitivity to market swings | Medium | Medium |
| Dividend Policy | No dividend yield reduces income appeal and may signal limited cash returns | Low | Low |
The most pressing concerns are valuation and liquidity risks. Waters trades at premium multiples compared to the S&P 500 average P/E near 20. Such a rich valuation heightens downside in a market correction. Meanwhile, zero current and quick ratios are red flags for working capital management, potentially constraining operational flexibility. However, strong profitability and a safe Altman Z-score (6.29) mitigate bankruptcy risk. Prudence demands monitoring liquidity closely before committing new capital.
Should You Buy Waters Corporation?
Waters Corporation appears to be a profitable company with a slightly favorable moat, showing value creation despite declining ROIC. Its leverage profile is manageable but presents some concerns. The overall rating of B+ suggests a solid, yet cautious, investment profile.
Strength & Efficiency Pillars
Waters Corporation exhibits solid profitability with a net margin of 20.3% and a return on equity of 25.09%. Its return on invested capital (ROIC) stands at 14.96%, comfortably above the weighted average cost of capital (WACC) at 8.74%, confirming the company as a clear value creator. Operational margins remain robust, supported by a strong gross margin of 57.77% and an EBIT margin of 28.22%. These metrics underscore efficient capital use and sustained value generation despite a moderate decline in ROIC over time.
Weaknesses and Drawbacks
While Waters Corporation resides in the safe zone with an Altman Z-Score of 6.29, valuation metrics raise concerns. The price-to-earnings ratio at 35.17 signals a premium valuation, potentially limiting upside. Price-to-book at 8.83 is notably high, indicating market expectations may be elevated. Liquidity ratios are unfavorable; the current and quick ratios are both reported as zero, suggesting potential short-term liquidity risks. Recent market activity shows seller dominance with only 33.04% buyer volume, creating short-term headwinds on the stock price.
Our Final Verdict about Waters Corporation
Waters Corporation presents a fundamentally sound profile with strong profitability and clear value creation. However, its premium valuation and recent seller dominance suggest caution. Despite long-term strength, recent market pressure warrants a wait-and-see approach for a better entry point. The safe solvency standing makes the profile less risky, but investors should remain vigilant about liquidity and valuation risks.
Disclaimer: This content is for informational purposes only and does not constitute financial, investment, or other professional advice. Investing in financial markets involves a significant risk of loss, and past performance is not indicative of future results.
Additional Resources
- Decoding Waters Corp (WAT): A Strategic SWOT Insight – GuruFocus (Feb 24, 2026)
- BD Completes Combination of Biosciences & Diagnostic Solutions Business with Waters Corporation – Becton Dickinson (Feb 09, 2026)
- Waters Shareholders Approve Combination with BD’s Biosciences & Diagnostic Solutions Business – PR Newswire (Jan 27, 2026)
- Waters Corporation (WAT) Stock Analysis: Unlocking 19.42% Potential Upside in the Healthcare Diagnostics Sector – DirectorsTalk Interviews (Feb 23, 2026)
- What Are Wall Street Analysts’ Target Price for Waters Corporation Stock? – Barchart.com (Feb 20, 2026)
For more information about Waters Corporation, please visit the official website: waters.com