Home > Analyses > Industrials > Waste Management, Inc.
Waste Management, Inc. transforms daily waste into essential environmental solutions across North America. It dominates the waste management industry with a vast network of landfills, recycling facilities, and waste-to-energy operations. Renowned for innovation and operational excellence, WM sets the standard for sustainability and efficiency. As environmental regulations tighten and demand for circular economy solutions grows, I examine whether WM’s strong fundamentals justify its premium valuation and future growth prospects.

Table of contents
Business Model & Company Overview
Waste Management, Inc. stands as the leading provider in the waste management industry, founded in 1987 and headquartered in Houston, Texas. It operates an extensive ecosystem spanning collection, recycling, landfill management, and environmental services. This comprehensive approach serves residential, commercial, industrial, and municipal clients across North America, underpinned by a fleet of transfer stations, material recovery facilities, and landfills.
The company’s revenue engine balances collection fees with value-added recycling brokerage and landfill gas-to-energy operations. Its strategic footprint covers critical North American markets, leveraging specialized services like hazardous waste disposal and in-plant consulting. Waste Management’s competitive advantage lies in its scale and integrated infrastructure, creating a durable economic moat that shapes the future of environmental waste solutions.
Financial Performance & Fundamental Metrics
I analyze Waste Management, Inc.’s income statement, key financial ratios, and dividend payout policy to reveal its core profitability and shareholder return dynamics.
Income Statement
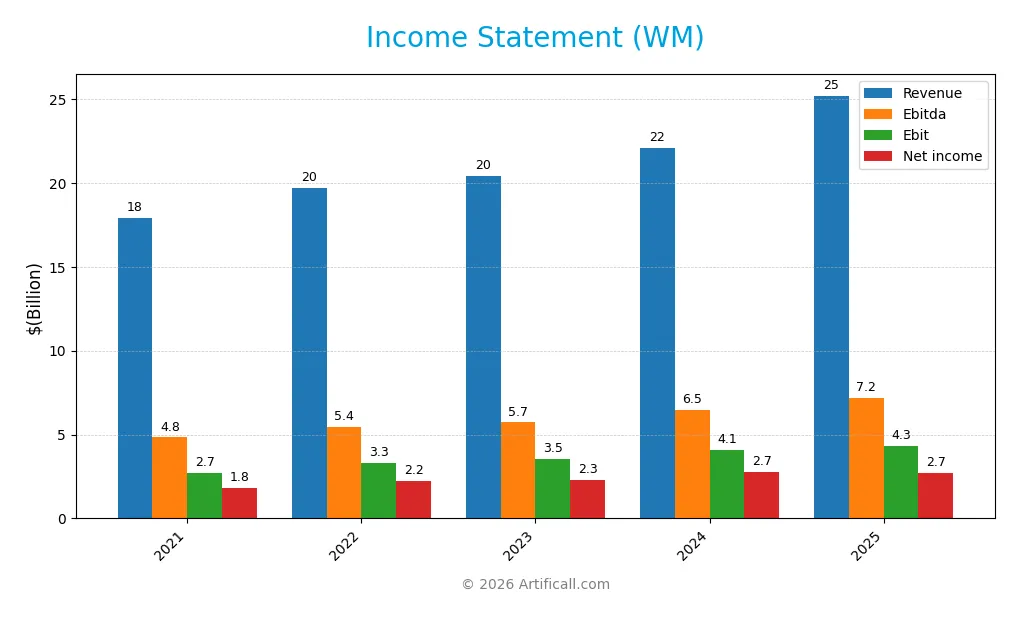
The table below summarizes Waste Management, Inc.’s key income statement figures from 2021 through 2025, highlighting revenue trends, profitability, and earnings per share evolution.
| 2021 | 2022 | 2023 | 2024 | 2025 | |
|---|---|---|---|---|---|
| Revenue | 17.9B | 19.7B | 20.4B | 22.1B | 25.2B |
| Cost of Revenue | 13.1B | 14.3B | 14.7B | 15.7B | 17.9B |
| Operating Expenses | 1.8B | 1.9B | 1.9B | 2.3B | 2.7B |
| Gross Profit | 4.8B | 5.4B | 5.7B | 6.4B | 7.3B |
| EBITDA | 4.8B | 5.4B | 5.7B | 6.5B | 7.2B |
| EBIT | 2.7B | 3.3B | 3.5B | 4.1B | 4.3B |
| Interest Expense | 365M | 378M | 500M | 598M | 912M |
| Net Income | 1.8B | 2.2B | 2.3B | 2.7B | 2.7B |
| EPS | 4.32 | 5.42 | 5.69 | 6.84 | 6.72 |
| Filing Date | 2022-02-15 | 2023-02-07 | 2024-02-13 | 2025-02-19 | 2026-02-09 |
Income Statement Evolution
Over 2021–2025, Waste Management’s revenue grew 41% to 25.2B, with net income rising 49% to 2.7B. Gross margin improved to 29.1%, while EBIT margin reached 17.2%. Despite operating expenses rising in line with revenue, net margin expanded modestly by 6%, reflecting solid margin management in a capital-intensive sector.
Is the Income Statement Favorable?
In 2025, fundamentals remain generally favorable. Revenue surged 14.2%, gross profit followed suit, but operating expenses grew proportionally, pressuring margin expansion. EBIT increased 7%, while net income and EPS declined slightly, signaling higher interest costs and tax impacts. Overall, the firm sustains healthy profitability with manageable leverage, though margin pressures warrant monitoring.
Financial Ratios
The table below presents key financial ratios for Waste Management, Inc. over recent fiscal years, offering a snapshot of profitability, liquidity, leverage, and valuation metrics:
| Ratios | 2021 | 2022 | 2023 | 2024 | 2025 |
|---|---|---|---|---|---|
| Net Margin | 10.1% | 11.4% | 11.3% | 12.4% | 10.7% |
| ROE | 25.5% | 32.7% | 33.4% | 33.3% | 27.1% |
| ROIC | 9.0% | 9.6% | 10.0% | 8.3% | 8.9% |
| P/E | 38.6 | 28.9 | 31.5 | 29.5 | 32.7 |
| P/B | 9.8 | 9.5 | 10.5 | 9.8 | 8.9 |
| Current Ratio | 0.75 | 0.81 | 0.90 | 0.76 | 0.89 |
| Quick Ratio | 0.72 | 0.77 | 0.86 | 0.73 | 0.89 |
| D/E | 1.88 | 2.19 | 2.35 | 2.90 | 2.29 |
| Debt-to-Assets | 46.1% | 47.8% | 49.4% | 53.6% | 49.9% |
| Interest Coverage | 8.2x | 9.1x | 7.6x | 6.9x | 5.1x |
| Asset Turnover | 0.62 | 0.63 | 0.62 | 0.50 | 0.55 |
| Fixed Asset Turnover | 1.24 | 1.25 | 1.20 | 1.14 | 1.24 |
| Dividend Yield | 1.38% | 1.66% | 1.57% | 1.49% | 1.51% |
Evolution of Financial Ratios
From 2021 to 2025, Waste Management’s Return on Equity (ROE) improved steadily, reaching 27.11% in 2025, signaling enhanced profitability. The Current Ratio fluctuated below 1, indicating persistent liquidity constraints. Meanwhile, the Debt-to-Equity Ratio increased to 2.29 in 2025, reflecting rising leverage and potential financial risk.
Are the Financial Ratios Favorable?
In 2025, profitability ratios like net margin (10.74%) and ROE (27.11%) are favorable, showing strong earnings efficiency. Liquidity ratios are mixed; the Current Ratio at 0.89 is unfavorable, while the Quick Ratio is neutral. Leverage remains high with a Debt-to-Equity of 2.29, marked unfavorable. Market multiples such as P/E (32.67) and P/B (8.86) also appear stretched, contributing to a slightly unfavorable overall ratio profile.
Shareholder Return Policy
Waste Management, Inc. maintains a consistent dividend policy with a payout ratio near 49%, yielding about 1.5% annually. Dividend per share has steadily increased from $2.31 in 2021 to $3.31 in 2025, supported by free cash flow coverage above 46%. The company also engages in share buybacks, complementing its dividend distribution.
This balanced approach aligns with sustainable value creation, as dividends and buybacks are covered by operating cash flow and capital expenditures. However, the payout ratio near 50% requires monitoring to avoid pressure on cash flow during economic downturns or capital needs. Overall, the policy supports long-term shareholder returns cautiously.
Score analysis
The following radar chart displays key financial scores evaluating Waste Management, Inc.’s performance across multiple metrics:
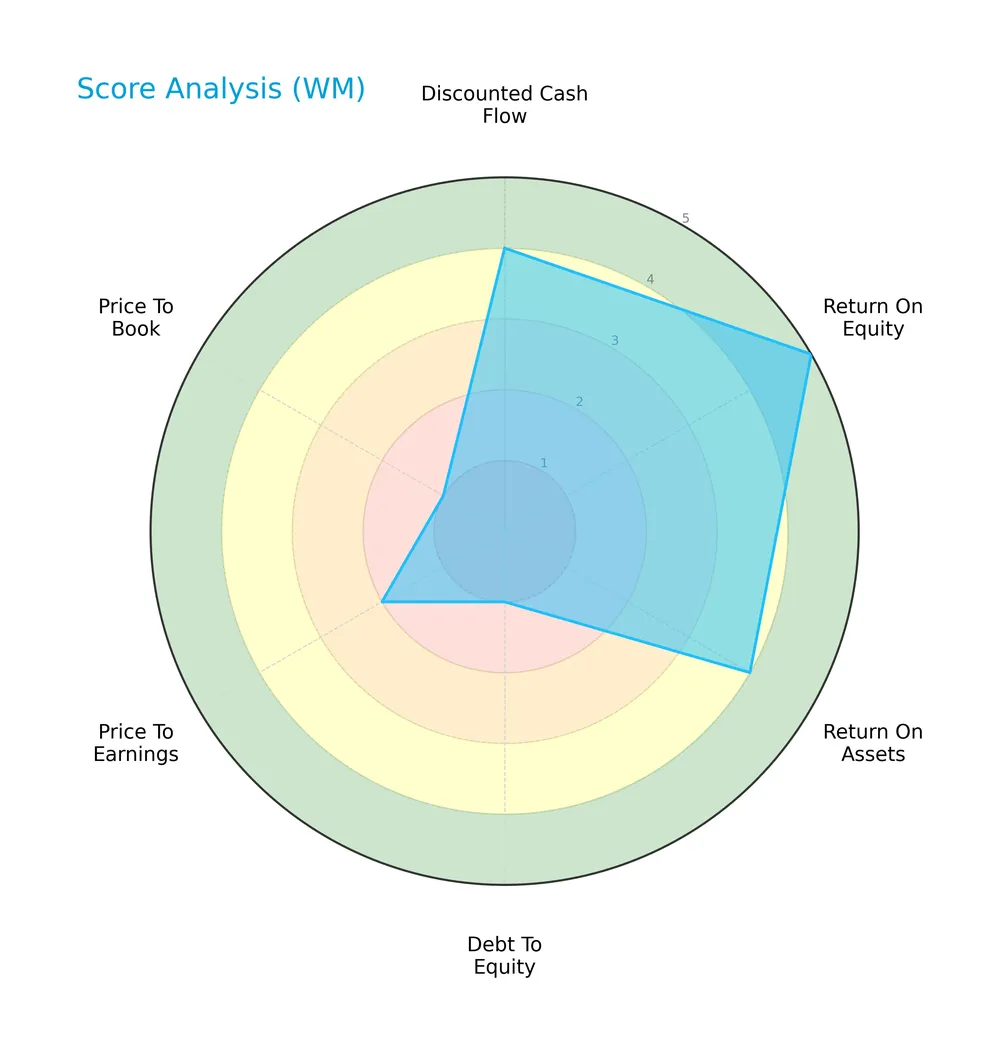
Waste Management shows strong returns with top marks in ROE (5) and solid ROA (4). Its discounted cash flow also scores favorably (4). However, leverage and valuation metrics lag significantly, with debt-to-equity (1), P/E (2), and P/B (1) all rated very unfavorable or unfavorable.
Analysis of the company’s bankruptcy risk
Waste Management’s Altman Z-Score places it in the grey zone, indicating moderate bankruptcy risk and some financial uncertainty:

Is the company in good financial health?
Here is the Piotroski Score diagram highlighting Waste Management’s financial strength:

With a Piotroski Score of 7, Waste Management demonstrates strong financial health. This score reflects sound profitability, leverage management, and efficiency, signaling robust fundamentals despite some valuation concerns.
Competitive Landscape & Sector Positioning
This section examines Waste Management, Inc.’s sector dynamics and strategic positioning within waste management. I will assess revenue streams, key products, competitors, and overall market stance. The goal is to determine whether Waste Management holds a sustainable competitive advantage over its peers.
Strategic Positioning
Waste Management, Inc. concentrates its operations primarily in the U.S., generating over $21B in 2024 versus $852M in Canada. Its diversified product portfolio spans commercial, residential, industrial waste, landfill management, recycling, and renewable energy, reflecting a broad environmental services footprint.
Revenue by Segment
This pie chart illustrates Waste Management, Inc.’s revenue distribution by business segment for the fiscal year 2024, highlighting the relative scale of each segment’s contribution.
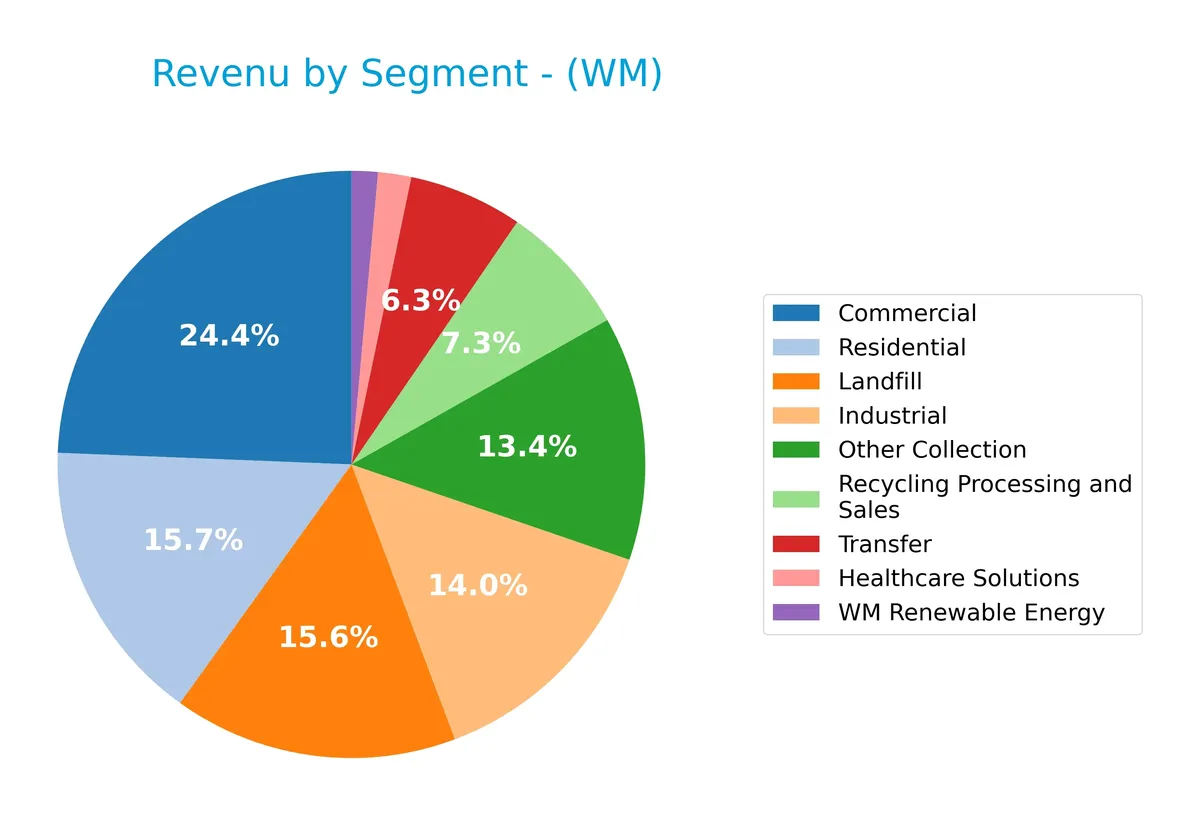
In 2024, Commercial leads with $5.37B, followed by Residential at $3.47B and Landfill at $3.45B. Industrial and Other Collection also play significant roles with $3.09B and $2.96B, respectively. Notably, WM Renewable Energy shows a smaller but growing $318M, reflecting diversification. The revenue mix indicates steady concentration in core collection and landfill services, with modest growth in renewable and recycling segments signaling strategic expansion.
Key Products & Brands
Waste Management, Inc. operates diverse waste and recycling services, segmented by distinct product lines and brand categories:
| Product | Description |
|---|---|
| Commercial | Waste collection and disposal services tailored for commercial clients across North America. |
| Industrial | Specialized waste management solutions for industrial sectors, including hazardous waste. |
| Residential | Waste collection and recycling services for residential customers. |
| Landfill | Operation and management of solid waste and secure hazardous waste landfills. |
| Transfer | Facilities and services for transferring waste from collection vehicles to disposal or processing sites. |
| Recycling Processing and Sales | Materials recovery, processing, and resale of recyclable commodities. |
| Other Collection | Additional collection services not classified under primary segments. |
| WM Renewable Energy | Landfill gas-to-energy projects converting landfill emissions into renewable energy. |
| Healthcare Solutions | Waste management services specifically designed for healthcare providers. |
Waste Management’s product portfolio spans comprehensive waste collection, landfill operations, and recycling with growing emphasis on renewable energy and healthcare-specific solutions. This diversification supports resilience amid evolving environmental regulations and customer needs.
Main Competitors
There are 2 competitors in total within the Industrials sector’s Waste Management industry. The table lists the top 2 leaders by market capitalization:
| Competitor | Market Cap. |
|---|---|
| Waste Management, Inc. | 88B |
| Republic Services, Inc. | 66B |
Waste Management, Inc. ranks 1st among its competitors, with a market cap 5.54% larger than the next player. It stands above both the average market cap of the top 10 competitors (77B) and the sector median (77B). The company holds a significant 41.24% lead over Republic Services, its closest rival below.
Comparisons with competitors
Check out how we compare the company to its competitors:
Does WM have a competitive advantage?
Waste Management, Inc. exhibits a slight competitive advantage, creating value with ROIC exceeding WACC by 3%, indicating efficient use of capital despite a declining profitability trend. The company operates a large network of landfills, MRFs, and transfer stations, supporting its market leadership in North America’s waste management sector.
Looking ahead, WM’s extensive footprint and expertise position it well to capitalize on opportunities in landfill gas-to-energy and recycling brokerage services, potentially expanding its environmental solutions and enhancing revenue streams in evolving markets.
SWOT Analysis
This SWOT analysis highlights Waste Management, Inc.’s key internal and external factors shaping its strategic position.
Strengths
- strong market position in North America
- diversified service portfolio including landfill gas-to-energy
- favorable revenue and profit growth over five years
Weaknesses
- declining ROIC trend despite value creation
- high debt-to-equity ratio of 2.29
- unfavorable valuation metrics (PE 32.7, PB 8.9)
Opportunities
- expanding environmental services demand
- growth potential in recycling brokerage
- technology adoption in waste processing
Threats
- regulatory pressures on waste management
- commodity price volatility affecting recycling margins
- competition from emerging green alternatives
Waste Management’s solid market foothold and growth track record underpin its value creation. However, rising leverage and stretched valuation pose risks. The company must focus on innovation and sustainability to mitigate regulatory and competitive threats.
Stock Price Action Analysis
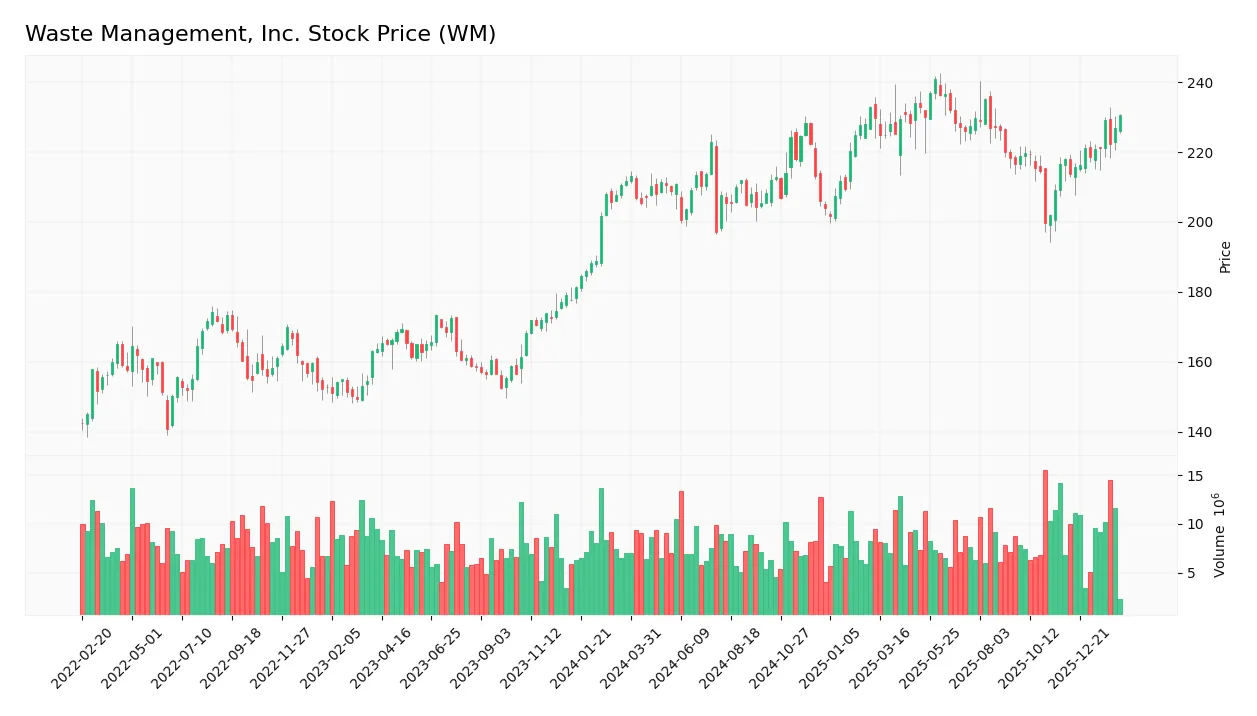
The weekly stock chart of Waste Management, Inc. illustrates the price movement and volatility over the last 12 months:
Trend Analysis
Over the past 12 months, WM’s stock price rose 8.84%, indicating a bullish trend with acceleration. The price ranged between 197 and 241, showing notable volatility with a 10.2 standard deviation. Recent months confirm continued upward momentum with a 5.8% gain and moderate volatility at 5.13.
Volume Analysis
In the last three months, trading volume increased with strong buyer dominance at 72%. Buyers accounted for 75M shares versus 29M sellers, signaling heightened investor confidence and active market participation. The volume trend supports ongoing upward price pressure.
Target Prices
Analysts present a solid target consensus for Waste Management, Inc. reflecting confidence in its growth prospects.
| Target Low | Target High | Consensus |
|---|---|---|
| 238 | 264 | 253.75 |
The target range between $238 and $264 indicates moderate upside potential, with a consensus of $253.75 suggesting steady investor confidence.

Don’t Let Luck Decide Your Entry Point
Optimize your entry points with our advanced ProRealTime indicators. You’ll get efficient buy signals with precise price targets for maximum performance. Start outperforming now!
Analyst & Consumer Opinions
This section reviews analyst grades and consumer feedback to provide a balanced view of Waste Management, Inc.’s market perception.
Stock Grades
Here is the latest comprehensive grading summary from established financial institutions for Waste Management, Inc.:
| Grading Company | Action | New Grade | Date |
|---|---|---|---|
| Wells Fargo | Maintain | Overweight | 2026-01-30 |
| Oppenheimer | Maintain | Outperform | 2026-01-30 |
| RBC Capital | Maintain | Sector Perform | 2026-01-30 |
| TD Cowen | Maintain | Buy | 2026-01-30 |
| Stifel | Maintain | Buy | 2026-01-30 |
| Wells Fargo | Maintain | Overweight | 2026-01-23 |
| Scotiabank | Downgrade | Sector Perform | 2026-01-21 |
| Barclays | Maintain | Overweight | 2026-01-20 |
| Citigroup | Maintain | Buy | 2026-01-16 |
| UBS | Upgrade | Buy | 2026-01-09 |
The overall trend shows consistent confidence with multiple buy and overweight ratings maintained across major firms. Notably, a single downgrade from Scotiabank to sector perform contrasts with several upgrades and stable positive outlooks.
Consumer Opinions
Consumers express mixed but generally favorable views about Waste Management, Inc., reflecting its strong operational presence and areas needing improvement.
| Positive Reviews | Negative Reviews |
|---|---|
| Reliable service with timely pickups | Customer service can be slow to respond |
| Wide coverage and convenient scheduling | Pricing sometimes feels expensive |
| Environmentally responsible initiatives | Occasional billing errors reported |
Overall, consumers praise Waste Management for dependable service and eco-friendly efforts. However, recurring complaints about customer support and billing suggest areas for management focus.
Risk Analysis
Below is a summary table of key risks facing Waste Management, Inc., including their likelihood and potential impact:
| Category | Description | Probability | Impact |
|---|---|---|---|
| Financial Leverage | High debt-to-equity ratio (2.29) increases financial risk. | Medium | High |
| Liquidity | Current ratio below 1 (0.89) signals potential short-term stress. | Medium | Medium |
| Valuation | Elevated P/E (32.67) and P/B (8.86) ratios suggest overvaluation. | High | Medium |
| Market Volatility | Beta of 0.586 indicates moderate sensitivity to market swings. | Low | Low |
| Regulatory | Environmental regulations could increase operating costs. | Medium | High |
| Operational | Dependence on landfill operations exposes to environmental risks. | Medium | Medium |
The most pressing risks are valuation excess and financial leverage. WM trades at a premium compared to industry norms, which may limit upside. Its debt load is significant, reflected in a grey-zone Altman Z-Score of 2.93, signaling moderate bankruptcy risk. Recent regulatory tightening on waste disposal and emissions adds cost pressure. Investors should weigh these risks despite WM’s strong ROE and stable dividend.
Should You Buy Waste Management, Inc.?
Waste Management appears to be delivering robust value creation supported by a slightly favorable moat despite a declining ROIC trend. However, its leverage profile is substantial, which tempers enthusiasm. The overall rating suggests a solid B-grade profile with moderate financial strength.
Strength & Efficiency Pillars
Waste Management, Inc. delivers solid operational efficiency with a net margin of 10.74% and a return on equity of 27.11%, signaling competent profit generation. Its return on invested capital (8.88%) surpasses the weighted average cost of capital (5.84%), confirming it as a value creator. Despite a slightly declining ROIC trend, the company maintains favorable EBIT and gross margins, reinforcing its capacity to generate value above capital costs in a competitive sector.
Weaknesses and Drawbacks
The company resides in the Altman Z-Score grey zone with a score of 2.93, indicating moderate bankruptcy risk and a need for caution. Valuation metrics raise concerns: a high P/E of 32.67 and P/B of 8.86 suggest a premium price that may not reflect underlying risks. Leverage is elevated with a debt-to-equity ratio of 2.29, and liquidity is tight, evidenced by a current ratio of 0.89. These factors could pressure financial flexibility amid market volatility.
Our Final Verdict about Waste Management, Inc.
Waste Management, Inc. presents a fundamentally sound profile with efficient profitability and value creation. The bullish overall trend and strong buyer dominance (71.78%) in the recent period bolster the positive outlook. However, the moderate solvency risk and stretched valuation metrics suggest that investors might consider a cautious, wait-and-see approach for a more favorable entry point.
Disclaimer: This content is for informational purposes only and does not constitute financial, investment, or other professional advice. Investing in financial markets involves a significant risk of loss, and past performance is not indicative of future results.
Additional Resources
- Waste Management, Inc. (WM): A Bull Case Theory – Yahoo Finance (Feb 07, 2026)
- A Look Into Waste Management Inc’s Price Over Earnings – Benzinga (Feb 09, 2026)
- Candriam S.C.A. Sells 69,263 Shares of Waste Management, Inc. $WM – MarketBeat (Feb 09, 2026)
- Not wasted: WM Phoenix Open embraces innovation with sustainability – The Gila Herald (Feb 09, 2026)
- Waste Management (NYSE: WM) Stock Price Prediction and Forecast 2026-2030 (Feb 2026) – 24/7 Wall St. (Feb 05, 2026)
For more information about Waste Management, Inc., please visit the official website: wm.com