Home > Analyses > Consumer Defensive > Walmart Inc.
Walmart Inc. redefines everyday shopping for millions worldwide, blending sprawling physical stores with robust e-commerce platforms. As a titan in discount retail, it commands market leadership through its supercenters, Sam’s Club memberships, and innovative digital payment solutions. Renowned for operational efficiency and private-label strength, Walmart shapes consumer habits and supply chains alike. The critical question now is whether its solid fundamentals justify continued growth amid evolving retail dynamics and competitive pressures.

Table of contents
Business Model & Company Overview
Walmart Inc., founded in 1945 and headquartered in Bentonville, Arkansas, dominates the discount retail sector with a vast ecosystem of supercenters, warehouse clubs, and eCommerce platforms. Its integrated offering spans groceries, apparel, electronics, and financial services, creating a seamless consumer experience underpinned by brands like Walmart Neighborhood Market and Sam’s Club. This scale and diversity cement its role as a cornerstone of global retail.
The company drives revenue through a balanced mix of physical stores and robust digital platforms across the Americas, Europe, and Asia. It monetizes recurring consumer demand in groceries and consumables, while expanding its footprint in health, wellness, and financial services. Walmart’s economic moat lies in its unmatched distribution network and brand loyalty, shaping the future of retail worldwide.
Financial Performance & Fundamental Metrics
I analyze Walmart Inc.’s income statement, key financial ratios, and dividend payout policy to reveal its operational efficiency and shareholder value creation.
Income Statement
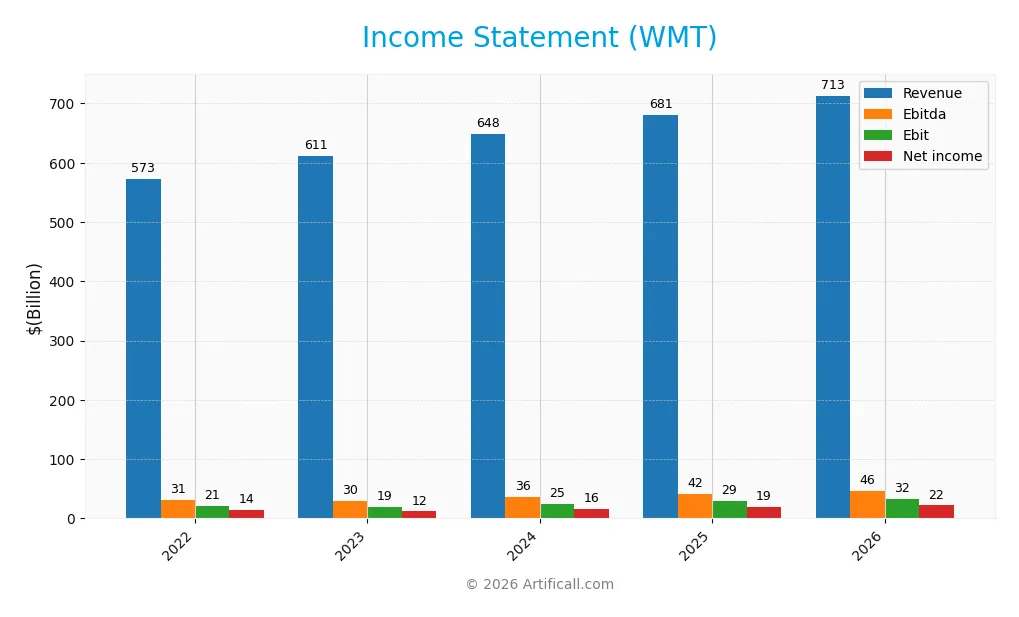
This table summarizes Walmart Inc.’s key income statement figures for fiscal years 2022 through 2026, providing a clear view of its financial performance.
| 2022 | 2023 | 2024 | 2025 | 2026 | |
|---|---|---|---|---|---|
| Revenue | 573B | 611B | 648B | 681B | 713B |
| Cost of Revenue | 429B | 464B | 490B | 512B | 535B |
| Operating Expenses | 118B | 127B | 131B | 140B | 148B |
| Gross Profit | 144B | 148B | 158B | 169B | 178B |
| EBITDA | 31B | 30B | 36B | 42B | 46B |
| EBIT | 21B | 19B | 25B | 29B | 32B |
| Interest Expense | 2.0B | 2.1B | 2.7B | 2.7B | 2.8B |
| Net Income | 13.7B | 11.7B | 15.5B | 19.4B | 21.9B |
| EPS | 1.63 | 1.43 | 1.92 | 2.42 | 2.74 |
| Filing Date | 2022-02-17 | 2023-02-21 | 2024-03-15 | 2025-03-14 | 2026-03-13 |
Income Statement Evolution
From 2022 to 2026, Walmart’s revenue rose 24.5%, signaling steady expansion. Net income surged 60.1%, outpacing revenue growth significantly. Gross and net margins improved by 5.0% and 28.6% respectively, reflecting enhanced profitability. EBIT margin remained stable, indicating consistent operational efficiency despite rising operating expenses.
Is the Income Statement Favorable?
In 2026, Walmart reported $713B revenue and $21.9B net income, with a 3.1% net margin and 4.5% EBIT margin. EPS grew 13.3% year-over-year to $2.74, driven by a favorable 11.1% EBIT increase. Interest expense is low at 0.39% of revenue, supporting financial health. Overall, fundamentals appear strong with positive margin and earnings growth.
Financial Ratios
Presented below are Walmart Inc.’s key financial ratios from 2022 to 2026, offering a concise performance snapshot over this five-year period:
| Ratios | 2022 | 2023 | 2024 | 2025 | 2026 |
|---|---|---|---|---|---|
| Net Margin | 2.39% | 1.91% | 2.39% | 2.85% | 3.07% |
| ROE | 16.42% | 15.23% | 18.50% | 21.36% | 21.98% |
| ROIC | 11.89% | 8.60% | 12.08% | 13.06% | 11.87% |
| P/E | 28.55 | 33.56 | 28.68 | 40.61 | 43.44 |
| P/B | 4.69 | 5.11 | 5.30 | 8.67 | 9.55 |
| Current Ratio | 0.93 | 0.82 | 0.83 | 0.82 | 0.79 |
| Quick Ratio | 0.28 | 0.21 | 0.24 | 0.24 | 0.24 |
| D/E | 0.69 | 0.77 | 0.73 | 0.66 | 0.67 |
| Debt-to-Assets | 23.4% | 24.2% | 24.3% | 23.0% | 23.6% |
| Interest Coverage | 13.01 | 9.60 | 10.07 | 10.76 | 10.66 |
| Asset Turnover | 2.34 | 2.51 | 2.57 | 2.61 | 2.51 |
| Fixed Asset Turnover | 5.09 | 5.13 | 4.97 | 4.87 | 4.54 |
| Dividend Yield | 1.58% | 1.56% | 1.38% | 0.85% | 0.79% |
Evolution of Financial Ratios
Walmart’s Return on Equity (ROE) steadily improved from 15.2% in 2023 to 22.0% in 2026, indicating enhanced profitability. The Current Ratio declined consistently, falling below 1.0, signaling tighter liquidity. The Debt-to-Equity Ratio remained relatively stable around 0.67, reflecting a consistent leverage position over the period.
Are the Financial Ratios Fovorable?
In 2026, Walmart’s profitability ratios like ROE (22.0%) and ROIC (11.9%) stand favorable against its 6.9% WACC, showing effective capital use. Liquidity ratios such as Current (0.79) and Quick (0.24) ratios remain unfavorable, indicating potential short-term liquidity risks. Leverage is neutral with a Debt-to-Equity of 0.67. Market valuation ratios, including a PE of 43.4 and PB of 9.55, are unfavorable, suggesting high valuation levels. Overall, half the key ratios suggest a slightly favorable financial profile.
Shareholder Return Policy
Walmart maintains a consistent dividend payout ratio near 34%, with dividend per share rising steadily to $0.94 in 2026. The annual dividend yield stands at 0.79%, supported by free cash flow coverage, while the company also conducts share buybacks.
This balanced approach aligns with sustainable long-term value creation by preserving cash flow adequacy and avoiding excessive distributions. The policy reflects prudent capital allocation amid moderate profitability and leverage levels.
Score analysis
The following radar chart illustrates Walmart Inc.’s financial performance across key valuation and profitability metrics:
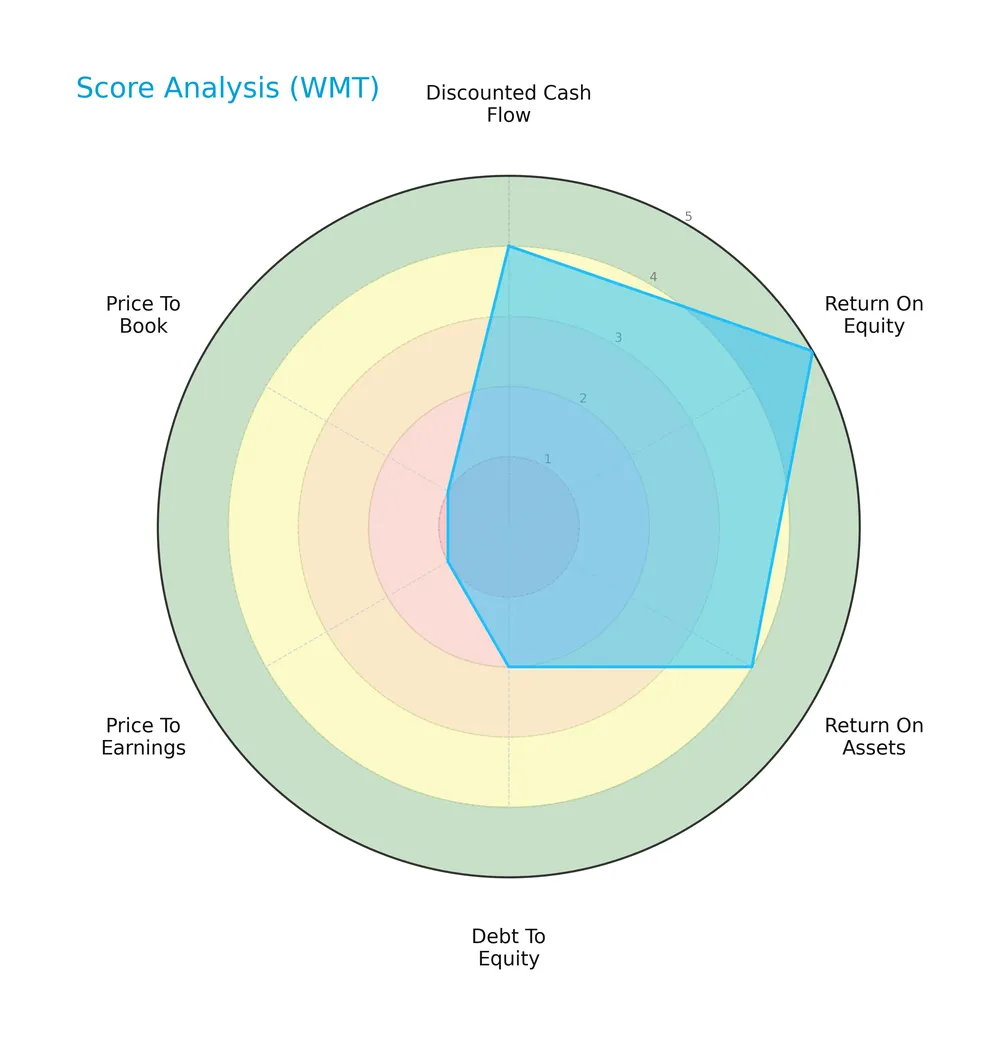
Walmart scores very favorably on return on equity and favorably on discounted cash flow and return on assets. However, its debt-to-equity ratio is unfavorable, and valuation metrics price-to-earnings and price-to-book scores are very unfavorable.
Analysis of the company’s bankruptcy risk
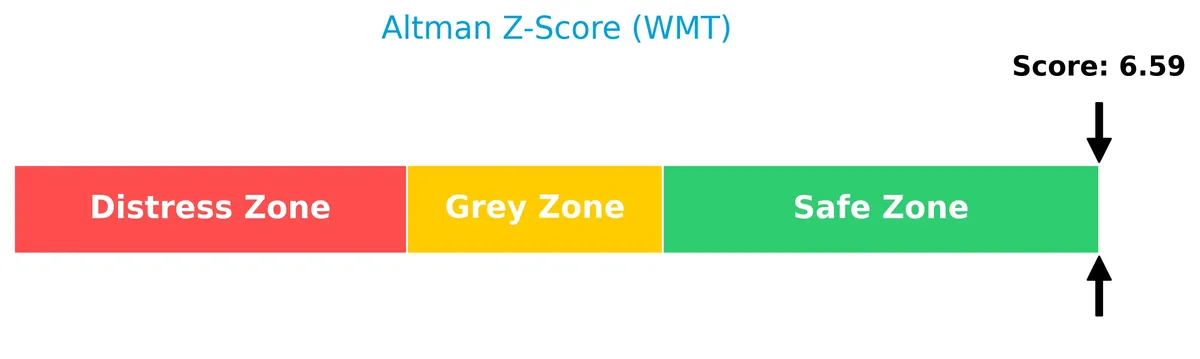
Walmart’s Altman Z-Score places it well within the safe zone, indicating a very low risk of bankruptcy:
Is the company in good financial health?
The Piotroski Score diagram below provides insight into Walmart’s financial strength based on profitability, leverage, and efficiency:

With a Piotroski Score of 6, Walmart is in an average financial health range. This suggests moderate financial strength but room for improvement compared to top-tier value investments.
Competitive Landscape & Sector Positioning
This sector analysis explores Walmart Inc.’s strategic positioning, revenue segments, key products, and main competitors. I will assess whether Walmart holds a competitive advantage over its peers in the discount stores industry.
Strategic Positioning
Walmart maintains a diversified product portfolio across retail, wholesale, eCommerce, and financial services. Geographically, it concentrates revenue in the U.S. with $581B in 2026, while international operations contribute $132B, reflecting a strong domestic focus complemented by global reach.
Revenue by Segment
This pie chart displays Walmart Inc.’s revenue distribution by segment for the fiscal year 2026, highlighting the contributions of Walmart U.S., Walmart International, and Sam’s Club.
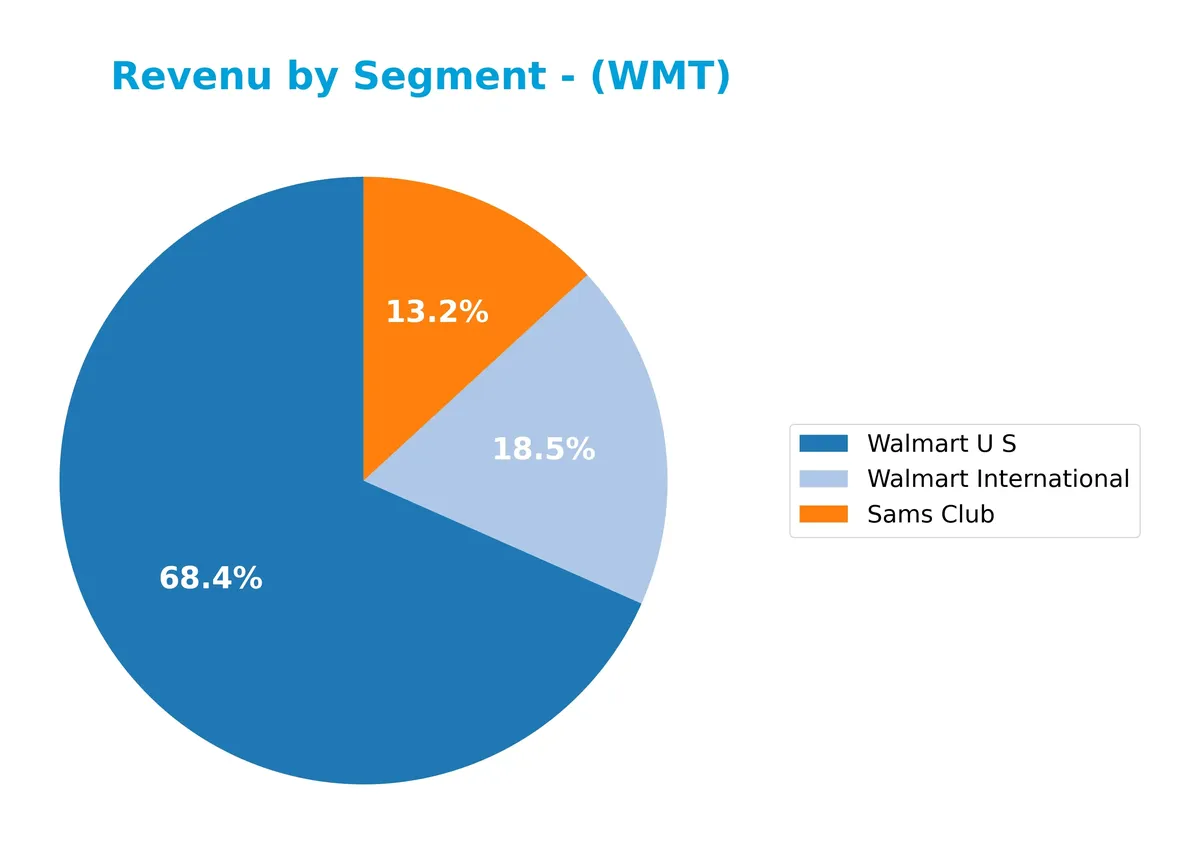
Walmart U.S. dominates with $483B, showing steady growth and reinforcing its core market strength. Walmart International follows at $130B, reflecting consistent expansion outside the U.S. Sam’s Club contributes $93B, marking a solid increase and diversifying revenue streams. The 2026 data reveals accelerating growth across all segments, reducing concentration risk and showcasing balanced operational momentum.
Key Products & Brands
Walmart’s key products and brands span retail formats, private labels, and digital services worldwide:
| Product | Description |
|---|---|
| Walmart U.S. | Operates supercenters, supermarkets, discount stores, and Walmart Neighborhood Market offering groceries and goods. |
| Walmart International | Runs retail and eCommerce operations across multiple countries, including sites like walmart.ca and flipkart.com. |
| Sam’s Club | Membership-only warehouse clubs selling bulk groceries, consumables, and general merchandise. |
| Private Brands | Markets merchandise under Allswell, Athletic Works, Equate, and Free Assembly brands. |
| Digital Commerce | Includes ecommerce websites, mobile apps, and digital payment platforms. |
| Health & Wellness | Offers pharmacy, optical, hearing services, and over-the-counter medical products. |
| Home & Apparel | Provides home improvement, furniture, apparel, tools, and seasonal items. |
| Consumer Electronics | Sells electronics, software, video games, office supplies, and appliances. |
| Financial Services | Includes money transfers, bill payments, prepaid cards, co-branded credit cards, and installment lending. |
Walmart’s diverse product portfolio combines large-scale retail formats, private labels, and expanding digital services. Its global footprint supports steady revenue growth across Walmart U.S., Walmart International, and Sam’s Club segments.
Main Competitors
There are 6 main competitors in the Discount Stores industry. Below is the list of the top 10 leaders by market capitalization:
| Competitor | Market Cap. |
|---|---|
| Walmart Inc. | 899B |
| Costco Wholesale Corporation | 379B |
| Target Corporation | 46B |
| Dollar General Corporation | 30B |
| Dollar Tree, Inc. | 27B |
| BJ’s Wholesale Club Holdings, Inc. | 12B |
Walmart ranks 1st among its six competitors, with a market cap 9% above the second-largest player. It stands well above both the average market cap of the top 10 competitors (232B) and the sector median (38B). The distance to the next competitor below is a significant -158%, highlighting Walmart’s dominant scale.
Comparisons with competitors
Check out how we compare the company to its competitors:
Does Walmart have a competitive advantage?
Walmart shows a competitive advantage with a ROIC exceeding its WACC by nearly 5%, indicating value creation despite a slight decline in profitability. Its scale and diversified retail formats support steady revenue and margin growth.
The company’s future outlook includes expanding its eCommerce platforms and international operations, leveraging its private brands and digital payment services to capture new markets and consumer segments.
SWOT Analysis
This analysis highlights Walmart Inc.’s key internal and external factors impacting its competitive position and growth prospects.
Strengths
- Massive scale with $980B market cap
- Strong ROE at 22% and ROIC above WACC
- Diversified revenue streams including eCommerce and financial services
Weaknesses
- Low current and quick ratios signal liquidity concerns
- High P/E and P/B ratios suggest expensive valuation
- Declining ROIC trend warns of profitability pressure
Opportunities
- Expansion in international markets with $132B revenue
- Growth in digital payments and fintech services
- Increasing demand for health and wellness products
Threats
- Intense competition from Amazon and other retailers
- Economic downturns affecting consumer spending
- Supply chain disruptions raising costs
Walmart’s scale and robust returns form a solid foundation, but liquidity and valuation risks require caution. Strategic focus on international growth and digital innovation can drive future value. Vigilance on competitive and macroeconomic threats remains critical.
Stock Price Action Analysis
The weekly stock chart for Walmart Inc. illustrates significant price movement and key support and resistance levels over the past 12 months:
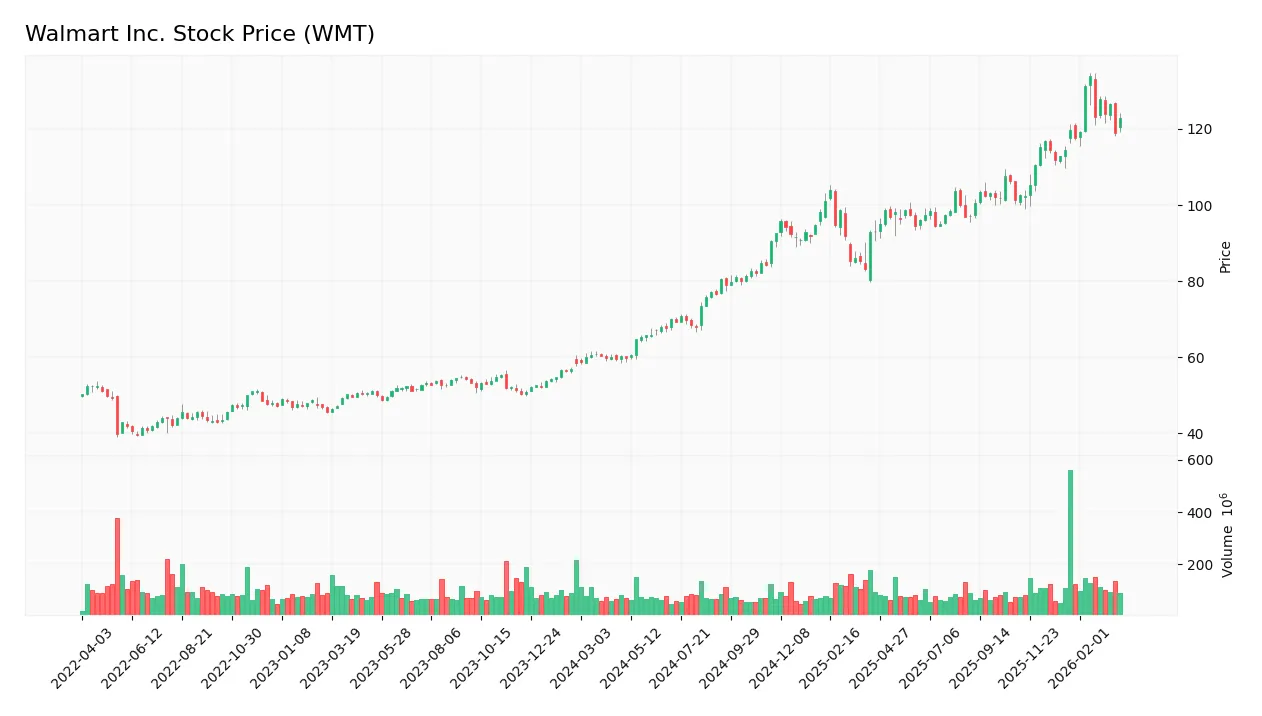
Trend Analysis
Over the past 12 months, Walmart’s stock price rose 105.43%, signaling a strong bullish trend. The highest price hit 133.89, with a low of 59.82. Despite the uptrend, momentum shows deceleration. Price volatility remains elevated, with a 17.07 standard deviation, reflecting sizable fluctuations.
Volume Analysis
Trading volume over the last three months shows a strongly buyer-dominant pattern, with buyers accounting for 72.27% of activity. Volume is increasing, indicating growing market participation and robust investor confidence during this period. Sellers appear less active, suggesting bullish sentiment.
Target Prices
Analysts set a clear price range reflecting moderate optimism for Walmart Inc.
| Target Low | Target High | Consensus |
|---|---|---|
| 120 | 150 | 137.04 |
The consensus target price of $137 suggests steady appreciation potential, with a balanced view between conservative and bullish estimates.

Don’t Let Luck Decide Your Entry Point
Optimize your entry points with our advanced ProRealTime indicators. You’ll get efficient buy signals with precise price targets for maximum performance. Start outperforming now!
Analyst & Consumer Opinions
This section examines Walmart Inc.’s recent analyst ratings and consumer feedback to assess market sentiment and brand perception.
Stock Grades
Here are the latest verified stock grades for Walmart Inc. from recognized financial firms:
| Grading Company | Action | New Grade | Date |
|---|---|---|---|
| Tigress Financial | Maintain | Buy | 2026-02-25 |
| Evercore ISI Group | Maintain | Outperform | 2026-02-23 |
| HSBC | Downgrade | Hold | 2026-02-20 |
| TD Cowen | Maintain | Buy | 2026-02-20 |
| Truist Securities | Maintain | Buy | 2026-02-20 |
| DA Davidson | Maintain | Buy | 2026-02-20 |
| BTIG | Maintain | Buy | 2026-02-20 |
| UBS | Maintain | Buy | 2026-02-20 |
| Telsey Advisory Group | Maintain | Outperform | 2026-02-20 |
| Bernstein | Maintain | Outperform | 2026-02-20 |
The overall trend shows a strong consensus favoring buy or outperform ratings, with only one notable downgrade to hold by HSBC. The market sentiment remains broadly positive, supported by multiple buy-grade affirmations.
Consumer Opinions
Walmart Inc. continues to evoke strong opinions from its diverse customer base, reflecting its broad market reach and evolving service model.
| Positive Reviews | Negative Reviews |
|---|---|
| Wide product selection meets all my needs | Long checkout lines cause frustration |
| Competitive prices save me money regularly | Some stores suffer from poor cleanliness |
| Convenient online shopping experience | Staff can be unhelpful during busy hours |
Overall, consumers praise Walmart’s pricing and product variety, crucial in retail. However, operational issues like store cleanliness and customer service remain persistent challenges. These factors could impact repeat business if not addressed promptly.
Risk Analysis
The table below summarizes Walmart’s key risks, highlighting their likelihood and potential impact on performance:
| Category | Description | Probability | Impact |
|---|---|---|---|
| Valuation Risk | Elevated P/E (43.44) and P/B (9.55) ratios suggest overvaluation. | High | High |
| Liquidity Risk | Current ratio (0.79) and quick ratio (0.24) below 1 indicate tight short-term liquidity. | Medium | Medium |
| Competitive Risk | Intense discount retail competition pressures margins and market share. | Medium | High |
| Debt Risk | Moderate debt/equity ratio (0.67) but favorable interest coverage (11.53) limits refinancing risk. | Low | Medium |
| Margin Pressure | Net margin at 3.07% is weak relative to peers, challenging profitability. | High | High |
| Economic Sensitivity | Consumer spending shifts due to inflation or recession could reduce sales. | Medium | Medium |
Walmart’s most pressing risks are its high valuation multiples and thin net margins, which historically in retail signal vulnerability during economic downturns. Its low liquidity ratios warrant caution despite solid long-term solvency. The robust Altman Z-Score (6.59) confirms financial stability, but investors must watch valuation and margin pressures carefully.
Should You Buy Walmart Inc.?
Walmart appears to be a robust value creator with a durable competitive moat, despite a declining ROIC trend. Its leverage profile is manageable but signals caution. The overall B rating suggests a very favorable investment quality, tempered by some valuation risks.
Strength & Efficiency Pillars
Walmart Inc. demonstrates solid operational efficiency with a return on equity of 21.98% and a return on invested capital (ROIC) of 11.87%. The company clearly creates value, as its ROIC exceeds the weighted average cost of capital (WACC) of 6.9% by nearly 5 percentage points. Gross margin stands favorable at 24.93%, supported by an interest expense ratio of just 0.39%, underscoring prudent financial management. Despite a modest net margin of 3.07%, Walmart’s asset turnover ratios remain robust, reflecting efficient use of assets.
Weaknesses and Drawbacks
Walmart faces valuation concerns with a high price-to-earnings ratio of 43.44 and price-to-book ratio of 9.55, indicating a premium market valuation that may limit upside potential. Liquidity is a red flag, as the current ratio of 0.79 and quick ratio of 0.24 suggest tight short-term financial flexibility. Although debt-to-equity at 0.67 is neutral, the weak liquidity ratios expose the company to refinancing risks amid rising interest rates, which could pressure the stock, especially given the modest dividend yield of 0.79%.
Our Final Verdict about Walmart Inc.
Walmart’s profile appears attractive for long-term exposure, supported by strong value creation and efficient asset utilization. The company’s safe Altman Z-Score of 6.59 confirms financial stability, mitigating concerns around leverage and liquidity. Despite a deceleration in stock price momentum, bullish overall trends and dominant buyer activity suggest the stock might offer value for patient investors seeking steady operational strength amid valuation cautions.
Disclaimer: This content is for informational purposes only and does not constitute financial, investment, or other professional advice. Investing in financial markets involves a significant risk of loss, and past performance is not indicative of future results.
Additional Resources
- Dakota Wealth Management Raises Holdings in Walmart Inc. $WMT – MarketBeat (Mar 28, 2026)
- Planned Walmart (NYSE: WMT) insider sale of 19,416 shares by director – Stock Titan (Mar 27, 2026)
- WMT Technical Analysis | Trend, Signals & Chart Patterns | WALMART INC (NASDAQ:WMT) – ChartMill (Mar 25, 2026)
- Walmart or Costco: Who’s Winning the Modern Retail Game Right Now? – TradingView (Mar 27, 2026)
- Walton Family Holdings Trust Sells 3,279,000 Shares of Walmart I – GuruFocus (Mar 27, 2026)
For more information about Walmart Inc., please visit the official website: corporate.walmart.com