Home > Analyses > Industrials > W.W. Grainger, Inc.
W.W. Grainger, Inc. powers countless businesses by ensuring seamless access to critical maintenance and repair supplies. As a dominant force in industrial distribution, Grainger combines an extensive product range with cutting-edge inventory management and technical services. Its reputation for reliability and innovation cements its role across multiple continents and sectors. Yet, as market dynamics shift, I question whether Grainger’s fundamentals continue to support its premium valuation and growth trajectory.

Table of contents
Business Model & Company Overview
W.W. Grainger, Inc., founded in 1927 and headquartered in Lake Forest, Illinois, commands a leading position in the Industrial – Distribution sector. The company delivers a cohesive ecosystem of maintenance, repair, and operating (MRO) products, including safety supplies, pumps, and hand tools. Its core mission centers on serving businesses, government entities, and institutions through robust sales and service channels alongside e-commerce platforms.
Grainger’s revenue engine balances physical products with value-added services like inventory management and technical support. It operates two segments: High-Touch Solutions N.A. and Endless Assortment, ensuring broad market coverage across the United States, Japan, Canada, and the United Kingdom. This global footprint supports a durable competitive advantage, securing its role as an indispensable partner shaping the future of industrial supply chains.
Financial Performance & Fundamental Metrics
I will analyze W.W. Grainger, Inc.’s income statement, key financial ratios, and dividend payout policy to assess its fundamental strength and shareholder value.
Income Statement
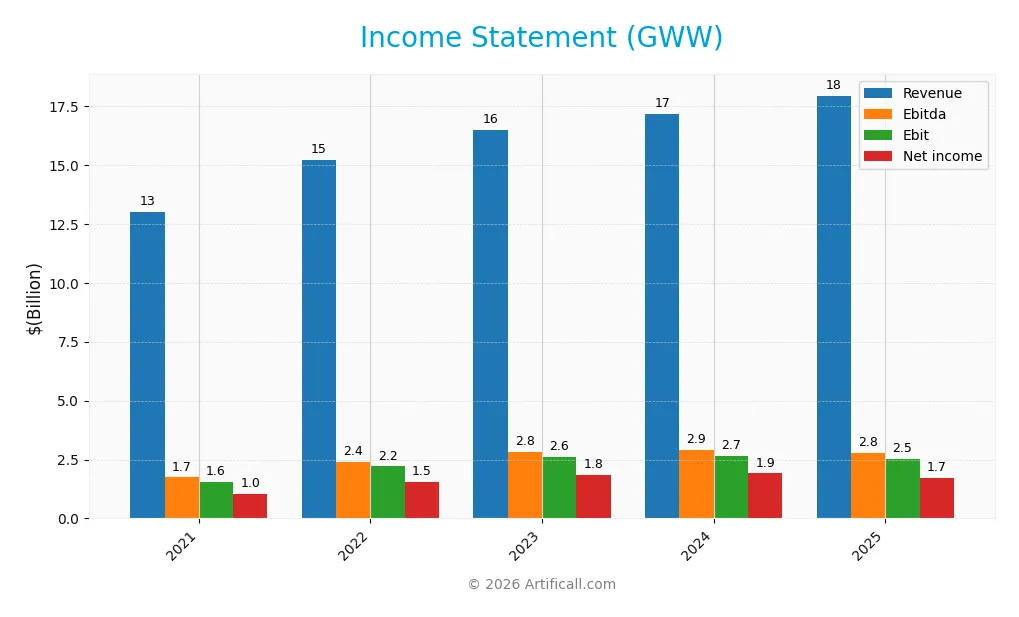
Below is W.W. Grainger, Inc.’s Income Statement for fiscal years 2021 through 2025, presented in USD and scaled for clarity.
| 2021 | 2022 | 2023 | 2024 | 2025 | |
|---|---|---|---|---|---|
| Revenue | 13.0B | 15.2B | 16.5B | 17.2B | 17.9B |
| Cost of Revenue | 8.3B | 9.4B | 10.0B | 10.5B | 10.9B |
| Operating Expenses | 3.2B | 3.6B | 3.9B | 4.1B | 4.3B |
| Gross Profit | 4.7B | 5.8B | 6.5B | 6.7B | 7.0B |
| EBITDA | 1.7B | 2.4B | 2.8B | 2.9B | 2.8B |
| EBIT | 1.6B | 2.2B | 2.6B | 2.7B | 2.5B |
| Interest Expense | 87M | 93M | 93M | 77M | 81M |
| Net Income | 1.0B | 1.5B | 1.8B | 1.9B | 1.7B |
| EPS | 20.1 | 30.4 | 36.7 | 39.0 | 35.5 |
| Filing Date | 2022-02-23 | 2023-02-21 | 2024-02-22 | 2025-02-20 | 2026-02-19 |
Income Statement Evolution
From 2021 to 2025, W.W. Grainger’s revenue grew 38% overall, reaching $17.9B in 2025. Net income expanded 64% over the period but declined 11% in the last year to $1.7B. Gross margin remained stable near 39%, while EBIT margin held favorably at 14%, despite a 5.6% EBIT contraction in the latest year.
Is the Income Statement Favorable?
The 2025 income statement shows solid fundamentals with a net margin of 9.5%, supported by low interest expense at 0.45% of revenue. However, EBIT and net margin both shrank year-over-year, signaling margin pressure. Operating expenses grew in line with revenue, which is unfavorable. Overall, the income statement leans favorable but exhibits cautious signs amid recent margin compression.
Financial Ratios
The following table summarizes key financial ratios for W.W. Grainger, Inc. over the past five fiscal years:
| Ratios | 2021 | 2022 | 2023 | 2024 | 2025 |
|---|---|---|---|---|---|
| Net Margin | 8.0% | 10.2% | 11.1% | 11.1% | 9.5% |
| ROE | 55.7% | 63.4% | 58.7% | 56.8% | 41.2% |
| ROIC | 22.6% | 29.3% | 30.4% | 28.6% | 27.7% |
| P/E | 25.8 | 18.3 | 22.6 | 27.0 | 28.3 |
| P/B | 14.4 | 11.6 | 13.3 | 15.3 | 11.7 |
| Current Ratio | 2.63 | 2.48 | 2.88 | 2.49 | 2.83 |
| Quick Ratio | 1.40 | 1.36 | 1.64 | 1.49 | 1.59 |
| D/E | 1.47 | 1.11 | 0.88 | 0.95 | 0.76 |
| Debt-to-Assets | 41.9% | 35.6% | 33.8% | 36.1% | 35.3% |
| Interest Coverage | 17.8 | 23.8 | 27.6 | 34.2 | 33.2 |
| Asset Turnover | 1.98 | 2.01 | 2.02 | 1.94 | 2.00 |
| Fixed Asset Turnover | 7.17 | 8.33 | 7.90 | 7.47 | 6.87 |
| Dividend Yield | 1.33% | 1.31% | 0.95% | 0.82% | 0.97% |
All ratios are reported in fiscal year terms. Percentages are rounded to one decimal place.
Evolution of Financial Ratios
From 2021 to 2025, W.W. Grainger’s Return on Equity (ROE) showed a general improvement, peaking near 58% before slightly declining to 41.2% in 2025. The Current Ratio steadily increased, reaching 2.83 in 2025, indicating stronger liquidity. Meanwhile, the Debt-to-Equity Ratio decreased from 1.47 to 0.76, reflecting moderate deleveraging and improved financial stability. Profitability margins were relatively stable, with net margin around 9.5% in 2025.
Are the Financial Ratios Fovorable?
In 2025, profitability metrics such as ROE (41.2%) and Return on Invested Capital (27.73%) stand as favorable, signaling efficient capital use above the WACC of 8.53%. Liquidity ratios, including the Current Ratio (2.83) and Quick Ratio (1.59), are also favorable, suggesting solid short-term financial health. Debt ratios remain neutral, with moderate leverage at 0.76 D/E. However, valuation multiples like P/E (28.33) and P/B (11.67) are unfavorable, indicating expensive market pricing relative to earnings and book value. Overall, half of the ratios are favorable, with a slightly favorable global outlook.
Shareholder Return Policy
W.W. Grainger, Inc. maintains a consistent dividend policy with a payout ratio around 22-34% over recent years and a dividend yield near 0.8-1.3%. The dividend per share has steadily increased from $6.88 in 2021 to $9.75 in 2025, supported by free cash flow coverage above 60%.
The company also engages in share buybacks, complementing its dividend distributions. This balanced approach aligns with sustainable long-term shareholder value creation, given the solid cash flow coverage and moderate payout ratio, which mitigate risks of over-distribution or excessive repurchases.
Score analysis
The radar chart below summarizes key financial scores for W.W. Grainger, Inc., highlighting strengths and weaknesses across multiple valuation and performance metrics:
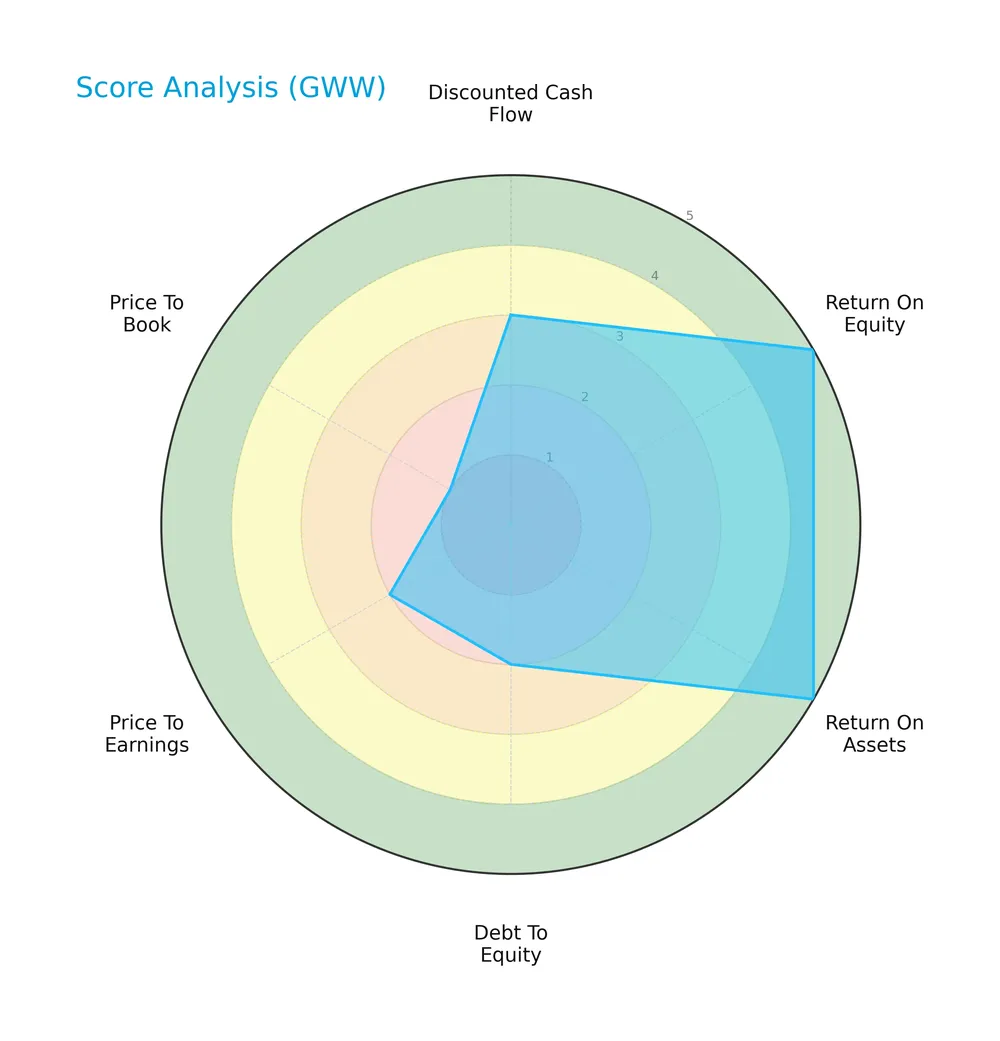
W.W. Grainger scores very favorably on return on equity and assets, indicating strong profitability. However, the debt-to-equity, price-to-earnings, and price-to-book scores are unfavorable to very unfavorable, reflecting concerns about leverage and valuation multiples. The discounted cash flow score is moderate, suggesting mixed expectations for intrinsic value.
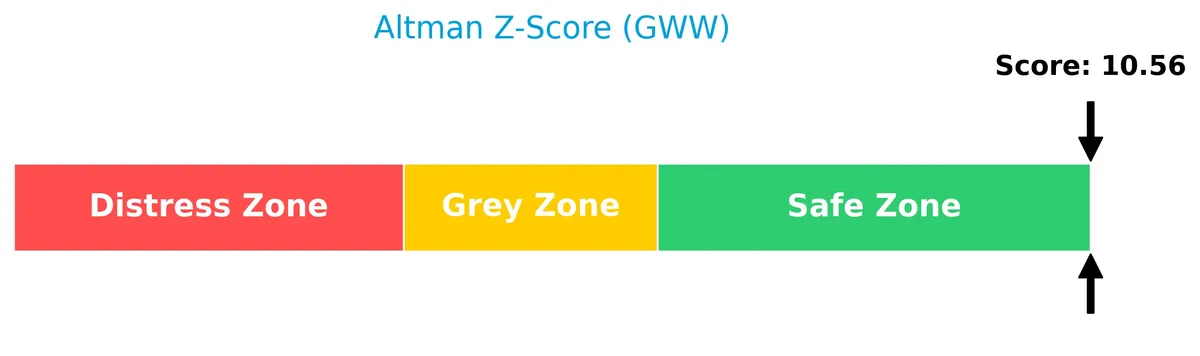
Analysis of the company’s bankruptcy risk
The Altman Z-Score places W.W. Grainger well within the safe zone, signaling a very low risk of bankruptcy:
Is the company in good financial health?
The Piotroski Score diagram provides insight into W.W. Grainger’s financial strength and operational efficiency:
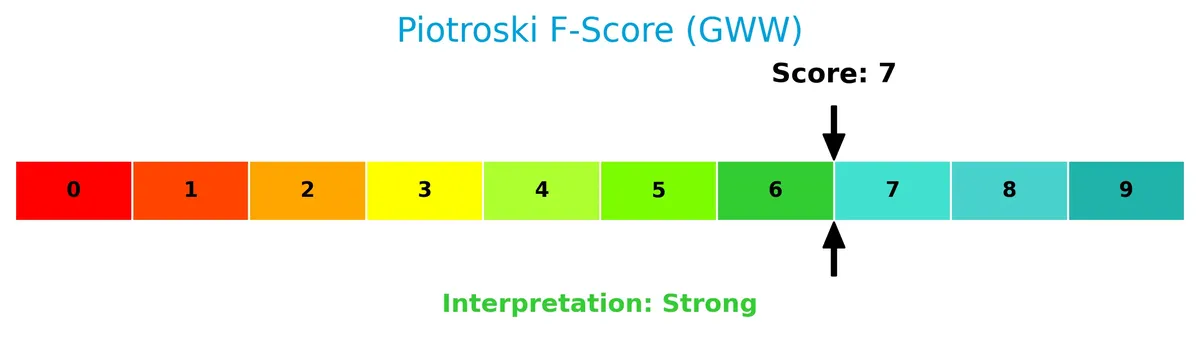
With a score of 7, W.W. Grainger demonstrates strong financial health, reflecting solid profitability and effective management of leverage and liquidity. This suggests the company maintains robust fundamentals relative to peers.
Competitive Landscape & Sector Positioning
This sector analysis examines W.W. Grainger, Inc.’s strategic positioning, revenue by segment, key products, and main competitors. I will assess whether the company holds a competitive advantage over its peers.
Strategic Positioning
W.W. Grainger, Inc. concentrates heavily in North America, with the U.S. generating $14.4B of $17.4B total 2025 revenue. It divides operations into two segments: High-Touch Solutions N.A. ($14B) and Endless Assortment ($3.6B), focusing on MRO products and services.
Revenue by Segment
This pie chart illustrates W.W. Grainger, Inc.’s revenue distribution by segment for fiscal year 2025, highlighting the contributions of “High-Touch Solutions (N.A.)” and “Endless Assortment.”
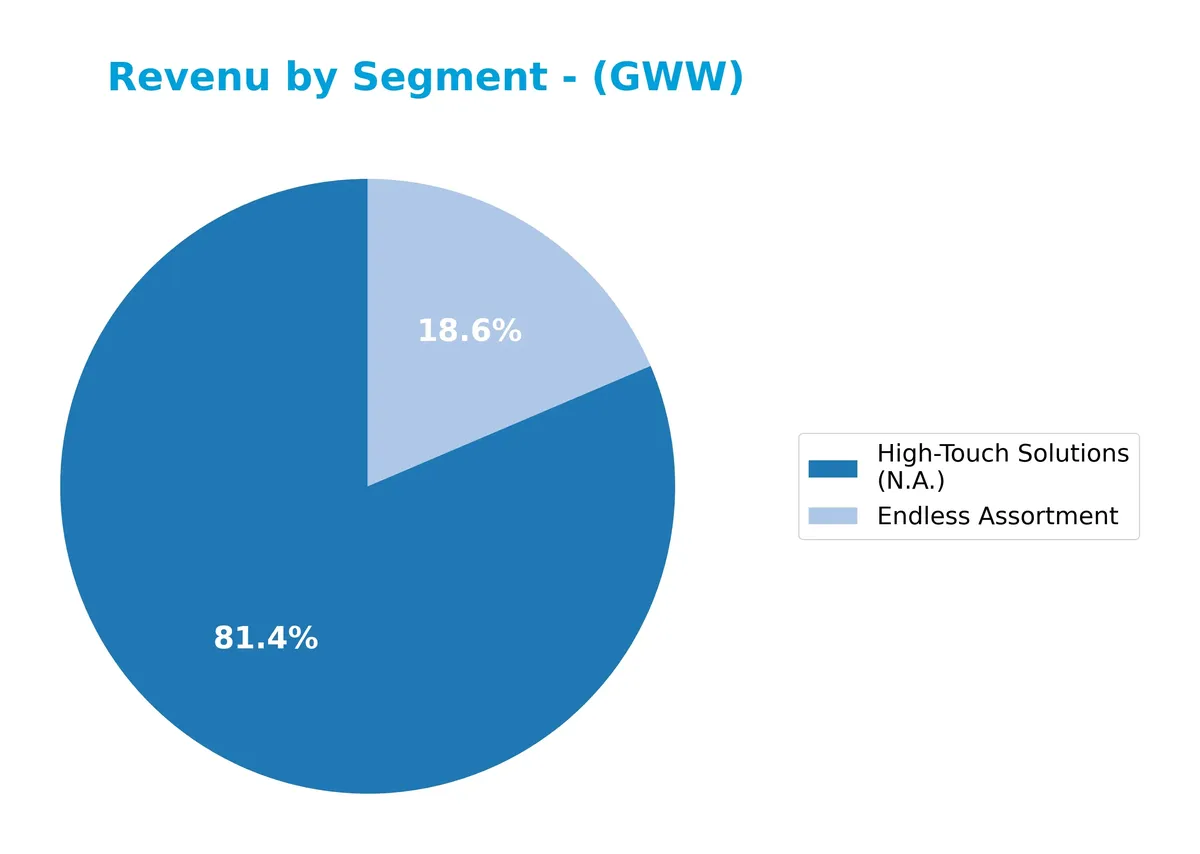
High-Touch Solutions (N.A.) dominates with $13.99B in 2025, showing steady growth since 2021’s $10.19B. Endless Assortment also grows consistently to $3.63B. This trend reveals a strong reliance on High-Touch Solutions, but the steady rise in Endless Assortment diversifies revenue and mitigates concentration risk. The acceleration in both segments signals robust demand and effective segment management.
Key Products & Brands
The table below outlines W.W. Grainger, Inc.’s main products and business segments with brief descriptions:
| Product | Description |
|---|---|
| High-Touch Solutions (N.A.) | Provides maintenance, repair, and operating (MRO) products and services mainly in North America. |
| Endless Assortment | Offers a broad range of MRO products accessible through electronic and ecommerce channels. |
W.W. Grainger’s business centers on two segments: High-Touch Solutions, which generates most revenue through personalized services, and Endless Assortment, which supplies a wide product selection digitally. Both serve institutional and corporate clients globally.
Main Competitors
There are 3 main competitors in the Industrials sector; below is a list of the top 3 leaders by market capitalization:
| Competitor | Market Cap. |
|---|---|
| W.W. Grainger, Inc. | 47.7B |
| Fastenal Company | 46.4B |
| Pool Corporation | 8.6B |
W.W. Grainger, Inc. ranks 1st among its competitors with a market cap 12.3% above the second-largest player, Fastenal Company. It stands above both the average market cap of the top 10 competitors (34.2B) and the sector median (46.4B). The company maintains a significant 15.5% lead over Pool Corporation, the closest competitor below it.
Comparisons with competitors
Check out how we compare the company to its competitors:
Does GWW have a competitive advantage?
W.W. Grainger, Inc. demonstrates a sustainable competitive advantage with a very favorable moat. Its ROIC exceeds WACC by 19.2%, signaling strong value creation and efficient capital use.
The company’s growing ROIC trend supports increasing profitability. Expansion in international markets and ongoing product and service diversification offer promising future growth opportunities.
SWOT Analysis
This analysis highlights W.W. Grainger, Inc.’s key internal and external factors shaping its strategic positioning.
Strengths
- Strong ROIC at 27.7%, well above WACC
- Robust revenue growth of 37.8% over five years
- High Altman Z-score indicates financial safety
Weaknesses
- Elevated P/E at 28.3, may limit valuation upside
- High price-to-book ratio at 11.7 signals overvaluation
- Operating expense growth outpaces revenue growth
Opportunities
- Expansion in international markets, especially Japan
- Growing demand for MRO products in industrial sectors
- Leveraging e-commerce and inventory management services
Threats
- Economic downturn reducing industrial spending
- Rising competition from low-cost distributors
- Supply chain disruptions impacting inventory availability
W.W. Grainger demonstrates strong financial health and sustained competitive advantage. However, valuation concerns and cost pressures require disciplined capital allocation to maximize growth opportunities and mitigate external risks.
Stock Price Action Analysis
The weekly stock chart for W.W. Grainger, Inc. highlights price movements and volatility patterns over the past 100 weeks:
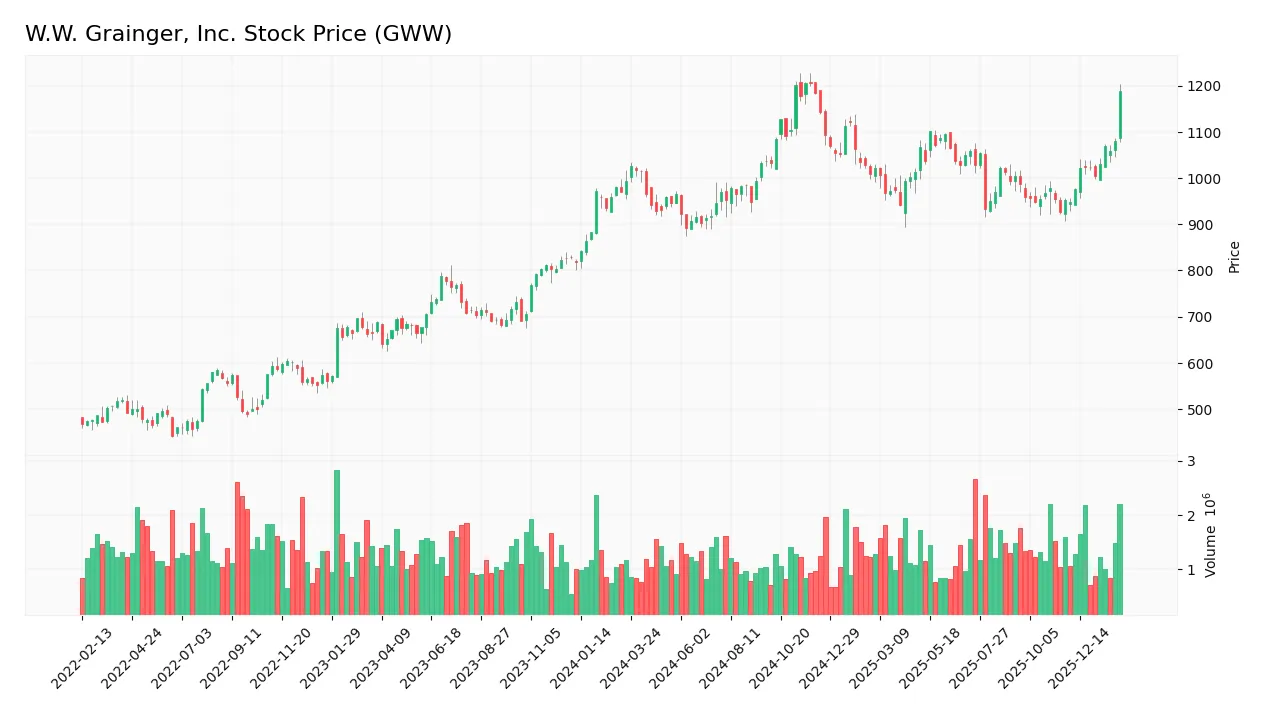
Trend Analysis
Over the past two years, W.W. Grainger’s stock rose by 10.79%, indicating a bullish trend with price acceleration. The stock peaked at 1,206.65 and bottomed at 892.25. Recent weeks show a sharper 15.53% gain, reinforcing positive momentum amid high volatility (standard deviation 73.93).
Volume Analysis
Trading volumes increased notably, with buyer activity dominating 53.6% overall, rising to 68.3% in the recent period. This buyer-driven volume surge signals growing investor confidence and stronger market participation over the last three months.
Target Prices
Analysts present a strong target consensus for W.W. Grainger, Inc., reflecting cautious optimism.
| Target Low | Target High | Consensus |
|---|---|---|
| 1,044 | 1,300 | 1,163 |
The target range indicates expectations for moderate upside potential. Analysts foresee steady growth but remain mindful of sector cyclicality.

Don’t Let Luck Decide Your Entry Point
Optimize your entry points with our advanced ProRealTime indicators. You’ll get efficient buy signals with precise price targets for maximum performance. Start outperforming now!
Analyst & Consumer Opinions
This section examines the latest analyst ratings and consumer feedback regarding W.W. Grainger, Inc. (GWW).
Stock Grades
Here are the latest verified analyst grades for W.W. Grainger, Inc., reflecting recent recommendations and adjustments:
| Grading Company | Action | New Grade | Date |
|---|---|---|---|
| JP Morgan | Maintain | Neutral | 2026-02-06 |
| Oppenheimer | Maintain | Outperform | 2026-02-04 |
| Oppenheimer | Upgrade | Outperform | 2026-01-27 |
| JP Morgan | Maintain | Neutral | 2026-01-16 |
| Morgan Stanley | Maintain | Equal Weight | 2025-11-25 |
| Barclays | Maintain | Underweight | 2025-11-07 |
| RBC Capital | Maintain | Sector Perform | 2025-11-03 |
| RBC Capital | Maintain | Sector Perform | 2025-10-16 |
| JP Morgan | Maintain | Neutral | 2025-10-15 |
| JP Morgan | Maintain | Neutral | 2025-09-04 |
The consensus leans toward a cautious stance with multiple holds and neutrals, balanced by a notable upgrade to outperform from Oppenheimer. The range of grades signals mixed sentiment without strong directional shifts.
Consumer Opinions
W.W. Grainger, Inc. consistently earns praise for reliability and product range but faces criticism on pricing and delivery speed.
| Positive Reviews | Negative Reviews |
|---|---|
| Extensive product selection meets diverse needs. | Pricing is higher compared to competitors. |
| Reliable order fulfillment and inventory availability. | Delivery times can be inconsistent. |
| Responsive customer service resolves issues promptly. | Website navigation feels outdated and clunky. |
Overall, consumers appreciate Grainger’s broad inventory and dependable service. However, pricing concerns and occasional delivery delays remain recurring challenges.
Risk Analysis
Below is a summary table outlining key risks facing W.W. Grainger, Inc., including their likelihood and potential impact:
| Category | Description | Probability | Impact |
|---|---|---|---|
| Valuation Risk | Elevated P/E (28.33) and high P/B (11.67) ratios signal rich valuation. | High | High |
| Debt Risk | Moderate debt-to-equity (0.76) and debt-to-assets (35.29%) ratios; interest coverage strong at 31. | Moderate | Moderate |
| Market Volatility | Beta at 1.108 suggests stock is slightly more volatile than market average. | Moderate | Moderate |
| Dividend Yield | Low dividend yield (0.97%) may limit income appeal. | Low | Low |
| Economic Sensitivity | Exposure to industrial distribution sector could suffer in downturns. | Moderate | High |
Valuation risk stands out as the most pressing concern given Grainger’s premium multiples versus S&P 500 averages. However, its robust Altman Z-Score (10.07) and Piotroski Score (7) confirm strong financial health. Market volatility and economic sensitivity pose moderate risks due to sector cyclicality. Debt levels remain manageable with excellent interest coverage, mitigating solvency concerns.
Should You Buy W.W. Grainger, Inc.?
W.W. Grainger, Inc. appears to be a robust value creator with a very favorable moat supported by growing ROIC well above WACC. Despite an unfavorable leverage profile, the company’s overall B+ rating and strong financial health suggest a solid operational efficiency.
Strength & Efficiency Pillars
W.W. Grainger, Inc. exhibits strong operational efficiency, with a favorable net margin of 9.51% and an impressive return on equity (ROE) of 41.2%. The company’s return on invested capital (ROIC) stands at 27.73%, significantly exceeding its weighted average cost of capital (WACC) of 8.53%. This margin indicates that Grainger is a clear value creator. Its robust asset turnover (2.0) and fixed asset turnover (6.87) further underline efficient capital deployment, supporting sustainable profitability and competitive advantage.
Weaknesses and Drawbacks
Despite solid fundamentals, Grainger faces valuation headwinds. The price-to-earnings ratio at 28.33 and price-to-book ratio at 11.67 are both unfavorable, signaling a premium market valuation that may limit upside. Although debt-to-equity is moderate at 0.76, it flags some leverage risk. Dividend yield at 0.97% is relatively low, potentially disappointing income-focused investors. However, buyer dominance at 68.28% in the recent period mitigates short-term market pressure, suggesting some positive investor sentiment.
Our Final Verdict about W.W. Grainger, Inc.
Grainger’s fundamentals appear attractive, supported by a strong moat and value creation profile. The bullish overall trend, combined with recent buyer dominance, suggests momentum may continue. However, premium valuation metrics and moderate leverage imply cautious positioning. This profile might appear suitable for investors seeking long-term growth exposure but suggests a wait-and-see approach for those prioritizing entry price and risk mitigation.
Disclaimer: This content is for informational purposes only and does not constitute financial, investment, or other professional advice. Investing in financial markets involves a significant risk of loss, and past performance is not indicative of future results.
Additional Resources
- W.W. Grainger (GWW) Gets Price Target Increase from JPMorgan Following Earnings Update – Insider Monkey (Feb 20, 2026)
- W.W. Grainger, Inc.’s (NYSE:GWW) Stock Is Going Strong: Is the Market Following Fundamentals? – Yahoo Finance (Feb 16, 2026)
- Decoding W.W. Grainger Inc (GWW): A Strategic SWOT Insight – GuruFocus (Feb 20, 2026)
- A Look At W.W. Grainger (GWW) Valuation After Q4 Beat And 2026 Sales Guidance – Sahm (Feb 17, 2026)
- Caprock Group LLC Makes New $4.21 Million Investment in W.W. Grainger, Inc. $GWW – MarketBeat (Feb 12, 2026)
For more information about W.W. Grainger, Inc., please visit the official website: grainger.com