Home > Analyses > Financial Services > W. R. Berkley Corporation
W. R. Berkley Corporation underwrites the risks that keep businesses and communities secure worldwide. As a top player in property and casualty insurance, it combines broad commercial coverage with specialized solutions for industries like technology and life sciences. Its reputation for disciplined underwriting and innovative risk management sets it apart. The key question now: does Berkley’s financial strength and strategic agility continue to justify its premium valuation and growth outlook?

Table of contents
Business Model & Company Overview
W. R. Berkley Corporation, founded in 1967 and headquartered in Greenwich, CT, stands as a major player in the Property & Casualty insurance sector. It operates a unified ecosystem of commercial insurance, reinsurance, and specialty risk products. This integrated approach supports diverse client needs, from workers’ compensation to cyber risk solutions, reinforcing its dominant market position with 8.6K employees driving innovation.
The company’s revenue engine balances underwriting commercial lines with reinsurance services tailored to insurers and self-insured entities globally. Its footprint spans the Americas, Europe, and Asia, enabling broad risk diversification and premium sourcing. Berkley’s competitive advantage lies in its specialized, flexible underwriting and strong client relationships, cementing a durable economic moat in a complex, evolving industry landscape.
Financial Performance & Fundamental Metrics
I will analyze W. R. Berkley Corporation’s income statement, key financial ratios, and dividend payout policy to assess its core financial health and shareholder value.
Income Statement
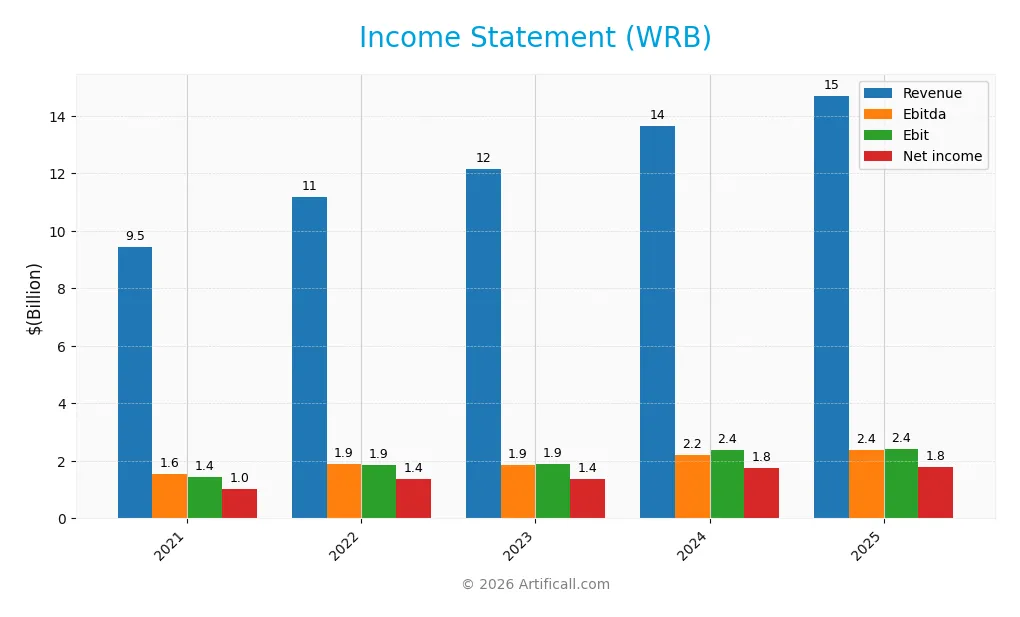
The table below presents W. R. Berkley Corporation’s key income statement figures for fiscal years 2021 through 2025, reflecting its financial performance over time.
| 2021 | 2022 | 2023 | 2024 | 2025 | |
|---|---|---|---|---|---|
| Revenue | 9.46B | 11.17B | 12.14B | 13.64B | 14.71B |
| Cost of Revenue | 7.43B | 8.73B | 9.42B | 10.52B | 11.79B |
| Operating Expenses | 740M | 718M | 970M | 857M | 579M |
| Gross Profit | 2.02B | 2.44B | 2.72B | 3.12B | 2.91B |
| EBITDA | 1.56B | 1.91B | 1.86B | 2.22B | 2.37B |
| EBIT | 1.43B | 1.85B | 1.88B | 2.39B | 2.41B |
| Interest Expense | 147M | 130M | 127M | 127M | 127M |
| Net Income | 1.02B | 1.38B | 1.38B | 1.76B | 1.78B |
| EPS | 2.46 | 3.33 | 3.40 | 4.39 | 4.48 |
| Filing Date | 2022-02-24 | 2023-02-24 | 2024-02-23 | 2025-02-24 | 2026-02-27 |
Income Statement Evolution
From 2021 to 2025, W. R. Berkley’s revenue rose 55.5%, reflecting steady expansion. Net income grew even faster, up 74.0%, indicating improved profitability. Gross margin remained neutral at 19.8%, while net margin improved 11.9%, suggesting better cost control and operational efficiency over the period.
Is the Income Statement Favorable?
In 2025, revenue increased 7.8% year-over-year, but gross profit declined 6.7%, signaling margin pressure at the top line. Operating expenses grew in line with revenue, supporting a stable EBIT margin of 16.4%. Interest expense stayed low at 0.9% of revenue, and net margin held favorably at 12.1%. Overall, fundamentals appear favorable despite some margin headwinds.
Financial Ratios
Below is a summary of key financial ratios for W. R. Berkley Corporation over the past five fiscal years:
| Ratios | 2021 | 2022 | 2023 | 2024 | 2025 |
|---|---|---|---|---|---|
| Net Margin | 10.8% | 12.4% | 11.4% | 12.9% | 12.1% |
| ROE | 15.4% | 20.5% | 18.5% | 20.9% | 18.1% |
| ROIC | — | 256.5% | 256.3% | — | — |
| P/E | 15.0 | 14.7 | 14.0 | 13.3 | 15.6 |
| P/B | 2.31 | 3.01 | 2.59 | 2.79 | 2.84 |
| Current Ratio | 0 | 0 | 0 | 0 | 0 |
| Quick Ratio | 0 | 0 | 0 | 0 | 0 |
| D/E | 0.49 | 0.42 | 0.38 | 0.34 | 0.29 |
| Debt-to-Assets | 10.2% | 8.4% | 7.6% | 7.0% | 22.0% |
| Interest Coverage | 8.7x | 13.2x | 13.8x | 17.8x | 18.4x |
| Asset Turnover | 0.29 | 0.33 | 0.33 | 0.34 | 1.14 |
| Fixed Asset Turnover | 22.5x | 26.4x | 28.5x | 28.5x | 0 |
| Dividend Yield | 2.3% | 1.2% | 2.6% | 2.3% | 2.6% |
Evolution of Financial Ratios
From 2021 to 2025, W. R. Berkley’s Return on Equity (ROE) improved steadily, peaking at 18.15% in 2025. The Current Ratio remained at zero throughout, indicating a lack of reported liquidity data. The Debt-to-Equity Ratio declined from 0.49 in 2021 to 0.29 in 2025, reflecting a reduction in leverage and improved financial stability. Profitability showed consistent growth over the period.
Are the Financial Ratios Fovorable?
In 2025, profitability ratios like net margin (12.1%) and ROE (18.15%) are favorable, surpassing many industry benchmarks. The Debt-to-Equity (0.29) and debt-to-assets (22.04%) ratios indicate conservative leverage. Liquidity ratios are unfavorable due to zero values, posing a risk signal. Market valuation ratios such as P/E (15.63) and P/B (2.84) are neutral. Overall, 57% of key ratios are favorable, supporting a generally positive financial profile.
Shareholder Return Policy
W. R. Berkley Corporation maintains a consistent dividend payout ratio around 30-40%, with dividends per share rising from $0.85 in 2021 to $1.85 in 2025. The annual dividend yield hovers near 2.6%, supported by strong free cash flow coverage and manageable capital expenditures.
The company also engages in share buybacks, complementing its dividend payments. This balanced distribution approach, underpinned by robust cash flow and prudent capital allocation, supports sustainable long-term shareholder value without risking overextension or unsustainable payouts.
Score analysis
The following radar chart visualizes W. R. Berkley Corporation’s key financial scores across valuation, profitability, and leverage metrics:
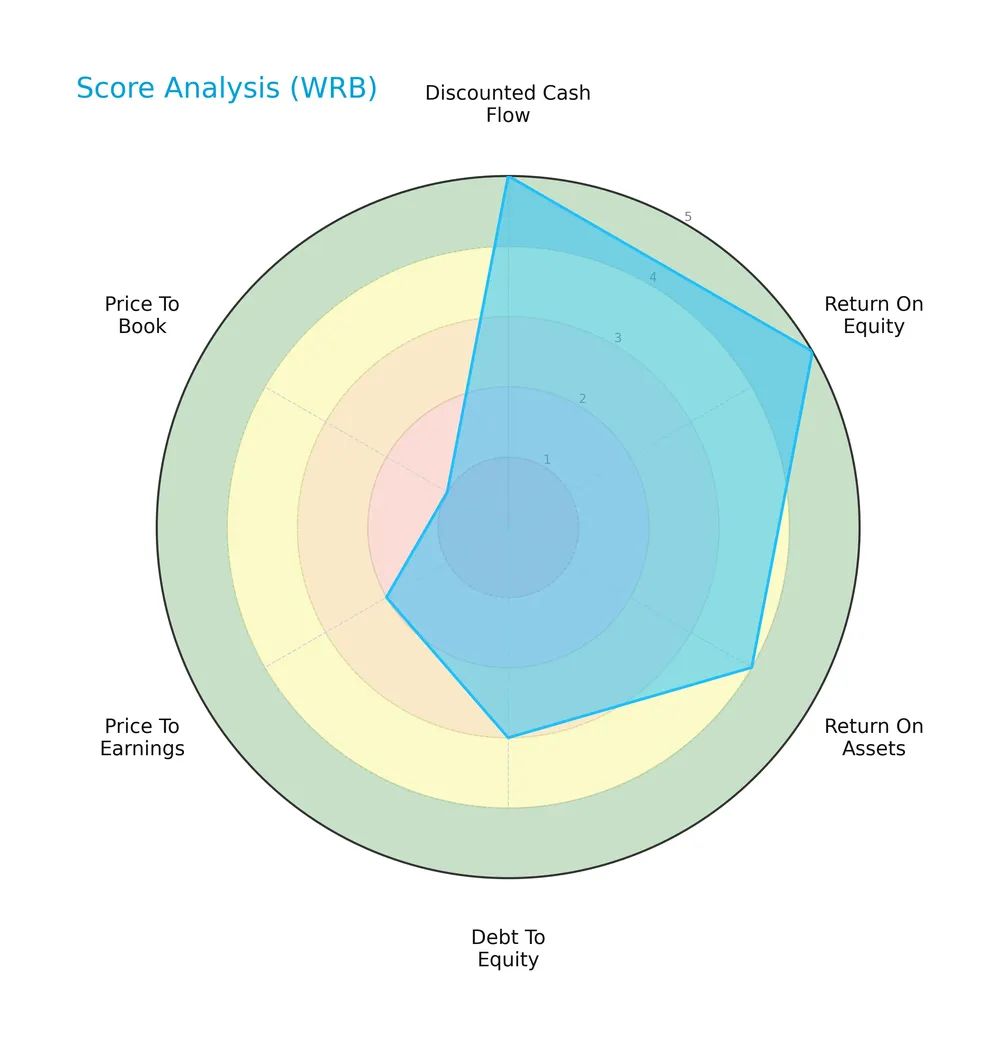
W. R. Berkley scores very favorably on discounted cash flow and return on equity, showing strong profitability and value creation. Return on assets is favorable, but debt to equity stands at a moderate level. Valuation scores—price to earnings and price to book—are unfavorable to very unfavorable, suggesting market pricing concerns.
Analysis of the company’s bankruptcy risk
The Altman Z-Score places W. R. Berkley firmly in the distress zone, signaling a high probability of financial distress and bankruptcy risk:

Is the company in good financial health?
The Piotroski Score diagram illustrates the company’s financial strength based on nine fundamental criteria:

With a score of 6, W. R. Berkley reflects average financial health. This indicates moderate operational efficiency and profitability, but not the robust strength seen in higher-scoring firms.
Competitive Landscape & Sector Positioning
This sector analysis will examine W. R. Berkley Corporation’s strategic positioning, revenue segments, key products, and main competitors. I will assess whether the company holds a competitive advantage within the property and casualty insurance industry.
Strategic Positioning
W. R. Berkley Corporation concentrates primarily on the U.S. domestic insurance market, generating over $11B in 2024 from this segment. It complements this with a global reinsurance business nearing $1.7B, reflecting a strategic balance between domestic commercial insurance and international risk management.
Revenue by Segment
The pie chart illustrates W. R. Berkley Corporation’s revenue breakdown by segment for fiscal year 2024, highlighting the relative scale of its business units.
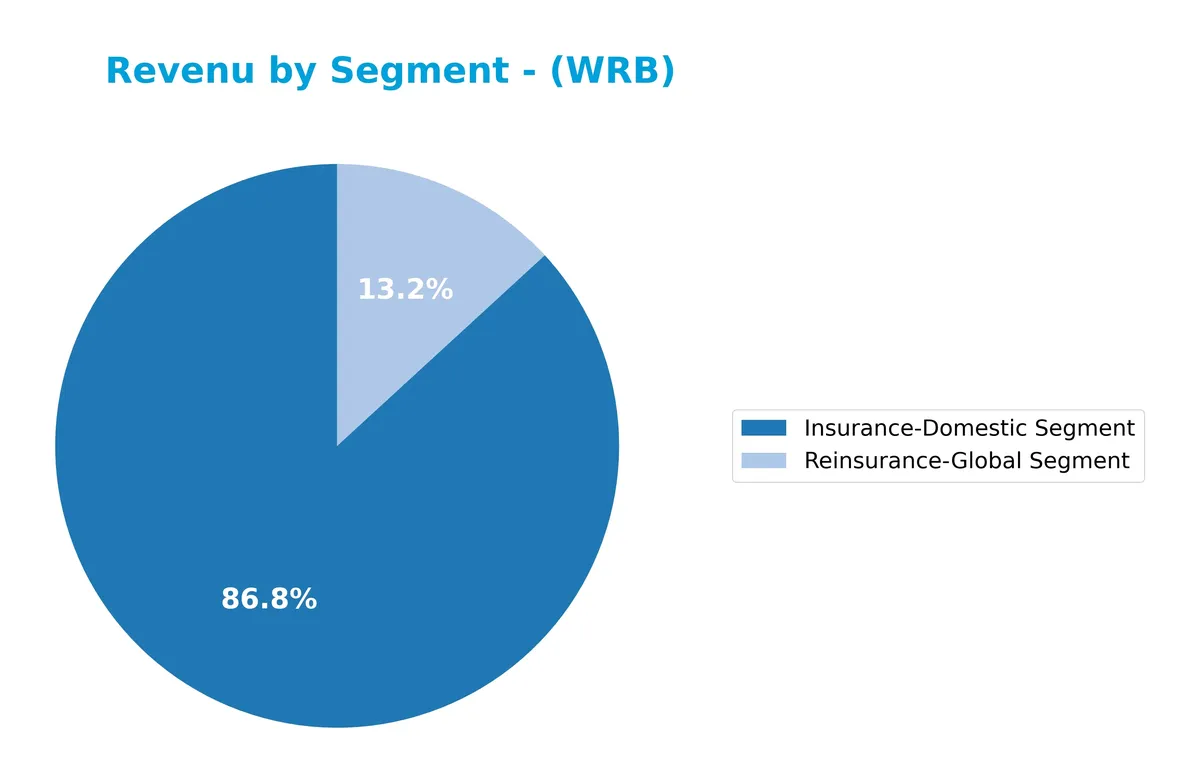
In 2024, the Insurance-Domestic segment dominates with $11.2B in revenue, reflecting steady growth over recent years. The Reinsurance-Global segment follows, contributing $1.7B, showing consistent but slower expansion. The company’s revenue increasingly concentrates in domestic insurance, signaling a strategic focus and potential concentration risk. This trend aligns with industry patterns where domestic markets often provide more stable profit margins than global reinsurance.
Key Products & Brands
W. R. Berkley Corporation operates two main insurance segments, each offering a range of specialized products:
| Product | Description |
|---|---|
| Insurance-Domestic Segment | Commercial insurance including premises, auto, property, liability, workers’ compensation, specialty environmental, cyber risk, personal lines, and alternative risk management services. |
| Reinsurance & Monoline Excess Segment | Provides treaty and facultative reinsurance solutions to insurance companies and self-insured entities, managing net risk portfolios globally. |
W. R. Berkley’s core business revolves around comprehensive commercial insurance and reinsurance. The domestic insurance segment dominates revenue, reflecting broad product diversity and exposure to multiple industry verticals. The reinsurance segment supports risk management for other insurers worldwide.
Main Competitors
There are 7 competitors in total; the table below lists the top 7 leaders by market capitalization:
| Competitor | Market Cap. |
|---|---|
| The Progressive Corporation | 124B |
| Chubb Limited | 124B |
| The Travelers Companies, Inc. | 64B |
| The Allstate Corporation | 54B |
| W. R. Berkley Corporation | 26B |
| Cincinnati Financial Corporation | 25B |
| Loews Corporation | 22B |
W. R. Berkley Corporation ranks 5th among its competitors, with a market cap about 22% that of the leader, The Progressive Corporation. It sits below both the average market cap of the top 10 (63B) and the median sector cap (54B). The company enjoys a 98% market cap gap over its closest rival above, indicating a significant scale difference.
Comparisons with competitors
Check out how we compare the company to its competitors:
Does WRB have a competitive advantage?
W. R. Berkley Corporation currently lacks a competitive advantage, as its ROIC falls below WACC by 5.06%, indicating value destruction rather than creation. The company’s profitability remains stable but insufficient to generate excess returns or reinvest capital efficiently.
Looking ahead, WRB operates across diverse commercial and specialty insurance lines with opportunities to expand in cyber risk and alternative risk programs. Future growth may hinge on leveraging these products and markets to improve capital efficiency and enhance shareholder value.
SWOT Analysis
This SWOT analysis highlights W. R. Berkley Corporation’s key strategic factors shaping its competitive position and growth prospects.
Strengths
- diversified commercial insurance portfolio
- strong net margin of 12.1%
- conservative debt-to-equity ratio at 0.29
Weaknesses
- negative ROIC vs WACC indicates value destruction
- low liquidity ratios pose short-term risk
- weak Altman Z-score signals financial distress
Opportunities
- expanding specialty insurance lines
- growing international market presence
- leveraging technology for cyber risk solutions
Threats
- intense competition in property & casualty insurance
- regulatory changes impacting underwriting
- economic downturn reducing commercial insurance demand
W. R. Berkley enjoys solid profitability and prudent leverage but faces liquidity and capital efficiency challenges. Its strategy should focus on improving capital returns while exploiting specialty markets and technological innovation to sustain growth amid competitive and regulatory pressures.
Stock Price Action Analysis
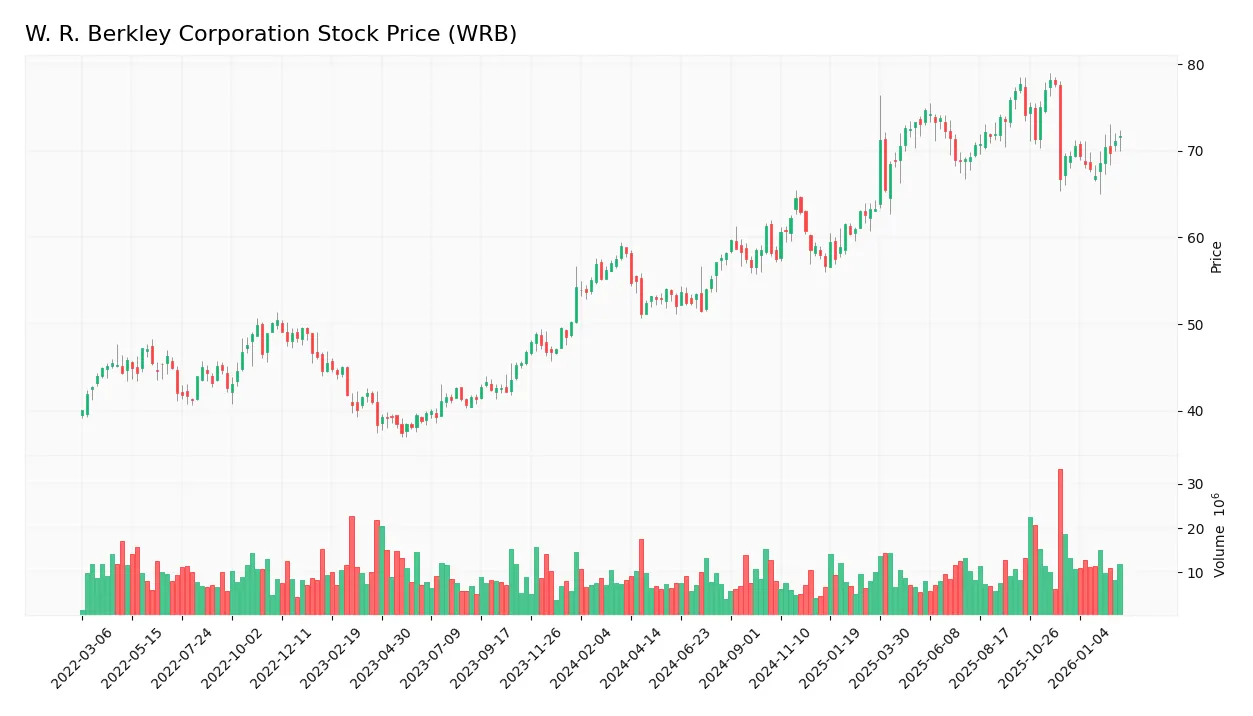
The weekly chart illustrates W. R. Berkley Corporation’s stock price movement over the past 12 months, highlighting key price fluctuations and trend patterns:
Trend Analysis
Over the past 12 months, WRB’s stock price rose by 23.26%, indicating a bullish trend. The price ranged between 51.1 and 78.1, with volatility at 7.83. Despite strong gains, the momentum shows deceleration, suggesting a slowing upward trend.
Volume Analysis
In the last three months, volume increased with buyer dominance at 60.5%. Buyers accounted for 87.7M shares versus sellers’ 57.2M, signaling strong investor interest and positive market participation. This buyer-driven activity supports upward price pressure.
Target Prices
Analysts set a solid target consensus for W. R. Berkley Corporation, reflecting measured optimism in its outlook.
| Target Low | Target High | Consensus |
|---|---|---|
| 64 | 80 | 71 |
The target price range suggests moderate upside potential, with consensus clustering near 71, indicating steady confidence among analysts.

Don’t Let Luck Decide Your Entry Point
Optimize your entry points with our advanced ProRealTime indicators. You’ll get efficient buy signals with precise price targets for maximum performance. Start outperforming now!
Analyst & Consumer Opinions
This section reviews analyst grades and consumer feedback related to W. R. Berkley Corporation (WRB) to gauge market sentiment.
Stock Grades
The latest verified analyst grades for W. R. Berkley Corporation reveal a consistent pattern across major firms:
| Grading Company | Action | New Grade | Date |
|---|---|---|---|
| Argus Research | Maintain | Buy | 2026-02-02 |
| Cantor Fitzgerald | Maintain | Overweight | 2026-02-02 |
| Truist Securities | Maintain | Buy | 2026-01-28 |
| Wells Fargo | Maintain | Equal Weight | 2026-01-27 |
| B of A Securities | Maintain | Neutral | 2026-01-27 |
| Mizuho | Maintain | Neutral | 2026-01-27 |
| Jefferies | Maintain | Hold | 2026-01-27 |
| TD Cowen | Downgrade | Sell | 2026-01-20 |
| Cantor Fitzgerald | Maintain | Overweight | 2026-01-14 |
| Wells Fargo | Maintain | Equal Weight | 2026-01-13 |
The consensus leans toward a Hold rating, reflecting mixed sentiment with a tilt toward caution. Most firms maintain previous grades, signaling steady views despite a notable downgrade by TD Cowen.
Consumer Opinions
W. R. Berkley Corporation garners a mix of praise and critique from its customer base, reflecting its complex position in the insurance sector.
| Positive Reviews | Negative Reviews |
|---|---|
| Responsive claims handling speeds resolution | Premiums perceived as higher than competitors |
| Strong underwriting expertise | Limited digital self-service options |
| Personalized customer support | Occasional delays in policy updates |
Overall, consumers appreciate Berkley’s personalized service and claims efficiency. However, pricing and technology adoption remain recurring concerns that could impact customer retention.
Risk Analysis
Below is a summary table outlining the key risks facing W. R. Berkley Corporation in 2026:
| Category | Description | Probability | Impact |
|---|---|---|---|
| Financial Distress | Altman Z-Score in distress zone (-0.73) signals heightened bankruptcy risk. | High | High |
| Valuation Risk | Unfavorable P/E and P/B ratios indicate potential overvaluation. | Moderate | Medium |
| Liquidity Risk | Current and quick ratios are zero, raising concerns about short-term safety. | Moderate | High |
| Operational Risk | Unfavorable fixed asset turnover suggests underutilized assets. | Low | Medium |
| Debt Management | Moderate debt-to-equity ratio (0.29) shows controlled leverage. | Low | Low |
| Market Volatility | Low beta (0.36) suggests limited stock price volatility. | Low | Low |
The most alarming risk is financial distress, as the Altman Z-Score firmly places WRB in the distress zone, an uncommon signal for an insurance firm of this size. Additionally, liquidity metrics are missing or unfavorable, which raises red flags about the company’s ability to cover short-term obligations despite its favorable debt ratios. Valuation risks persist due to neutral to unfavorable multiples, potentially limiting upside against benchmarks like the S&P 500. Investors must weigh these risks carefully against WRB’s strong profitability and capital allocation history.
Should You Buy W. R. Berkley Corporation?
W. R. Berkley Corporation appears to be a company with robust profitability and operational efficiency but an unfavorable moat, reflecting value destruction. Despite a manageable leverage profile, its overall financial health suggests an A- rating, warranting cautious interpretation.
Strength & Efficiency Pillars
W. R. Berkley Corporation posts solid operational metrics, with a favorable net margin of 12.1% and return on equity at 18.15%. Its EBIT margin of 16.35% underscores efficient core operations. However, the company’s return on invested capital is 0%, falling short of its WACC of 5.06%, signaling it currently does not create value on capital employed. While profitability is stable, the lack of ROIC excess weakens its capacity for sustainable value creation.
Weaknesses and Drawbacks
The company is in financial distress, evidenced by an Altman Z-Score of -0.73, placing it deep in the Distress Zone and indicating elevated bankruptcy risk. Liquidity ratios such as current and quick ratios are unavailable or unfavorable, compounding solvency concerns. Valuation metrics show neutrality with a P/E of 15.63 and P/B of 2.84, but leverage remains moderate with a debt-to-equity ratio of 0.29. These factors, alongside distress signals, pose significant financial stability risks.
Our Final Verdict about W. R. Berkley Corporation
Despite operational strengths and favorable margins, the company’s solvency risk, as highlighted by its Distress Zone Altman Z-Score, makes the investment profile highly speculative. This risk overshadows profitability and growth trends, suggesting W. R. Berkley may be too risky for conservative capital at this stage. Investors might consider waiting for clearer financial stability before committing.
Disclaimer: This content is for informational purposes only and does not constitute financial, investment, or other professional advice. Investing in financial markets involves a significant risk of loss, and past performance is not indicative of future results.
Additional Resources
- 300,000 W. R. Berkley (NYSE: WRB) shares bought by major holder – Stock Titan (Feb 28, 2026)
- Decoding WR Berkley Corp (WRB): A Strategic SWOT Insight – GuruFocus (Feb 28, 2026)
- Sumitomo Insurance Co Mitsui Buys 153,000 Shares of W.R. Berkley (NYSE:WRB) Stock – MarketBeat (Feb 28, 2026)
- Mitsui Sumitomo buys Berkley (WRB) shares worth $21.5 million – Investing.com (Feb 28, 2026)
- W.R. Berkley (WRB) Up 6.5% Since Last Earnings Report: Can It Continue? – Yahoo Finance (Feb 25, 2026)
For more information about W. R. Berkley Corporation, please visit the official website: berkley.com