Home > Analyses > Basic Materials > Vulcan Materials Company
Vulcan Materials Company builds the foundation beneath America’s infrastructure. As the largest producer of construction aggregates, it shapes highways, housing, and commercial projects nationwide. Its leadership spans aggregates, asphalt, concrete, and calcium products, delivering consistent innovation and quality. With a market presence exceeding four decades, Vulcan’s role in construction endures. Yet, as market dynamics shift in 2026, I question if its fundamentals fully support its premium valuation and future growth prospects.
Table of contents
Business Model & Company Overview
Vulcan Materials Company, founded in 1909 and headquartered in Birmingham, Alabama, dominates the U.S. construction materials sector. It delivers a cohesive ecosystem of aggregates, asphalt, concrete, and calcium products that underpin infrastructure development and maintenance. Vulcan serves highways, streets, housing, and commercial construction, reflecting a broad footprint in essential public and private works.
The company’s revenue engine balances bulk aggregates with asphalt and ready-mixed concrete sales across key U.S. regions, including California, Texas, and the East Coast. Calcium products diversify its portfolio into animal feed and water treatment industries. Vulcan’s competitive advantage stems from a vast network of operations and integrated product lines, securing its role as a cornerstone in shaping America’s built environment.
Financial Performance & Fundamental Metrics
I will analyze Vulcan Materials Company’s income statement, key financial ratios, and dividend payout policy to assess its core financial health and shareholder value.
Income Statement
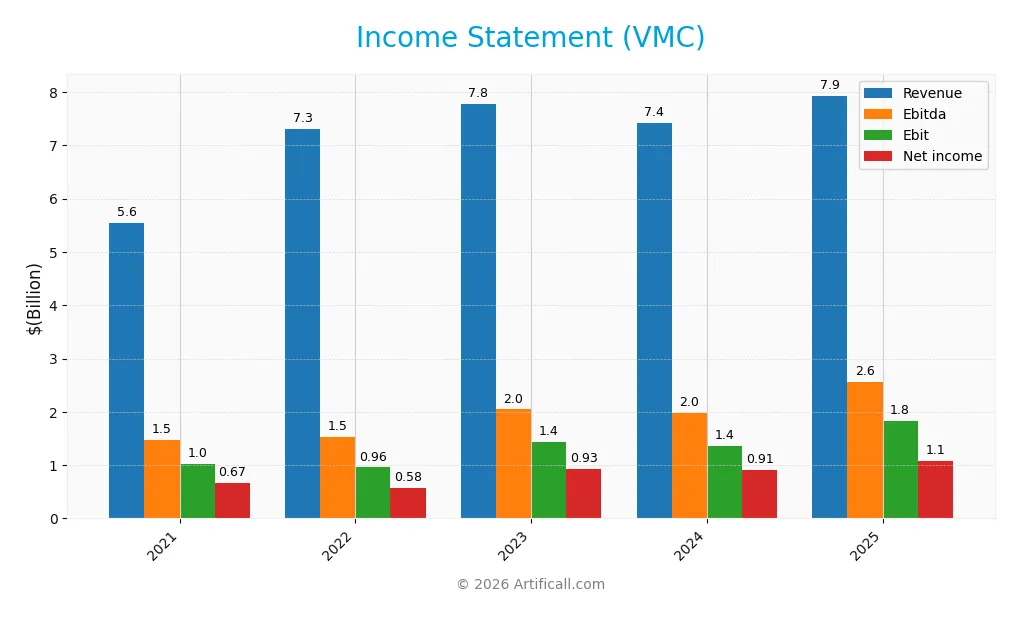
The following table presents Vulcan Materials Company’s key income statement figures for the last five fiscal years, highlighting revenue, profitability, and earnings per share trends.
| 2021 | 2022 | 2023 | 2024 | 2025 | |
|---|---|---|---|---|---|
| Revenue | 5.55B | 7.32B | 7.78B | 7.42B | 7.93B |
| Cost of Revenue | 4.18B | 5.76B | 5.83B | 5.42B | 5.77B |
| Operating Expenses | 363M | 606M | 521M | 635M | 574M |
| Gross Profit | 1.37B | 1.56B | 1.95B | 2.00B | 2.17B |
| EBITDA | 1.47B | 1.53B | 2.04B | 1.98B | 2.56B |
| EBIT | 1.02B | 957M | 1.44B | 1.36B | 1.82B |
| Interest Expense | 149M | 169M | 196M | 191M | 467M |
| Net Income | 671M | 576M | 933M | 912M | 1.08B |
| EPS | 5.05 | 4.33 | 7.02 | 6.89 | 8.15 |
| Filing Date | 2022-02-25 | 2023-02-24 | 2024-02-22 | 2025-02-20 | 2026-02-19 |
Income Statement Evolution
Between 2021 and 2025, Vulcan Materials Company’s revenue rose 43% to $7.9B, showing steady top-line expansion. Net income grew 61% to $1.08B, outpacing revenue growth and boosting net margins by nearly 13%. Gross and EBIT margins improved favorably, reflecting efficient cost management amid rising expenses.
Is the Income Statement Favorable?
In 2025, Vulcan’s fundamentals appear favorable with a 27.3% gross margin and a 13.6% net margin, both above sector averages. EBIT surged 34% year-over-year to $1.82B, supported by disciplined operating expenses growing in line with revenue. Interest expense remains neutral at 5.9% of revenue, maintaining manageable leverage.
Financial Ratios
The following table presents key financial ratios for Vulcan Materials Company (VMC) from 2021 to 2025, illustrating profitability, liquidity, leverage, and market valuation metrics:
| Ratios | 2021 | 2022 | 2023 | 2024 | 2025 |
|---|---|---|---|---|---|
| Net Margin | 12.1% | 7.9% | 12.0% | 12.3% | 13.6% |
| ROE | 10.2% | 8.3% | 12.5% | 11.2% | 12.7% |
| ROIC | 6.0% | 5.4% | 7.9% | 6.6% | 8.0% |
| P/E | 41.1 | 40.5 | 32.4 | 37.3 | 34.8 |
| P/B | 4.21 | 3.36 | 4.03 | 4.19 | 4.41 |
| Current Ratio | 2.20 | 1.99 | 3.17 | 1.83 | 2.69 |
| Quick Ratio | 1.52 | 1.38 | 2.39 | 1.28 | 1.97 |
| D/E | 0.69 | 0.65 | 0.59 | 0.72 | 0.63 |
| Debt-to-Assets | 33.1% | 31.8% | 30.1% | 34.1% | 32.4% |
| Interest Coverage | 6.8x | 5.6x | 7.3x | 7.1x | 3.4x |
| Asset Turnover | 0.41 | 0.51 | 0.53 | 0.43 | 0.48 |
| Fixed Asset Turnover | 0.89 | 1.10 | 1.16 | 0.83 | 0.53 |
| Dividend Yield | 0.71% | 0.91% | 0.76% | 0.72% | 0.69% |
Evolution of Financial Ratios
From 2021 to 2025, Vulcan Materials Company’s Return on Equity showed steady growth, reaching 12.68% in 2025, indicating stable profitability. The Current Ratio improved significantly to 2.69 in 2025, reflecting enhanced liquidity. Meanwhile, the Debt-to-Equity Ratio remained relatively stable around 0.63, suggesting consistent leverage levels over the period.
Are the Financial Ratios Fovorable?
In 2025, profitability measured by net margin was favorable at 13.63%, but ROE and ROIC were neutral, close to the WACC of 8.39%. Liquidity ratios, including current and quick ratios, were favorable, signaling strong short-term financial health. Leverage ratios, such as debt-to-equity and interest coverage, were neutral. Market valuation ratios like P/E, P/B, asset turnover, and dividend yield were unfavorable, leading to a slightly unfavorable overall ratios assessment.
Shareholder Return Policy
Vulcan Materials Company maintains a consistent dividend policy with a payout ratio near 24%, supporting a modest yield around 0.7%. Dividends per share have steadily increased from $1.48 in 2021 to $1.97 in 2025, backed by solid free cash flow coverage. The company also engages in share buybacks, complementing its distributions without compromising capital expenditure needs.
This balanced approach aligns with sustainable long-term value creation. The dividend and buyback programs appear well-covered by operating cash flow and free cash flow, reducing risks of financial strain. Vulcan’s prudent distribution policy reflects a mature capital allocation strategy typical of stable industrial firms, supporting shareholder returns without sacrificing investment in growth or debt management.
Score analysis
The following radar chart illustrates Vulcan Materials Company’s key financial scores across valuation, profitability, and leverage:
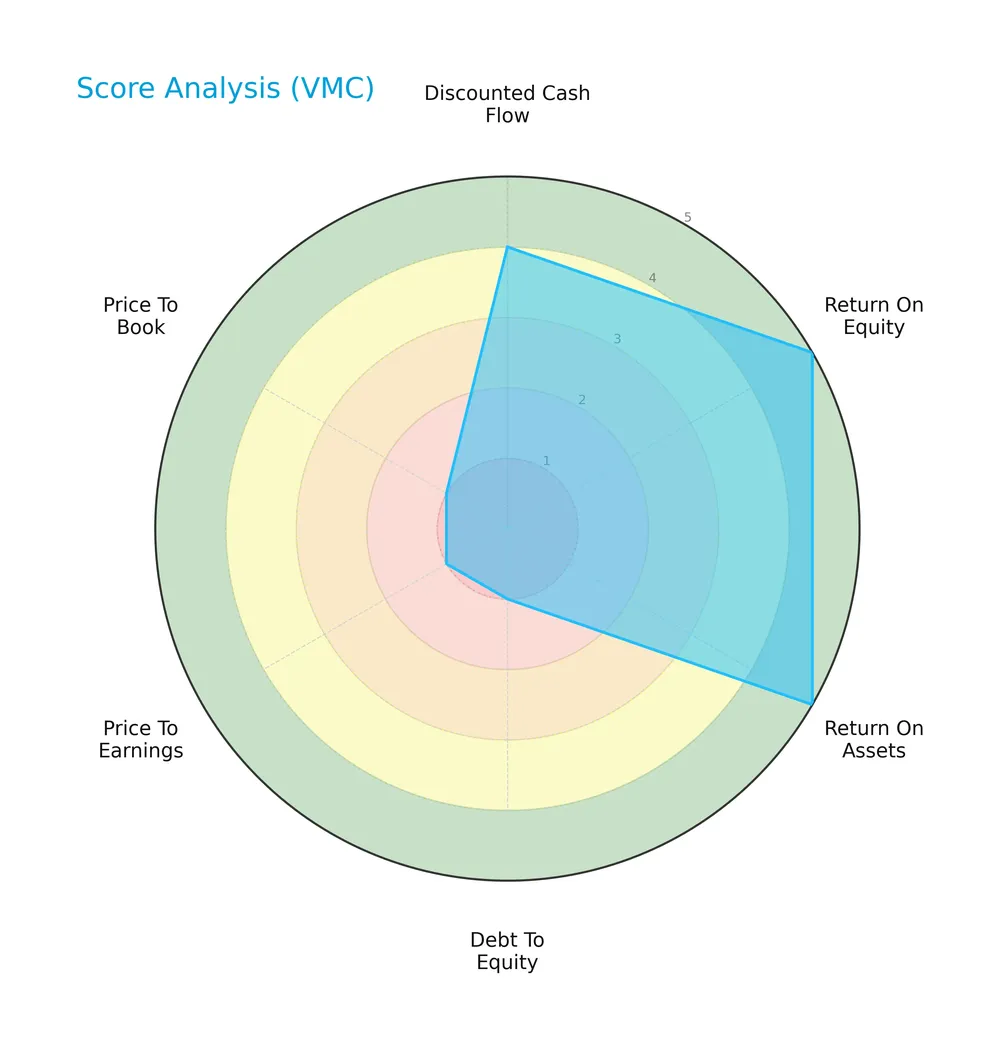
VMC scores very favorably in return on equity (5) and return on assets (5), indicating strong profitability. Its discounted cash flow score is favorable (4). However, debt to equity (1), price to earnings (1), and price to book (1) scores are very unfavorable, signaling valuation and leverage concerns.
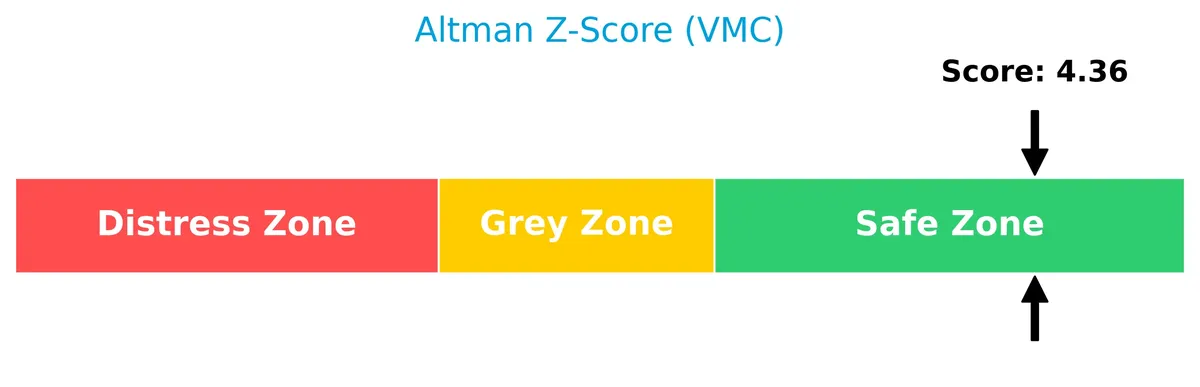
Analysis of the company’s bankruptcy risk
VMC’s Altman Z-Score of 4.39 places it well within the safe zone, indicating low bankruptcy risk and solid financial stability:
Is the company in good financial health?
The Piotroski Score diagram below reflects VMC’s financial strength based on nine fundamental criteria:
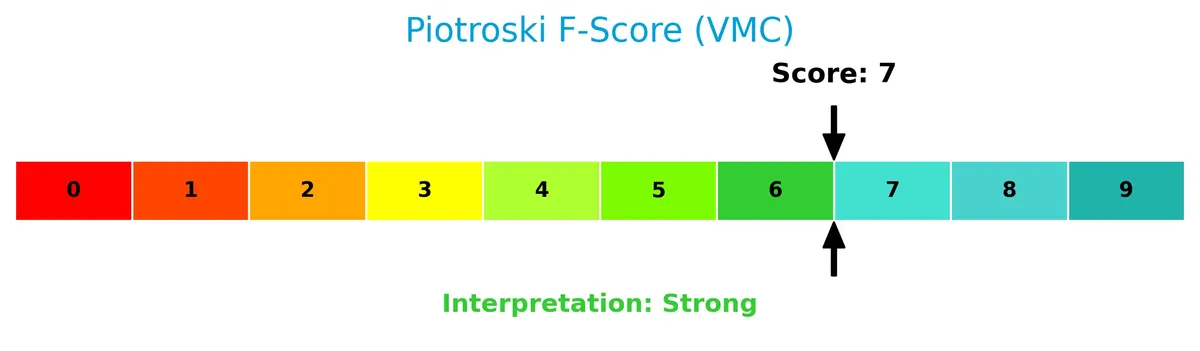
With a Piotroski Score of 7, VMC demonstrates strong financial health, suggesting effective profitability, leverage management, and operational efficiency.
Competitive Landscape & Sector Positioning
This analysis examines Vulcan Materials Company’s strategic positioning, revenue segments, products, and competitors within construction materials. I will evaluate if Vulcan holds a competitive advantage over its industry peers.
Strategic Positioning
Vulcan Materials Company concentrates on construction materials with a dominant focus on aggregates, generating $6.3B in 2025. It operates primarily in the US across the East, Gulf Coast, and West regions, with limited international exposure, reflecting a geographically concentrated strategy.
Revenue by Segment
The pie chart illustrates Vulcan Materials Company’s revenue distribution by product segments for the fiscal year 2025.
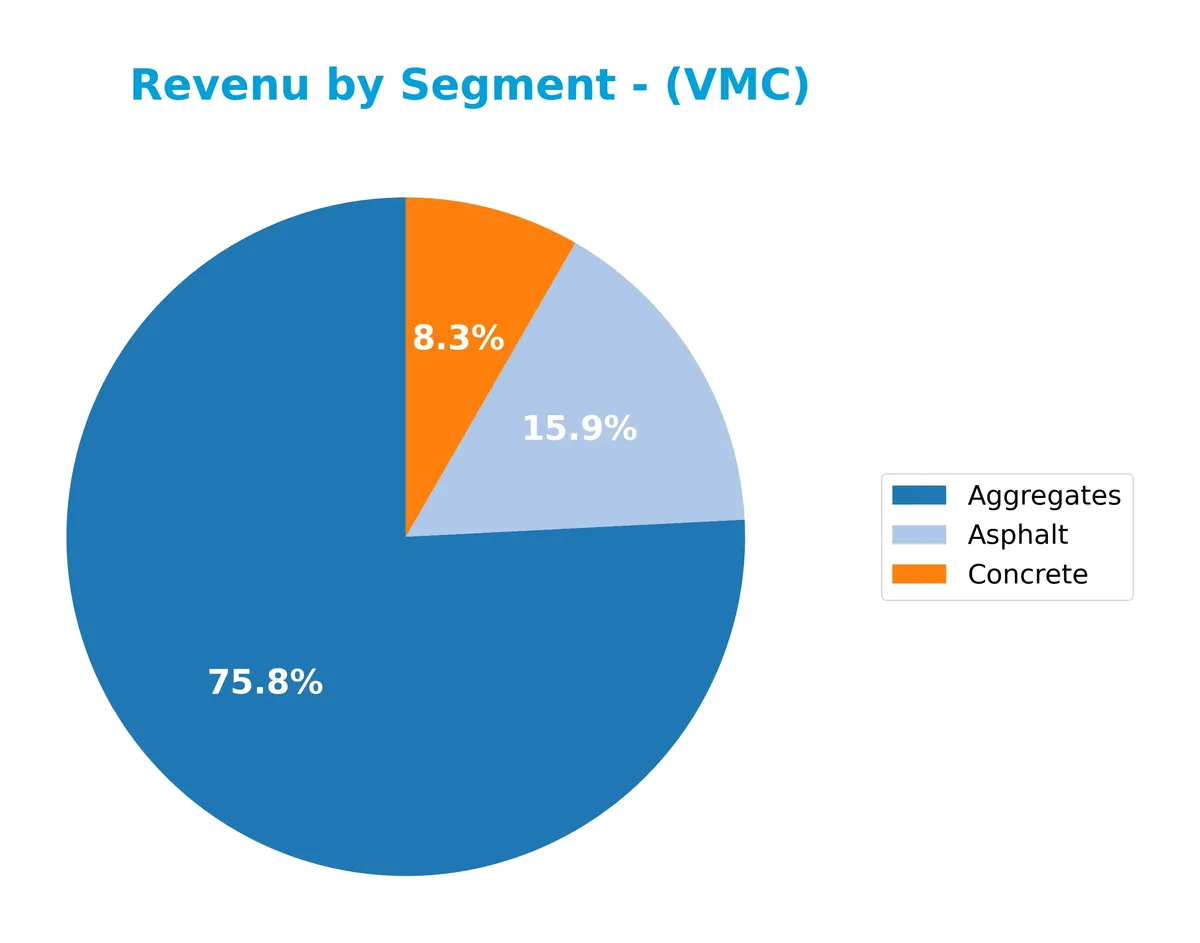
Aggregates dominate Vulcan’s revenue with $6.3B, reflecting steady growth since 2024. Asphalt and Concrete contribute $1.3B and $847M, respectively, showing moderate expansion. The 2025 figures highlight a strong concentration in Aggregates, signaling reliance on this core segment amid steady asphalt and concrete demand. This concentration poses concentration risk but also underscores Vulcan’s moat in aggregates.
Key Products & Brands
The following table lists Vulcan Materials Company’s principal products and their descriptions:
| Product | Description |
|---|---|
| Aggregates | Crushed stone, sand, gravel, and related products for construction and maintenance of infrastructure and buildings. |
| Asphalt | Asphalt mix and paving services in selected U.S. states including Alabama, Arizona, California, New Mexico, Tennessee, and Texas. |
| Concrete | Ready-mixed concrete supplied in multiple states including California, Maryland, New Jersey, New York, Oklahoma, Pennsylvania, Texas, Virginia, and Washington D.C. |
| Calcium | Calcium products used in animal feed, plastics, and water treatment industries. |
Vulcan’s revenue predominantly stems from its Aggregates segment, followed by Asphalt and Concrete. Calcium represents a smaller niche product line, serving industrial applications beyond construction.
Main Competitors
There are 3 main competitors in the Construction Materials industry; the table lists the top 3 leaders by market capitalization:
| Competitor | Market Cap. |
|---|---|
| CRH plc | 84.8B |
| Vulcan Materials Company | 38.7B |
| Martin Marietta Materials, Inc. | 38.3B |
Vulcan Materials Company ranks 2nd among its 3 competitors. Its market cap is 47.6% of the leader, CRH plc. Vulcan is below the average market cap of the top 10 in the sector but above the median. It stands 110.1% above its closest competitor below, showing a significant gap in scale.
Comparisons with competitors
Check out how we compare the company to its competitors:
Does VMC have a competitive advantage?
Vulcan Materials Company currently lacks a strong competitive advantage, as its ROIC remains below its WACC, indicating value destruction despite improving profitability. The company operates in a capital-intensive sector with modest economic moats.
Looking ahead, VMC’s growth in ready-mixed concrete and asphalt markets across multiple U.S. regions offers expansion opportunities. Its ongoing ROIC improvement suggests potential for future value creation if operational efficiencies continue.
SWOT Analysis
This SWOT analysis highlights key internal and external factors shaping Vulcan Materials Company’s strategic position in 2026.
Strengths
- strong market presence in U.S. aggregates
- favorable income growth with 61% net income increase over 5 years
- solid liquidity with current ratio of 2.69
Weaknesses
- ROIC below WACC indicates value destruction
- high valuation multiples with PE of 34.8 and PB of 4.4
- low dividend yield at 0.69% limits income appeal
Opportunities
- growing infrastructure spending drives demand
- expansion in high-growth Gulf Coast region
- rising profitability trend supports margin improvement
Threats
- economic sensitivity to construction cycles
- commodity price volatility impacts margins
- regulatory and environmental compliance costs
Vulcan’s robust market share and impressive earnings growth contrast with valuation and capital efficiency concerns. The company must leverage infrastructure opportunities while managing cyclical and regulatory risks carefully.
Stock Price Action Analysis
The following weekly chart illustrates Vulcan Materials Company’s stock price movements over the last 12 months, highlighting key volatility and trend shifts:
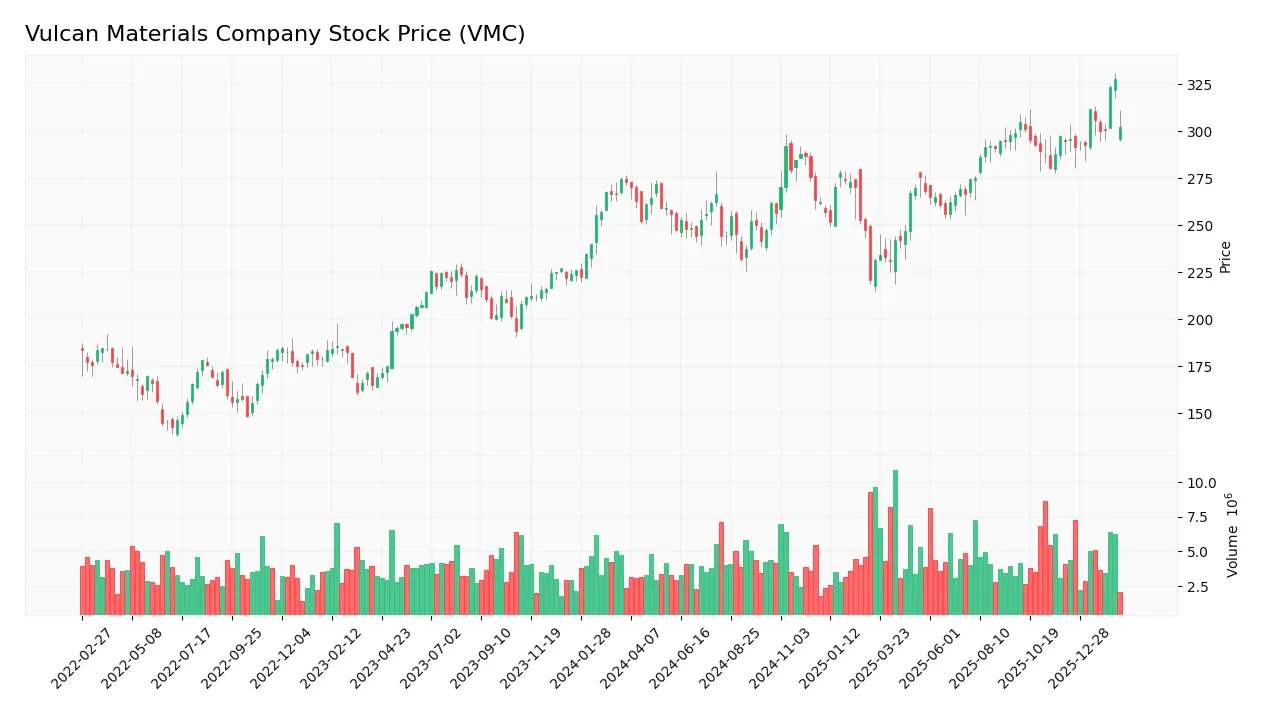
Trend Analysis
Over the past year, VMC’s stock price increased by 11.86%, indicating a bullish trend with accelerating momentum. The price ranged from a low of 220.9 to a high of 327.65, reflecting significant volatility with a standard deviation of 22.24%. Recent months show a continued upward slope of 2.35%, confirming sustained strength.
Volume Analysis
Trading volume is increasing, with buyers accounting for 55.49% of total activity year-to-date, signaling buyer-driven momentum. However, in the recent period from December 2025 to February 2026, seller volume slightly exceeded buyers at 51.77%, indicating neutral buyer behavior and balanced market participation.
Target Prices
Analysts show a confident target consensus for Vulcan Materials Company (VMC).
| Target Low | Target High | Consensus |
|---|---|---|
| 296 | 360 | 323 |
The target range suggests moderate upside potential. The consensus at 323 reflects steady confidence in VMC’s growth prospects.

Don’t Let Luck Decide Your Entry Point
Optimize your entry points with our advanced ProRealTime indicators. You’ll get efficient buy signals with precise price targets for maximum performance. Start outperforming now!
Analyst & Consumer Opinions
This section examines Vulcan Materials Company’s recent analyst grades and consumer feedback to gauge market sentiment.
Stock Grades
Here are the latest verified grades from leading equity research firms for Vulcan Materials Company (VMC):
| Grading Company | Action | New Grade | Date |
|---|---|---|---|
| Truist Securities | Maintain | Buy | 2026-02-19 |
| RBC Capital | Maintain | Sector Perform | 2026-02-18 |
| DA Davidson | Maintain | Neutral | 2026-02-18 |
| Wells Fargo | Maintain | Equal Weight | 2026-02-18 |
| Wells Fargo | Maintain | Equal Weight | 2026-01-29 |
| DA Davidson | Downgrade | Neutral | 2026-01-14 |
| Citigroup | Maintain | Buy | 2026-01-08 |
| DA Davidson | Maintain | Buy | 2025-11-04 |
| Citigroup | Maintain | Buy | 2025-11-03 |
| RBC Capital | Maintain | Sector Perform | 2025-10-31 |
The consensus shows a stable rating environment with most firms maintaining neutral to buy positions. DA Davidson’s recent downgrade to Neutral stands out, signaling some caution amid generally positive views.
Consumer Opinions
Vulcan Materials Company garners mixed but insightful feedback from its consumer base, reflecting real-world product and service impacts.
| Positive Reviews | Negative Reviews |
|---|---|
| Consistently high-quality construction materials | Delivery delays affecting project timelines |
| Strong customer support with knowledgeable staff | Pricing sometimes above competitors |
| Reliable supply chain even during market fluctuations | Limited product variety in certain regions |
Overall, consumers praise Vulcan’s material quality and support but flag logistical delays and pricing as recurrent issues. These points suggest strengths in core product excellence but room for operational improvements.
Risk Analysis
The following table summarizes key risks Vulcan Materials Company faces, including probability and potential impact:
| Category | Description | Probability | Impact |
|---|---|---|---|
| Market Volatility | Beta of 1.055 indicates sensitivity to market swings affecting stock price | Medium | Medium |
| Valuation Risk | High P/E (34.8) and P/B (4.41) ratios suggest potential overvaluation | High | High |
| Leverage Risk | Debt-to-equity ratio of 0.63 signals moderate leverage | Medium | Medium |
| Operational Risk | Unfavorable asset turnover (0.48) may limit capital efficiency | Medium | Medium |
| Dividend Risk | Low dividend yield (0.69%) could disappoint income-focused investors | Low | Low |
| Economic Cycles | Construction materials demand sensitive to economic downturns | High | High |
I identify valuation and economic cycle risks as the most pressing. The stock trades at a premium compared to industry norms despite modest returns on invested capital. Additionally, demand for construction aggregates fluctuates sharply with economic cycles, risking revenue volatility. The company’s Altman Z-Score of 4.39 places it safely above bankruptcy concerns, but investors must weigh valuation against cyclical exposure carefully.
Should You Buy Vulcan Materials Company?
Vulcan Materials appears to be in a safe zone with a strong profitability trend despite a slightly unfavorable moat indicating value erosion. While its leverage profile raises caution, the overall B rating suggests a moderately favorable operational efficiency and value creation.
Strength & Efficiency Pillars
Vulcan Materials Company delivers solid operational performance with a net margin of 13.63% and an EBIT margin of 22.97%, reflecting effective cost control and pricing power. The company’s return on equity stands at 12.68%, demonstrating moderate shareholder value generation. However, its ROIC of 8.02% slightly trails the WACC of 8.39%, indicating it is currently shedding value despite a positive ROIC growth trend of 33%. This dynamic highlights improving profitability but a need for better capital allocation to create long-term value.
Weaknesses and Drawbacks
Vulcan faces notable valuation and efficiency challenges. Its P/E ratio of 34.81 and P/B of 4.41 suggest a premium market valuation, increasing downside risk if earnings disappoint. Asset turnover (0.48) and fixed asset turnover (0.53) are weak, signaling underutilization of assets. Dividend yield is low at 0.69%, limiting income appeal. Although leverage metrics like debt-to-equity (0.63) are neutral and liquidity ratios remain strong, these valuation premiums and operational inefficiencies could pressure shares if growth slows.
Our Final Verdict about Vulcan Materials Company
Vulcan Materials combines robust profitability with a strong Piotroski score of 7 and a safe Altman Z-Score of 4.39, indicating solid financial health. Despite a bullish long-term trend, recent buyer dominance is neutral at 48.23%, suggesting market caution. The profile may appear attractive for investors seeking operational strength, but the premium valuation and capital efficiency concerns suggest a cautious, wait-and-see stance might be prudent before committing new capital.
Disclaimer: This content is for informational purposes only and does not constitute financial, investment, or other professional advice. Investing in financial markets involves a significant risk of loss, and past performance is not indicative of future results.
Additional Resources
- Vulcan Materials Stock Outlook: Is Wall Street Bullish or Bearish? – Yahoo Finance (Feb 18, 2026)
- Why Vulcan Materials (VMC) Shares Are Trading Lower Today – Finviz (Feb 18, 2026)
- Vulcan Materials slides after Q4 earnings miss and softer-than-expected 2026 outlook – Quiver Quantitative (Feb 17, 2026)
- Earnings Summary: Highlights of Vulcan Materials Company’s Q4 FY25 report – AlphaStreet News (Feb 17, 2026)
- Assessing Vulcan Materials (VMC) Valuation After Recent Share Price Weakness And Strong Longer Term Gains – Sahm (Feb 17, 2026)
For more information about Vulcan Materials Company, please visit the official website: vulcanmaterials.com