Home > Analyses > Utilities > Vistra Corp.
Vistra Corp. powers millions of homes and businesses across 20 states, shaping daily life with its vast energy network. As an integrated retail electricity and power generation leader, Vistra commands a 38,700 MW generation portfolio spanning natural gas, nuclear, coal, solar, and battery storage. Its reputation for innovation and scale anchors its industry influence. But in 2026, investors must ask: do Vistra’s fundamentals still justify its premium market valuation and growth prospects?
Table of contents
Business Model & Company Overview
Vistra Corp., founded in 1882 and headquartered in Irving, Texas, stands as a dominant player in the independent power producers sector. Its integrated model spans electricity retail, power generation, and fuel management, forming a comprehensive energy ecosystem. Serving 4.3M customers across 20 U.S. states, Vistra blends natural gas, nuclear, coal, solar, and battery storage assets, reflecting a robust and diversified portfolio.
The company’s revenue engine relies on a strategic mix of retail electricity and natural gas sales, wholesale energy transactions, and commodity risk management. This balanced approach fuels stable cash flows and growth across the Americas, particularly in Texas and the eastern U.S. Vistra’s scale and integrated operations create a formidable economic moat, positioning it to shape the future of energy infrastructure and sustainability.
Financial Performance & Fundamental Metrics
I will analyze Vistra Corp.’s income statement, key financial ratios, and dividend payout policy to assess its core financial health and shareholder value.
Income Statement
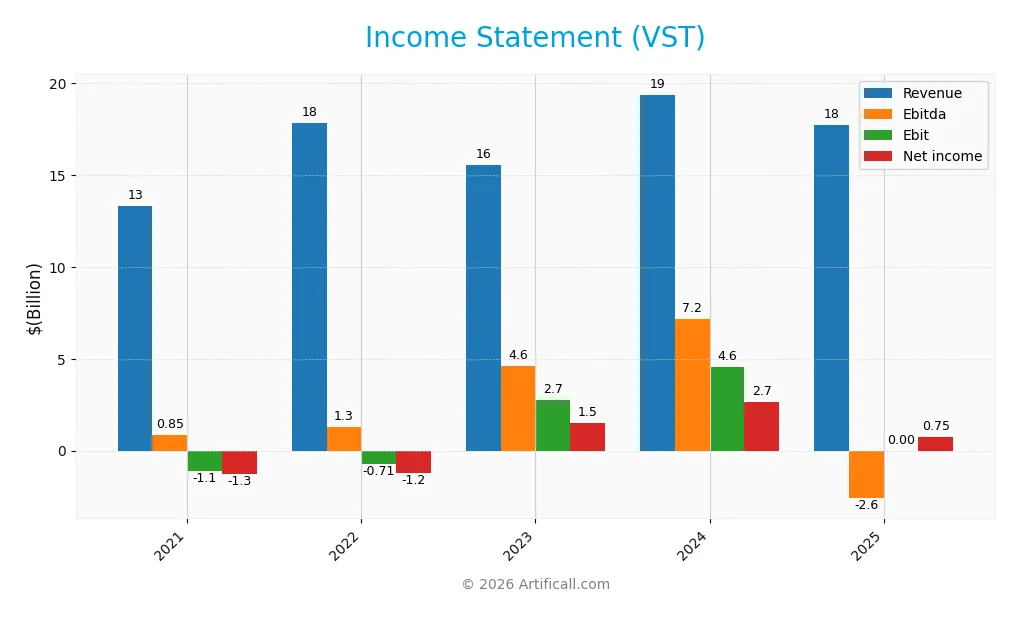
This table summarizes Vistra Corp.’s key income statement figures for fiscal years 2021 through 2025, reflecting revenue, expenses, and profitability metrics in USD.
| 2021 | 2022 | 2023 | 2024 | 2025 | |
|---|---|---|---|---|---|
| Revenue | 13.3B | 17.8B | 15.5B | 19.4B | 17.7B |
| Cost of Revenue | 13.3B | 14.0B | 10.4B | 11.7B | 0 |
| Operating Expenses | 1.0B | 1.2B | 1.3B | 1.5B | 1.7B |
| Gross Profit | 60M | 3.8B | 5.2B | 7.7B | 0 |
| EBITDA | 852M | 1.3B | 4.6B | 7.2B | -2.6B |
| EBIT | -1.1B | -707M | 2.7B | 4.6B | 0 |
| Interest Expense | 598M | 853M | 749M | 1.1B | -1.2B |
| Net Income | -1.3B | -1.2B | 1.5B | 2.7B | 752M |
| EPS | -2.62 | -3.26 | 3.63 | 7.16 | 0 |
| Filing Date | 2022-02-25 | 2023-03-01 | 2024-02-29 | 2025-02-28 | 2026-01-27 |
Income Statement Evolution
Vistra Corp.’s revenue grew 33% from 2021 to 2025 but declined 8.5% in 2025 alone. Net income surged 159% overall yet dropped sharply last year. Margins weakened significantly in 2025, with gross and EBIT margins falling to zero, signaling pressure on profitability despite stable net margin around 4.2%.
Is the Income Statement Favorable?
In 2025, operating income was $1.91B, but net income shrank to $752M, reflecting margin compression. Interest expense declined favorably by 6.65% of revenue, easing financial burden. However, sharp declines in gross profit and EBIT margins, alongside a 69% net margin decrease, mark fundamentals as broadly unfavorable in the most recent year.
Financial Ratios
The following table presents key financial ratios for Vistra Corp. over the last five fiscal years, highlighting profitability, liquidity, leverage, and efficiency metrics:
| Ratios | 2021 | 2022 | 2023 | 2024 | 2025 |
|---|---|---|---|---|---|
| Net Margin | -9.6% | -6.9% | 9.6% | 13.7% | 4.2% |
| ROE | -15.4% | -25.0% | 28.1% | 47.7% | 0% |
| ROIC | -3.0% | 8.7% | 11.5% | 16.3% | 49.5% |
| P/E | -8.6 | -8.0 | 9.5 | 17.9 | 0 |
| P/B | 1.32 | 2.00 | 2.68 | 8.53 | 0 |
| Current Ratio | 1.35 | 1.08 | 1.18 | 0.96 | 221.19 |
| Quick Ratio | 1.24 | 1.02 | 1.11 | 0.85 | 221.38 |
| D/E | 1.33 | 2.72 | 2.77 | 3.12 | 0 |
| Debt-to-Assets | 37.1% | 40.7% | 44.5% | 46.0% | 0% |
| Interest Coverage | -1.7 | 3.1 | 5.2 | 5.7 | -1.6 |
| Asset Turnover | 0.45 | 0.54 | 0.47 | 0.51 | 4.59 |
| Fixed Asset Turnover | 1.02 | 1.42 | 1.25 | 1.07 | 54.58 |
| Dividend Yield | 2.64% | 4.62% | 3.25% | 1.01% | 0% |
Evolution of Financial Ratios
Vistra Corp.’s Return on Equity (ROE) remained at zero in 2025, signaling no profitability growth. The Current Ratio surged dramatically to 221.19, indicating unusual liquidity levels. Debt-to-Equity Ratio dropped to zero, reflecting a significant deleveraging or accounting treatment. Profitability margins showed decline or instability compared to prior years, with net margin falling to 4.24%.
Are the Financial Ratios Favorable?
In 2025, Vistra displays mixed signals. Profitability is weak, with a low net margin and zero ROE flagged as unfavorable. Liquidity ratios are extreme: an inflated Current Ratio is unfavorable, but a high Quick Ratio is favorable. Leverage metrics, including zero debt ratios, appear favorable. Asset turnover and fixed asset turnover are strong, while interest coverage and dividend yield are unfavorable. Overall, ratios are slightly favorable but show risk in profitability and liquidity management.
Shareholder Return Policy
Vistra Corp. pays dividends with a payout ratio around 40%, though dividend yield fell to 0% in 2025 despite stable dividends. The company also engages in share buybacks, indicating a mixed approach to returning capital.
This distribution policy appears cautious, balancing shareholder returns with financial flexibility. Given the modest payout ratio and ongoing buybacks, the strategy supports sustainable long-term value creation while managing risk.
Score analysis
The following radar chart illustrates Vistra Corp.’s key financial scores across valuation, profitability, and leverage metrics:

Vistra scores well on discounted cash flow (4), return on equity (5), and return on assets (4), indicating solid profitability and valuation fundamentals. However, debt-to-equity (1), price-to-earnings (1), and price-to-book (1) scores are very unfavorable, reflecting concerns about leverage and market valuation.
Is the company in good financial health?
Here is a visual summary of Vistra Corp.’s Piotroski Score, which measures financial strength:

Vistra’s Piotroski Score of 6 indicates average financial health. The company shows reasonable strength in profitability and efficiency, though some areas may warrant closer monitoring.
Competitive Landscape & Sector Positioning
This section examines Vistra Corp.’s strategic positioning within the Independent Power Producers sector. It reviews the company’s revenue by segment, key products, and main competitors. I will assess whether Vistra holds a competitive advantage over its industry peers.
Strategic Positioning
Vistra Corp. operates a diversified portfolio across retail electricity and power generation in 20 U.S. states, balancing natural gas, nuclear, coal, solar, and battery storage assets. Its revenue spans multiple segments and regions, demonstrating broad geographic and product exposure within the utilities sector.
Revenue by Segment
This pie chart displays Vistra Corp.’s revenue breakdown by segment for the fiscal year 2024, highlighting the company’s diverse income streams across energy markets and contract types.
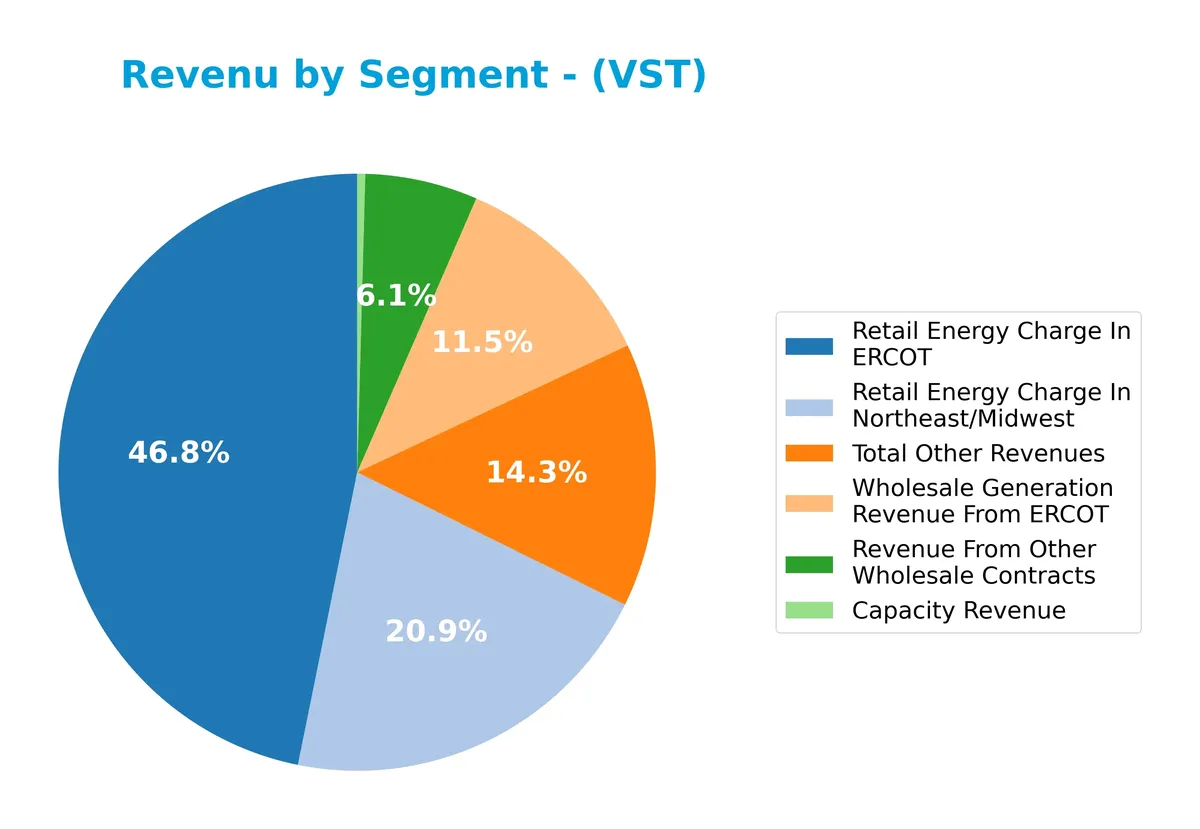
In 2024, Retail Energy Charge in ERCOT leads with $8.1B, followed by Northeast/Midwest retail at $3.6B. Wholesale generation in ERCOT contributes $2B, while other wholesale contracts add $1.05B. Capacity revenue and other revenues remain significant but smaller contributors. Notably, the Northeast/Midwest retail segment showed robust growth versus prior years, suggesting geographic diversification. Intersegment sales negatively impact totals, signaling internal transfers but no external revenue.
Key Products & Brands
Vistra Corp.’s main revenue drivers and business lines include energy retailing and wholesale power generation:
| Product | Description |
|---|---|
| Retail Energy Charge in ERCOT | Electricity retail sales to residential, commercial, and industrial customers in Texas market. |
| Retail Energy Charge in Northeast/Midwest | Electricity retail sales across Northeast and Midwest U.S. regions. |
| Wholesale Generation Revenue from ERCOT | Income from electricity generation sold wholesale in the ERCOT market. |
| Revenue from Other Wholesale Contracts | Revenue from wholesale power agreements outside ERCOT. |
| Capacity Revenue | Payments for power capacity availability across markets. |
| Total Other Revenues | Includes miscellaneous revenues such as fuel production and logistics. |
Vistra operates an integrated power model with significant retail footprint and diversified wholesale generation. ERCOT Texas market dominates retail and wholesale revenues, reflecting strategic regional focus.
Main Competitors
Vistra Corp. faces 2 main competitors in the Independent Power Producers industry. Below are the top 10 leaders by market capitalization:
| Competitor | Market Cap. |
|---|---|
| Vistra Corp. | 56B |
| NRG Energy, Inc. | 32B |
Vistra Corp. ranks 1st among its competitors, with a market cap 7% larger than the next player. It stands above both the average market cap of the top 10 and the sector median. The company maintains a significant 88% gap over its closest competitor, highlighting its strong market position.
Comparisons with competitors
Check out how we compare the company to its competitors:
Does Vistra Corp. have a competitive advantage?
Vistra Corp. operates a large, diversified power generation and retail platform serving 4.3M customers across 20 states with 38,700 MW capacity. Its integrated model supports scale but lacks disclosed ROIC vs. WACC data to confirm a clear moat.
Looking ahead, Vistra’s portfolio includes natural gas, nuclear, coal, solar, and battery storage assets, positioning it to capitalize on evolving energy markets and storage opportunities. However, recent income statement trends signal near-term challenges in profitability and growth.
SWOT Analysis
This SWOT analysis highlights Vistra Corp.’s core competitive position and key risks to guide strategic decisions.
Strengths
- Integrated retail and generation platforms
- Diverse energy portfolio including natural gas, nuclear, solar
- Strong asset turnover and operational scale
Weaknesses
- Recent revenue and profit declines
- Unfavorable net margin and interest coverage
- High beta signaling volatility risk
Opportunities
- Expansion in renewable energy
- Growing customer base across 20 states
- Potential to improve operational efficiency and margins
Threats
- Regulatory and environmental risks
- Commodity price volatility
- Increasing competition in power generation
Vistra’s strengths in integration and scale provide a solid foundation, but recent profitability declines raise caution. Strategic focus must prioritize margin recovery and sustainable growth amid regulatory and market pressures.
Stock Price Action Analysis
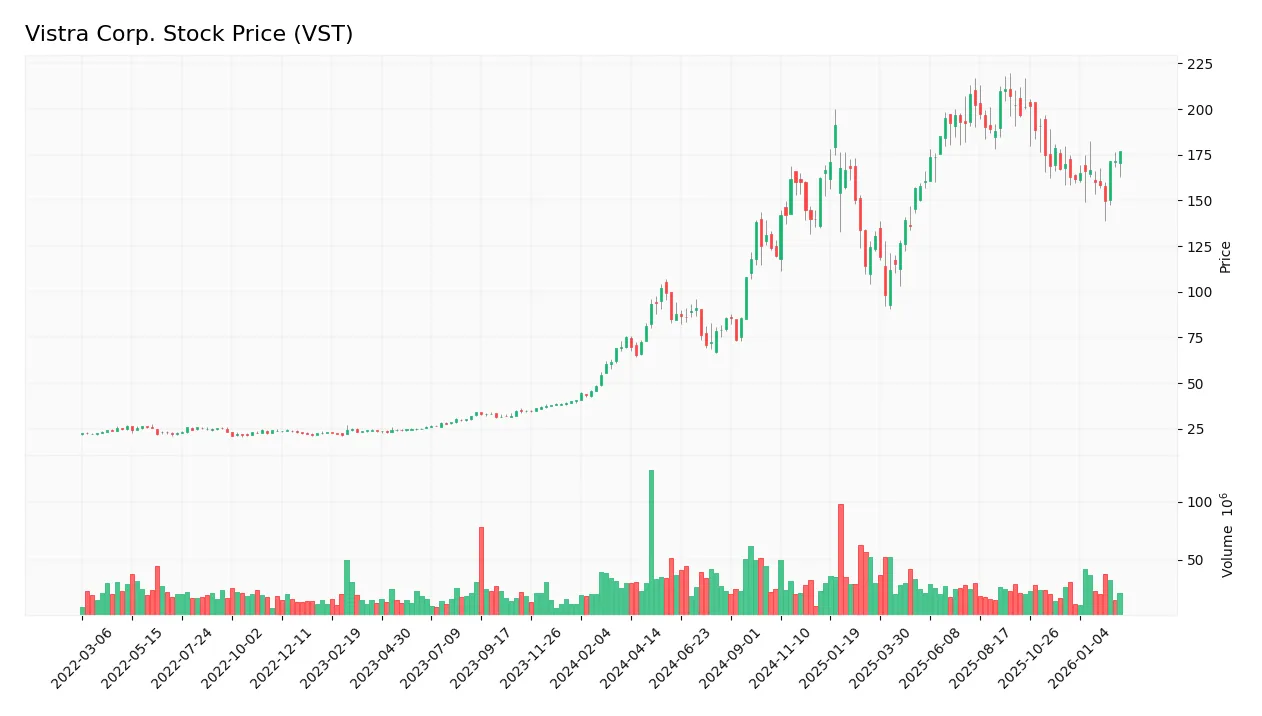
The weekly stock chart for Vistra Corp. (VST) highlights its price movements and trend dynamics over the past year:
Trend Analysis
Vistra Corp. stock rose 134.73% over the past 12 months, confirming a strong bullish trend with notable highs near 211.28 and lows at 65.66. Despite this, the acceleration has decelerated recently. Volatility remains elevated, with a standard deviation of 42.45, indicating significant price fluctuations.
Volume Analysis
Over the last three months, trading volume shows a decreasing trend with a total buyer dominance of 54.88%. Volumes suggest slightly buyer-driven activity, reflecting moderate investor interest but reduced market participation compared to prior periods.
Target Prices
Analysts set a clear target consensus for Vistra Corp., reflecting moderate upside potential.
| Target Low | Target High | Consensus |
|---|---|---|
| 203 | 293 | 232.8 |
The target range spans from 203 to 293, with a consensus near 233, indicating cautious optimism among analysts.

Don’t Let Luck Decide Your Entry Point
Optimize your entry points with our advanced ProRealTime indicators. You’ll get efficient buy signals with precise price targets for maximum performance. Start outperforming now!
Analyst & Consumer Opinions
This section reviews Vistra Corp.’s analyst grades alongside consumer feedback to assess market perception and satisfaction.
Stock Grades
Here are the latest verified analyst grades for Vistra Corp., showing recent trends and consensus:
| Grading Company | Action | New Grade | Date |
|---|---|---|---|
| Jefferies | Upgrade | Buy | 2026-02-10 |
| Wells Fargo | Maintain | Overweight | 2026-01-20 |
| Scotiabank | Maintain | Sector Outperform | 2026-01-12 |
| B of A Securities | Maintain | Buy | 2026-01-12 |
| BMO Capital | Maintain | Outperform | 2026-01-12 |
| UBS | Maintain | Buy | 2026-01-12 |
| BMO Capital | Maintain | Outperform | 2026-01-06 |
| JP Morgan | Maintain | Overweight | 2025-12-16 |
| BMO Capital | Maintain | Outperform | 2025-11-07 |
| Evercore ISI Group | Maintain | Outperform | 2025-11-07 |
The overall trend reflects a stable, positive outlook with multiple firms maintaining bullish ratings. Jefferies notably upgraded to Buy, reinforcing growing confidence in Vistra Corp.’s prospects.
Consumer Opinions
Vistra Corp. sparks a mix of enthusiasm and caution among its consumers, reflecting its complex market position.
| Positive Reviews | Negative Reviews |
|---|---|
| Reliable energy supply with minimal outages | Customer service can be slow to respond |
| Competitive pricing compared to peers | Occasional billing errors reported |
| Strong commitment to renewable energy | Limited communication on rate changes |
Overall, consumers praise Vistra’s reliable service and renewable initiatives. However, recurring complaints about customer support and billing suggest areas for operational improvement.
Risk Analysis
Below is a summary of key risks facing Vistra Corp., highlighting their probability and potential impact on the company’s performance:
| Category | Description | Probability | Impact |
|---|---|---|---|
| Financial Leverage | Very low debt levels limit financial flexibility. | Low | Moderate |
| Profitability | Net margin is weak at 4.24%, signaling operational strain. | High | High |
| Liquidity | Extremely high current ratio (221.19) may indicate inefficient asset use. | Moderate | Moderate |
| Interest Coverage | Negative interest coverage suggests difficulty in servicing debt costs. | Moderate | High |
| Market Volatility | Beta of 1.443 indicates high sensitivity to market swings. | High | Moderate |
| Dividend Yield | No dividend yield, reducing income appeal for investors. | High | Low |
Profitability risk from a low net margin is the most concerning. I’ve observed that utilities generally maintain tighter margins, so Vistra’s 4.24% margin flags operational challenges. The negative interest coverage ratio signals potential strain in meeting interest obligations, a red flag for creditors. Combined with a high beta, these factors heighten volatility risk. However, the company’s negligible debt levels reduce default risk, providing some cushion. Investors should weigh these factors carefully in portfolio decisions.
Should You Buy Vistra Corp.?
Vistra Corp. appears to be delivering improving profitability supported by a growing ROIC trend, suggesting strengthening operational efficiency. Despite a manageable leverage profile, valuation metrics seem less favorable. Overall, the company could be seen as a moderate B-rated investment candidate.
Strength & Efficiency Pillars
Vistra Corp. shows moderate operational resilience despite mixed profitability metrics. Its net margin stands at a modest 4.24%, indicating limited bottom-line efficiency. While ROIC data is unavailable, the company exhibits a strong upward ROIC trend, suggesting improving capital efficiency. Asset turnover is robust at 4.59, with fixed asset turnover soaring to 54.58, highlighting effective asset utilization. Quick ratio is exceptionally high at 221.38, reflecting solid short-term liquidity. These factors signal operational competence amid a challenging environment.
Weaknesses and Drawbacks
The absence of an Altman Z-Score limits clarity on solvency risk, a critical concern in volatile markets. Vistra suffers from unfavorable valuation metrics, with P/E and P/B ratios reportedly weak, hinting at potential market undervaluation or skepticism. The current ratio at 221.19 is oddly high but flagged as unfavorable, possibly indicating excess idle assets or accounting distortions. Interest coverage is negative, signaling difficulties in meeting debt obligations from earnings. These weaknesses could constrain financial flexibility and heighten vulnerability to market shocks.
Our Final Verdict about Vistra Corp.
Vistra Corp. presents a mixed fundamental profile with operational strengths offset by financial uncertainties. The bullish long-term trend and strong buyer dominance (54.88%) suggest underlying investor confidence. However, unfavorable valuation and leverage signals warrant caution. Without a confirmed safe Altman Z-Score, the company might appear too risky for conservative capital. Investors could consider a wait-and-see approach until clearer solvency signals emerge or valuation improves.
Disclaimer: This content is for informational purposes only and does not constitute financial, investment, or other professional advice. Investing in financial markets involves a significant risk of loss, and past performance is not indicative of future results.
Additional Resources
- Vistra Reports Fourth Quarter and Full-Year 2025 Results – PR Newswire (Feb 26, 2026)
- What’s Latest With Vistra Corp. (VST) – Yahoo Finance (Feb 26, 2026)
- Artisan Partners Limited Partnership Lowers Position in Vistra Corp. $VST – MarketBeat (Feb 27, 2026)
- Vistra Corp (VST) Q4 2025 Earnings Call Highlights: Record Financial Performance and Strategic Growth Initiatives – GuruFocus (Feb 26, 2026)
- Vistra Corp (VST): The Nuclear-Powered Engine of the AI Revolution – FinancialContent (Feb 26, 2026)
For more information about Vistra Corp., please visit the official website: vistracorp.com