Home > Analyses > Financial Services > Visa Inc.
Visa Inc. powers the seamless flow of digital payments that millions rely on daily, shaping the global financial landscape with unmatched efficiency. As a dominant force in the financial credit services sector, Visa’s VisaNet platform and diverse card products have set the standard for secure, swift transactions worldwide. Renowned for innovation and market influence, Visa continues to expand its reach. But as competition intensifies, the key question remains: does Visa’s growth potential still justify its premium valuation?

Table of contents
Business Model & Company Overview
Visa Inc., founded in 1958 and headquartered in San Francisco, CA, stands as a dominant player in the financial credit services industry. It operates a comprehensive payments ecosystem that connects consumers, merchants, financial institutions, and governments through its VisaNet transaction processing network. The company’s portfolio spans card products, platforms, and value-added services under well-known brands like Visa, Visa Electron, Interlink, VPAY, and PLUS, forming a cohesive mission to facilitate seamless digital payments worldwide.
Visa generates value primarily through transaction processing fees across its extensive global footprint, balancing its revenue between hardware-compatible card offerings and software-driven payment platforms. Its strategic agreements, such as with Ooredoo in Qatar, highlight its commitment to enhancing payment experiences across the Americas, Europe, and Asia. This global scale and integrated service model create a powerful economic moat, reinforcing Visa’s role as a key architect in the future of digital payments.
Financial Performance & Fundamental Metrics
In this section, I analyze Visa Inc.’s income statement, key financial ratios, and dividend payout policy to provide a clear view of its fundamental health.
Income Statement
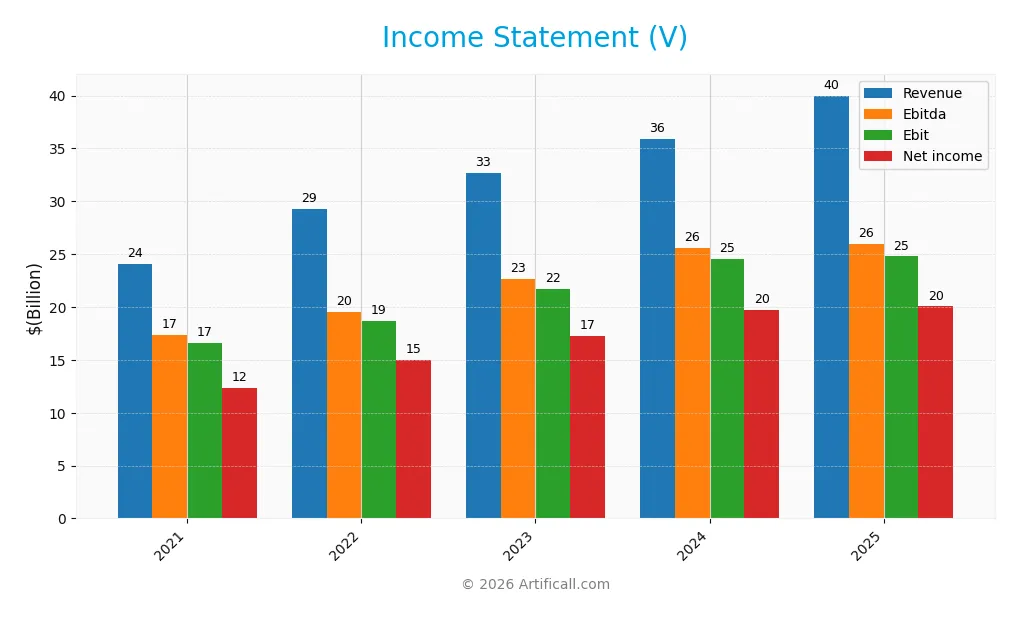
The table below summarizes Visa Inc.’s key income statement metrics for fiscal years 2021 through 2025 in USD.
| 2021 | 2022 | 2023 | 2024 | 2025 | |
|---|---|---|---|---|---|
| Revenue | 24.1B | 29.3B | 32.7B | 35.9B | 40.0B |
| Cost of Revenue | 5.0B | 5.7B | 6.6B | 7.0B | 7.9B |
| Operating Expenses | 3.3B | 4.8B | 5.1B | 5.3B | 8.2B |
| Gross Profit | 19.1B | 23.6B | 26.1B | 28.9B | 32.1B |
| EBITDA | 17.4B | 19.5B | 22.6B | 25.6B | 26.0B |
| EBIT | 16.6B | 18.7B | 21.7B | 24.6B | 24.8B |
| Interest Expense | 513M | 538M | 644M | 641M | 589M |
| Net Income | 12.3B | 14.9B | 17.3B | 19.7B | 20.1B |
| EPS | 5.63 | 7.01 | 8.29 | 9.74 | 10.22 |
| Filing Date | 2021-11-18 | 2022-11-16 | 2023-11-15 | 2024-11-13 | 2025-11-06 |
Income Statement Evolution
Visa Inc. demonstrated consistent revenue growth from 24.1B in 2021 to 40B in 2025, a 65.94% increase over five years. Net income rose 62.93% to 20.06B in 2025. Gross margin remained favorable at 80.36%, while EBIT margin stood strong at 61.96%. However, net margin slightly declined by 1.82% over the period, indicating some pressure on profitability despite expanding top-line and bottom-line figures.
Is the Income Statement Favorable?
The 2025 income statement shows solid fundamentals with revenue growing 11.34% year-over-year to 40B and net income increasing 1.6% to 20.06B. Margins are generally favorable: gross margin at 80.36%, EBIT margin near 62%, and net margin at 50.14%. Earnings per share rose 4.83%, though net margin contracted 8.75% year-over-year. Overall, 71.43% of income statement metrics are favorable, supporting a generally favorable evaluation.
Financial Ratios
Below is a summary table of key financial ratios for Visa Inc. over the last five fiscal years, illustrating profitability, valuation, liquidity, leverage, and operational efficiency:
| Ratios | 2021 | 2022 | 2023 | 2024 | 2025 |
|---|---|---|---|---|---|
| Net Margin | 51% | 51% | 53% | 55% | 50% |
| ROE | 33% | 42% | 45% | 50% | 53% |
| ROIC | 18% | 23% | 26% | 29% | 28% |
| P/E | 39 | 25 | 28 | 28 | 33 |
| P/B | 13 | 11 | 12 | 14 | 17 |
| Current Ratio | 1.75 | 1.45 | 1.45 | 1.28 | 1.08 |
| Quick Ratio | 1.75 | 1.45 | 1.45 | 1.28 | 1.08 |
| D/E | 0.56 | 0.63 | 0.54 | 0.53 | 0.66 |
| Debt-to-Assets | 25% | 26% | 23% | 22% | 25% |
| Interest Coverage | 31 | 35 | 33 | 37 | 41 |
| Asset Turnover | 0.29 | 0.34 | 0.36 | 0.38 | 0.40 |
| Fixed Asset Turnover | 8.88 | 9.09 | 9.53 | 9.39 | 9.44 |
| Dividend Yield | 0.59% | 0.84% | 0.78% | 0.76% | 0.70% |
Evolution of Financial Ratios
Visa Inc.’s Return on Equity (ROE) showed a steady increase from around 33% in 2021 to over 52% in 2025, indicating improving profitability. The Current Ratio declined from approximately 1.75 to 1.08 during the same period, reflecting a reduction in short-term liquidity. The Debt-to-Equity Ratio fluctuated mildly but remained around 0.5 to 0.66, signaling stable leverage management.
Are the Financial Ratios Favorable?
In 2025, Visa’s profitability ratios, including a 50.14% net margin and 52.91% ROE, are favorable, supported by solid returns on invested capital (28.36%) and a low weighted average cost of capital (7.53%). Liquidity ratios show a neutral to favorable stance, with a 1.08 current ratio and quick ratio, while leverage remains neutral with a debt-to-equity of 0.66 and a favorable debt-to-assets ratio of 25.27%. However, market valuation metrics like price-to-earnings (33.05) and price-to-book (17.49) ratios are unfavorable. Overall, 57% of ratios are favorable, 29% unfavorable, and 14% neutral, leading to a generally favorable financial profile.
Shareholder Return Policy
Visa Inc. maintains a consistent dividend policy with a payout ratio around 21-23% and a dividend yield near 0.7%. Dividends per share have steadily increased from $1.31 in 2021 to $2.39 in 2025, supported by strong free cash flow coverage and operating margins above 50%. The company also engages in share buybacks, enhancing shareholder returns alongside dividends.
This balanced distribution approach appears sustainable, given Visa’s robust profitability and cash flow metrics. The moderate payout ratio and buyback activity support long-term value creation without compromising financial flexibility or growth investments. Risks from excessive payouts or repurchases seem limited under current financial conditions.
Score analysis
The following radar chart presents Visa Inc.’s financial scores across multiple key metrics for a comprehensive overview:
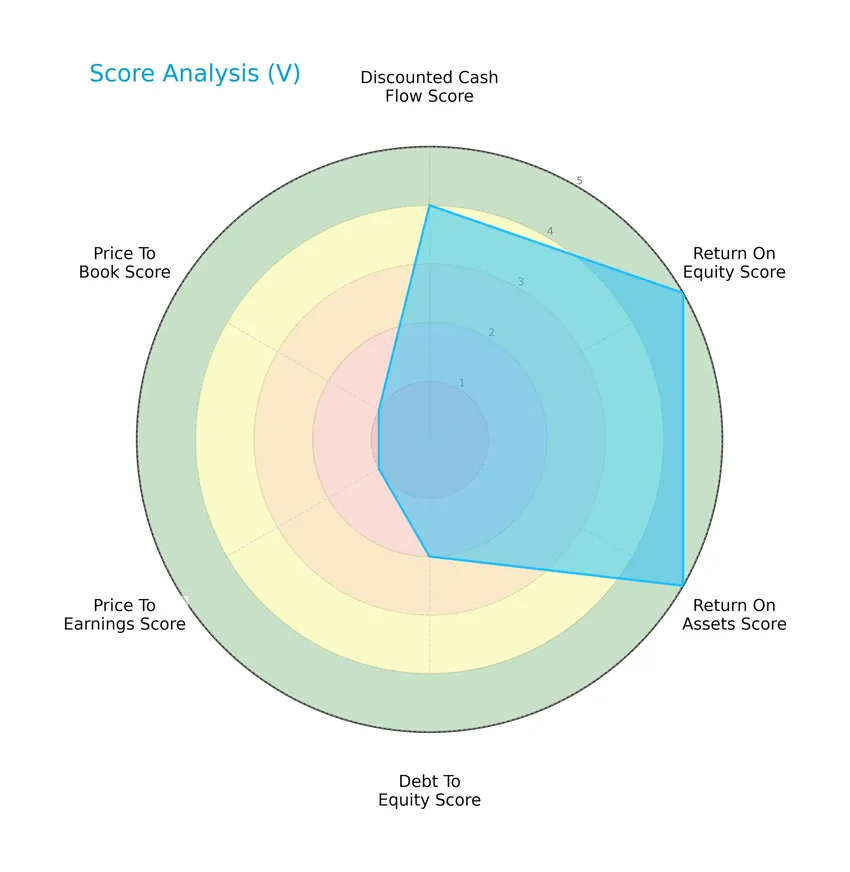
Visa Inc. shows strong profitability with very favorable return on equity and return on assets scores of 5 each. Its discounted cash flow score is favorable at 4, while debt to equity stands at a moderate 2. Valuation metrics price to earnings and price to book are very unfavorable, both scoring 1.
Analysis of the company’s bankruptcy risk
Visa Inc.’s Altman Z-Score places it firmly in the safe zone, indicating a low risk of bankruptcy based on its financial ratios:

Is the company in good financial health?
The Piotroski Score diagram below illustrates Visa Inc.’s strong financial health and operational performance:

With a Piotroski Score of 8, Visa Inc. demonstrates very strong financial health, reflecting solid profitability, efficient asset use, and conservative leverage, which supports its investment appeal in terms of financial strength.
Competitive Landscape & Sector Positioning
This sector analysis will explore Visa Inc.’s strategic positioning, revenue by segment, key products, main competitors, competitive advantages, and SWOT analysis. I will assess whether Visa holds a competitive advantage over its peers in the financial services industry.
Strategic Positioning
Visa Inc. maintains a concentrated product portfolio focused on payments technology, including transaction processing, card products, and value-added services. Geographically, it demonstrates diversification, with significant revenue growth outside the US, reaching $24.4B in 2025 versus $15.6B domestically, reflecting a strong global presence.
Revenue by Segment
This pie chart illustrates Visa Inc.’s revenue distribution by segment for the fiscal year 2025, highlighting the company’s main sources of income.
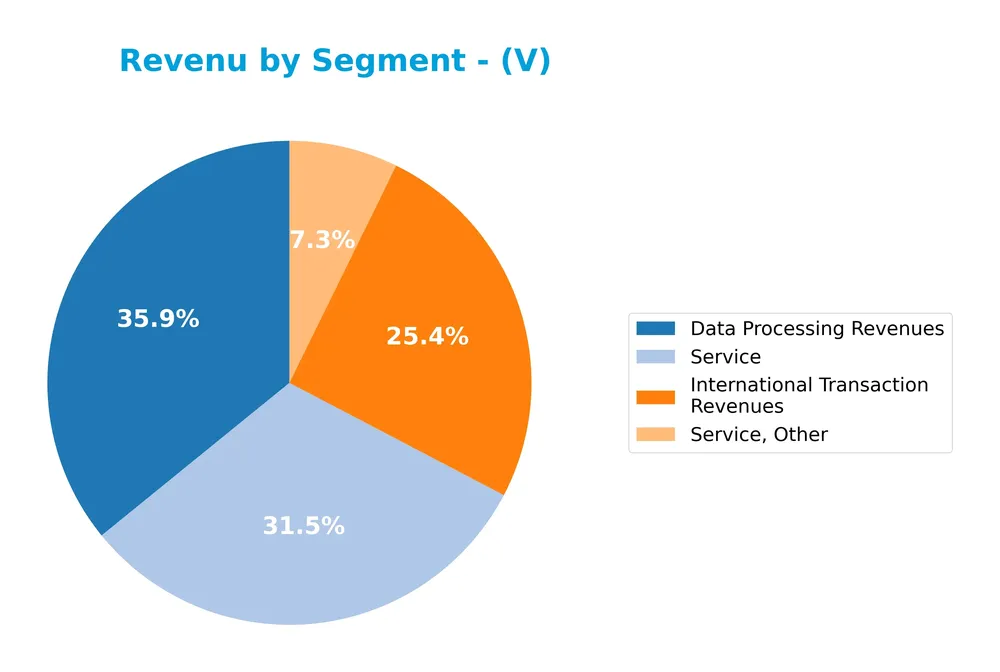
In 2025, Data Processing Revenues remain the largest contributor at 20B, followed by Service revenues at 17.5B and International Transaction Revenues at 14.2B. The Service, Other segment adds 4.1B, showing steady growth over recent years. Despite increasing Client Incentives deductions (-15.8B), Visa’s core segments exhibit consistent expansion, though the rising incentives pose a concentration risk that investors should monitor.
Key Products & Brands
The following table outlines Visa Inc.’s principal products and brand offerings:
| Product | Description |
|---|---|
| VisaNet | A transaction processing network enabling authorization, clearing, and settlement of payments. |
| Visa | The primary card product brand facilitating digital payments globally. |
| Visa Electron | A card brand offering electronic payment services. |
| Interlink | A payments network brand used for electronic transactions. |
| VPAY | A card product brand under Visa’s portfolio. |
| PLUS | A global ATM network brand affiliated with Visa. |
| Service Platforms | Platforms and value-added services supporting digital payment solutions. |
| Strategic Partnership | Collaboration with Ooredoo to enhance payment experiences for Visa cardholders in Qatar. |
Visa Inc. operates a broad portfolio of payment technologies and brands, driven by its VisaNet processing network and supported by multiple card products and service platforms. Its global reach includes strategic alliances to improve customer payment experiences.
Main Competitors
There are 6 main competitors in the Financial – Credit Services industry; below are the top 6 leaders by market capitalization:
| Competitor | Market Cap. |
|---|---|
| Visa Inc. | 672.3B |
| Mastercard Incorporated | 505.7B |
| American Express Company | 260.1B |
| Capital One Financial Corporation | 157.6B |
| PayPal Holdings, Inc. | 54.4B |
| Synchrony Financial | 32.1B |
Visa Inc. ranks 1st among its 6 competitors, holding a market cap 94.14% relative to the top player benchmark. It is positioned above both the average market cap of the top 10 (280.4B) and the median in its sector (208.8B). The company also maintains a significant gap of 25.17% above its nearest competitor, Mastercard.
Comparisons with competitors
Check out how we compare the company to its competitors:
Does Visa have a competitive advantage?
Visa Inc. demonstrates a clear competitive advantage, supported by a very favorable moat status with a ROIC exceeding its WACC by over 20%, indicating strong value creation and efficient capital use. The company’s growing ROIC trend over 2021-2025 further confirms its durable competitive position in the payments technology industry.
Looking ahead, Visa’s expansion into new markets and ongoing development of card products, platforms, and value-added services suggest continued growth opportunities. Strategic agreements, such as the one with Ooredoo in Qatar, highlight Visa’s ability to enhance payment experiences globally, supporting its future revenue diversification and market penetration.
SWOT Analysis
This SWOT analysis highlights Visa Inc.’s key internal and external factors to inform strategic investment decisions.
Strengths
- Strong global brand recognition
- High profitability with 50% net margin
- Durable competitive advantage with growing ROIC
Weaknesses
- High valuation multiples (PE 33, PB 17.5)
- Declining net margin growth recently
- Moderate operational expense growth
Opportunities
- Expansion in non-US markets with rising revenues
- Growth in digital payments and fintech adoption
- Strategic partnerships enhancing payment experiences
Threats
- Intense competition from fintech disruptors
- Regulatory and compliance risks globally
- Economic downturns impacting consumer spending
Visa’s robust profitability and competitive moat position it well for continued growth, especially internationally. However, investors should monitor valuation levels and operational cost trends carefully. Strategic focus on innovation and risk management will be crucial to sustain its market leadership.
Stock Price Action Analysis
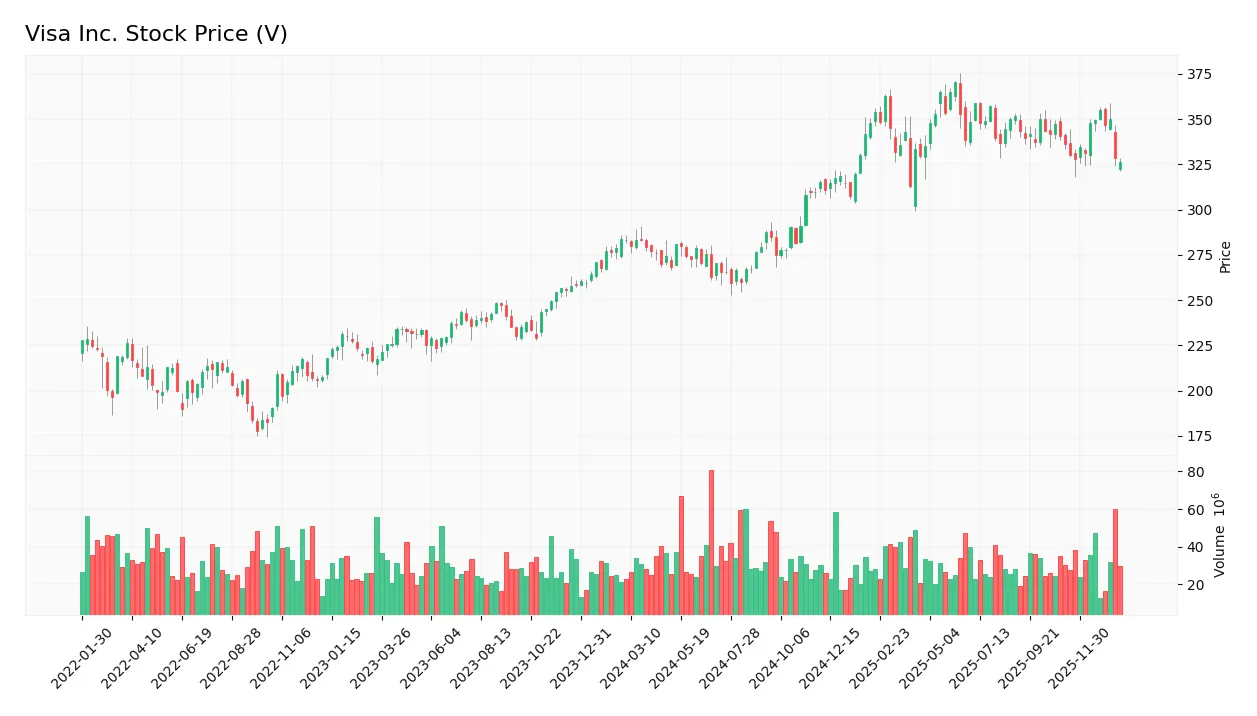
The weekly stock chart for Visa Inc. displays price movements and trading dynamics over the analyzed periods:
Trend Analysis
Over the past 12 months, Visa’s stock price increased by 15.19%, indicating a bullish trend with deceleration in momentum. The price ranged from a low of 259.46 to a high of 370.22, exhibiting significant volatility with a standard deviation of 33.13. However, the recent 11-week period shows a -2.93% decline, suggesting a short-term neutral to bearish shift.
Volume Analysis
In the last three months, trading volume has increased with a total buyer volume of 151.6M versus a seller volume of 235.2M, indicating seller dominance at 39.19%. This rising volume alongside selling pressure suggests cautious investor sentiment and higher market participation skewed toward selling activity.
Target Prices
The consensus target prices for Visa Inc. indicate a generally positive outlook among analysts.
| Target High | Target Low | Consensus |
|---|---|---|
| 425 | 374 | 401.78 |
Analysts expect Visa’s stock to trade between $374 and $425, with a consensus price around $402, reflecting moderate growth potential.

Don’t Let Luck Decide Your Entry Point
Optimize your entry points with our advanced ProRealTime indicators. You’ll get efficient buy signals with precise price targets for maximum performance. Start outperforming now!
Analyst & Consumer Opinions
This section examines the latest analyst ratings and consumer feedback regarding Visa Inc.’s market performance and services.
Stock Grades
Here is the latest summary of Visa Inc.’s stock ratings from major recognized financial institutions:
| Grading Company | Action | New Grade | Date |
|---|---|---|---|
| B of A Securities | Upgrade | Buy | 2025-12-11 |
| HSBC | Upgrade | Buy | 2025-12-08 |
| Raymond James | Maintain | Outperform | 2025-10-29 |
| Macquarie | Maintain | Outperform | 2025-10-29 |
| UBS | Maintain | Buy | 2025-10-29 |
| Baird | Maintain | Outperform | 2025-10-06 |
| Truist Securities | Maintain | Buy | 2025-08-04 |
| Macquarie | Maintain | Outperform | 2025-07-31 |
| Barclays | Maintain | Overweight | 2025-07-31 |
| UBS | Maintain | Buy | 2025-07-30 |
The consensus among these established firms is a clear Buy rating, with multiple upgrades recently reflecting growing confidence. Most grades are positive, indicating strong market sentiment toward Visa Inc. in late 2025.
Consumer Opinions
Visa Inc. continues to garner mixed but insightful feedback from its user base, reflecting its prominent role in global payments.
| Positive Reviews | Negative Reviews |
|---|---|
| Reliable and fast transaction processing. | Occasional issues with customer service. |
| Wide global acceptance and convenience. | High fees on certain international transactions. |
| Strong security features protecting accounts. | Some users report delays in dispute resolutions. |
Overall, consumers appreciate Visa’s reliability and broad acceptance, though concerns remain about customer service responsiveness and fees, particularly for cross-border usage.
Risk Analysis
Below is a summary table highlighting key risks associated with investing in Visa Inc., including their likelihood and potential impact:
| Category | Description | Probability | Impact |
|---|---|---|---|
| Valuation Risk | Elevated P/E (33.05) and P/B (17.49) ratios suggest the stock is expensive. | High | High |
| Market Volatility | Beta of 0.815 indicates moderate sensitivity to market fluctuations. | Medium | Medium |
| Competitive Risk | Intense competition from fintech disruptors and alternative payment systems. | Medium | High |
| Regulatory Risk | Financial services face evolving regulations that could impact operations. | Medium | Medium |
| Technology Risk | Dependence on VisaNet infrastructure creates exposure to cybersecurity threats. | Low | High |
| Dividend Yield Risk | Low dividend yield of 0.7% may deter income-focused investors. | High | Low |
The most significant risks for Visa are its high valuation multiples and competitive pressures from emerging fintech players. Despite strong financial health indicated by a safe Altman Z-Score and a very strong Piotroski Score, investors should be cautious of potential price corrections and market disruptions in the evolving payments landscape.
Should You Buy Visa Inc.?
Visa Inc. appears to be a robustly profitable company with a durable competitive moat supported by a growing ROIC well above its WACC, suggesting strong value creation. Despite a moderate leverage profile, the overall rating of B+ could be seen as very favorable, indicating a solid financial health.
Strength & Efficiency Pillars
Visa Inc. exhibits robust profitability with a net margin of 50.14% and an impressive return on equity (ROE) of 52.91%, underscoring its operational efficiency and strong shareholder returns. The company is a clear value creator as its return on invested capital (ROIC) stands at 28.36%, significantly above its weighted average cost of capital (WACC) of 7.53%. Financial health is reinforced by a high Altman Z-Score of 7.62, placing it well within the safe zone, and a very strong Piotroski score of 8, reflecting solid fundamentals and minimal bankruptcy risk.
Weaknesses and Drawbacks
Despite its strengths, Visa faces valuation concerns with a high price-to-earnings (P/E) ratio of 33.05 and a price-to-book (P/B) ratio of 17.49, indicating a premium market valuation that may limit upside potential. Leverage metrics are moderate; the debt-to-equity ratio is 0.66 and the current ratio is 1.08, suggesting manageable but not exceptional liquidity. Market pressure is evident in the recent seller dominance, with buyers representing only 39.19% of volume since November 2025, which could signal short-term headwinds and price volatility risk.
Our Verdict about Visa Inc.
Visa’s long-term fundamental profile is favorable, supported by strong profitability, efficient capital use, and solid financial health. However, despite a bullish overall stock trend with a 15.19% price increase over the past year, recent seller dominance suggests a wait-and-see approach for a better entry point. The premium valuation metrics also advise caution, meaning Visa may appear attractive for long-term exposure but could face near-term market pressure.
Disclaimer: This content is for informational purposes only and does not constitute financial, investment, or other professional advice. Investing in financial markets involves a significant risk of loss, and past performance is not indicative of future results.
Additional Resources
- Visa Inc. $V Shares Purchased by Biltmore Family Office LLC – MarketBeat (Jan 25, 2026)
- Visa Inc. (V) Is a Trending Stock: Facts to Know Before Betting on It – Yahoo Finance (Jan 21, 2026)
- BAM Wealth Management LLC Purchases Shares of 3,557 Visa Inc. $V – MarketBeat (Jan 25, 2026)
- Why is Visa Inc. (V) One of the Best Stocks to Buy in 2026 for Beginners? – Yahoo Finance (Jan 18, 2026)
- Blackhawk Capital Partners LLC Trims Holdings in Visa Inc. $V – MarketBeat (Jan 25, 2026)
For more information about Visa Inc., please visit the official website: usa.visa.com