Home > Analyses > Real Estate > VICI Properties Inc.
VICI Properties transforms entertainment landscapes by owning iconic gaming and hospitality venues like Caesars Palace. It dominates the experiential real estate sector with a diverse portfolio spanning 29 premier gaming facilities and thousands of hotel rooms nationwide. Known for its strategic leasing to top-tier operators, VICI blends innovation with stable cash flow. As 2026 unfolds, I question whether its fundamentals still support its valuation and future growth in a shifting market environment.

Table of contents
Business Model & Company Overview
VICI Properties Inc., founded in 2018 and headquartered in New York City, commands a leading role in the experiential real estate sector. It owns one of the largest portfolios of premier gaming, hospitality, and entertainment destinations, including the iconic Caesars Palace. Its national footprint spans 29 gaming facilities, over 48M square feet, 19,200 hotel rooms, and 200+ dining and nightlife venues, forming a cohesive ecosystem that drives visitor engagement and value.
The company generates revenue primarily through long-term leases to top-tier operators such as Caesars Entertainment and Hard Rock International. This diversified income stream balances stable, recurring rental cash flows across key markets in the Americas, Europe, and Asia. VICI’s strategic asset base and exclusive tenant relationships create a durable economic moat, positioning it as a pivotal player shaping the future of experiential real estate.
Financial Performance & Fundamental Metrics
I analyze VICI Properties Inc.’s income statement, key financial ratios, and dividend payout policy to assess its core profitability and capital efficiency.
Income Statement
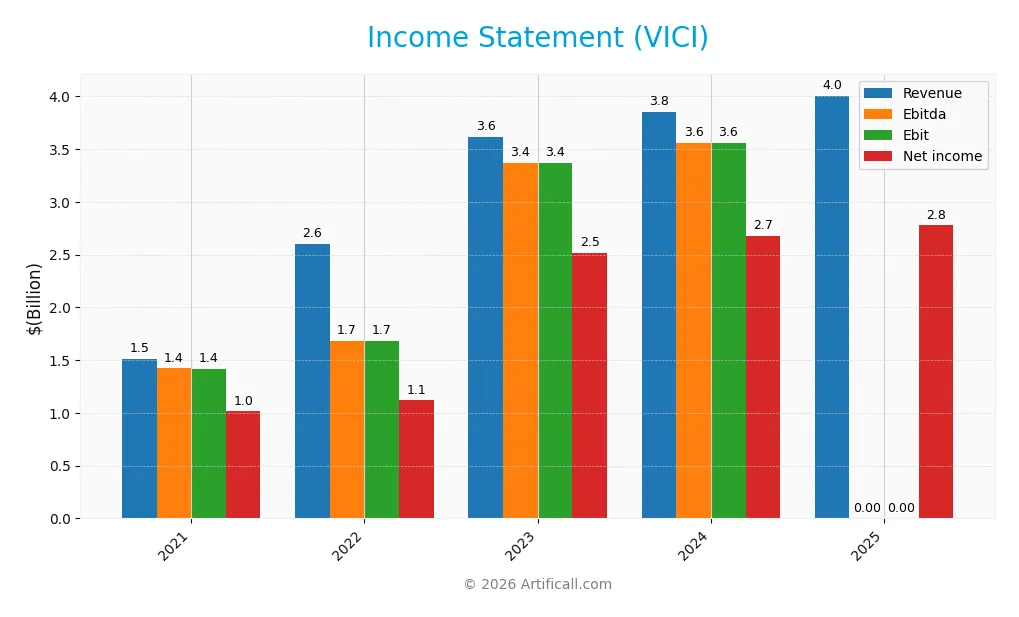
The following table presents VICI Properties Inc.’s key income statement figures for fiscal years 2021 through 2025, expressed in USD.
| 2021 | 2022 | 2023 | 2024 | 2025 | |
|---|---|---|---|---|---|
| Revenue | 1.51B | 2.60B | 3.61B | 3.85B | 4.01B |
| Cost of Revenue | 20.8M | 22.6M | 27.1M | 26.9M | 0 |
| Operating Expenses | 44.5M | 945.6M | 240.1M | 277.4M | 65.1M |
| Gross Profit | 1.49B | 2.58B | 3.58B | 3.82B | 0 |
| EBITDA | 1.42B | 1.68B | 3.37B | 3.56B | 0 |
| EBIT | 1.42B | 1.68B | 3.37B | 3.56B | 0 |
| Interest Expense | 392.4M | 540.0M | 818.1M | 826.1M | -843.6M |
| Net Income | 1.01B | 1.12B | 2.51B | 2.68B | 2.78B |
| EPS | 1.80 | 1.27 | 2.48 | 2.56 | 2.61 |
| Filing Date | 2022-02-23 | 2023-02-23 | 2024-02-22 | 2025-02-20 | 2026-02-25 |
Income Statement Evolution
VICI Properties’ revenue grew steadily, increasing 165% from 2021 to 2025, with a modest 4% rise between 2024 and 2025. Net income followed a similar upward trajectory, climbing 174% over five years. Margins shifted notably—gross and EBIT margins fell to zero in 2025, signaling structural changes, while net margin remained strong at 69%, slightly declining year-over-year.
Is the Income Statement Favorable?
In 2025, VICI’s income statement shows robust fundamentals with a high net margin of 69%, supported by favorable interest expense management at -21%. However, the absence of gross profit and EBIT margins highlights potential accounting or operational shifts. Revenue growth is neutral, and EPS edged up nearly 2%, indicating stability amid margin challenges. Overall, the income statement leans favorable but warrants caution on margin erosion.
Financial Ratios
The following table presents key financial ratios for VICI Properties Inc. from 2021 to 2025, illustrating profitability, liquidity, leverage, and valuation metrics:
| Ratios | 2021 | 2022 | 2023 | 2024 | 2025 |
|---|---|---|---|---|---|
| Net Margin | 67.2% | 43.0% | 69.6% | 69.6% | 69.3% |
| ROE | 8.4% | 5.1% | 9.9% | 10.1% | 10.0% |
| ROIC | 8.3% | 4.4% | 7.7% | 7.9% | 0% |
| P/E | 16.8 | 25.4 | 12.9 | 11.4 | 10.8 |
| P/B | 1.40 | 1.30 | 1.28 | 1.15 | 1.07 |
| Current Ratio | 10.0 | 29.0 | 28.2 | 27.9 | 2.55 |
| Quick Ratio | 10.0 | 29.0 | 28.2 | 27.9 | 2.55 |
| D/E | 0.41 | 0.66 | 0.70 | 0.67 | 0.00 |
| Debt-to-Assets | 28.4% | 38.8% | 40.0% | 38.9% | 0.0% |
| Interest Coverage | 3.7 | 3.0 | 4.1 | 4.3 | 0.0 |
| Asset Turnover | 0.086 | 0.069 | 0.082 | 0.085 | 0.086 |
| Fixed Asset Turnover | 4.20 | 2.97 | 3.79 | 3.98 | 0.0 |
| Dividend Yield | 4.46% | 4.29% | 4.90% | 5.73% | 6.21% |
Evolution of Financial Ratios
From 2021 to 2025, VICI Properties’ Return on Equity (ROE) hovered near 10%, indicating stable but modest profitability. The Current Ratio showed a sharp decline from above 9 in 2021 to 2.55 in 2025, reflecting reduced liquidity. Debt-to-Equity Ratio fell to zero in 2025, marking a significant deleveraging trend after consistent levels around 0.4 to 0.7 in prior years.
Are the Financial Ratios Fovorable?
In 2025, VICI’s profitability remains strong with a net margin of 69.3%, but ROE at 9.98% is slightly unfavorable versus typical equity returns. Liquidity ratios, including a 2.55 current and quick ratio, are favorable and show healthy short-term financial flexibility. The zero debt-to-equity ratio and debt-to-assets ratio also stand out positively, suggesting minimal leverage risk. However, asset turnover and interest coverage ratios are weak, flagging potential operational efficiency and debt servicing concerns. Overall, 57% of key ratios rate favorable, reflecting a generally positive financial stance.
Shareholder Return Policy
VICI Properties Inc. maintains a dividend payout ratio near 65-75%, with dividends per share steadily increasing from $1.34 in 2021 to $1.75 in 2025. The annual yield remains robust, around 4.5% to 6.2%, supported by solid net profit margins above 65%.
The company also executes share buybacks, complementing dividends as shareholder returns. Dividend payments stay covered by free cash flow and operating cash flow, indicating prudent capital allocation. This balanced approach supports sustainable long-term value creation while managing payout risks effectively.
Score analysis
The following radar chart illustrates VICI Properties Inc.’s key financial scores across valuation, profitability, and leverage metrics:
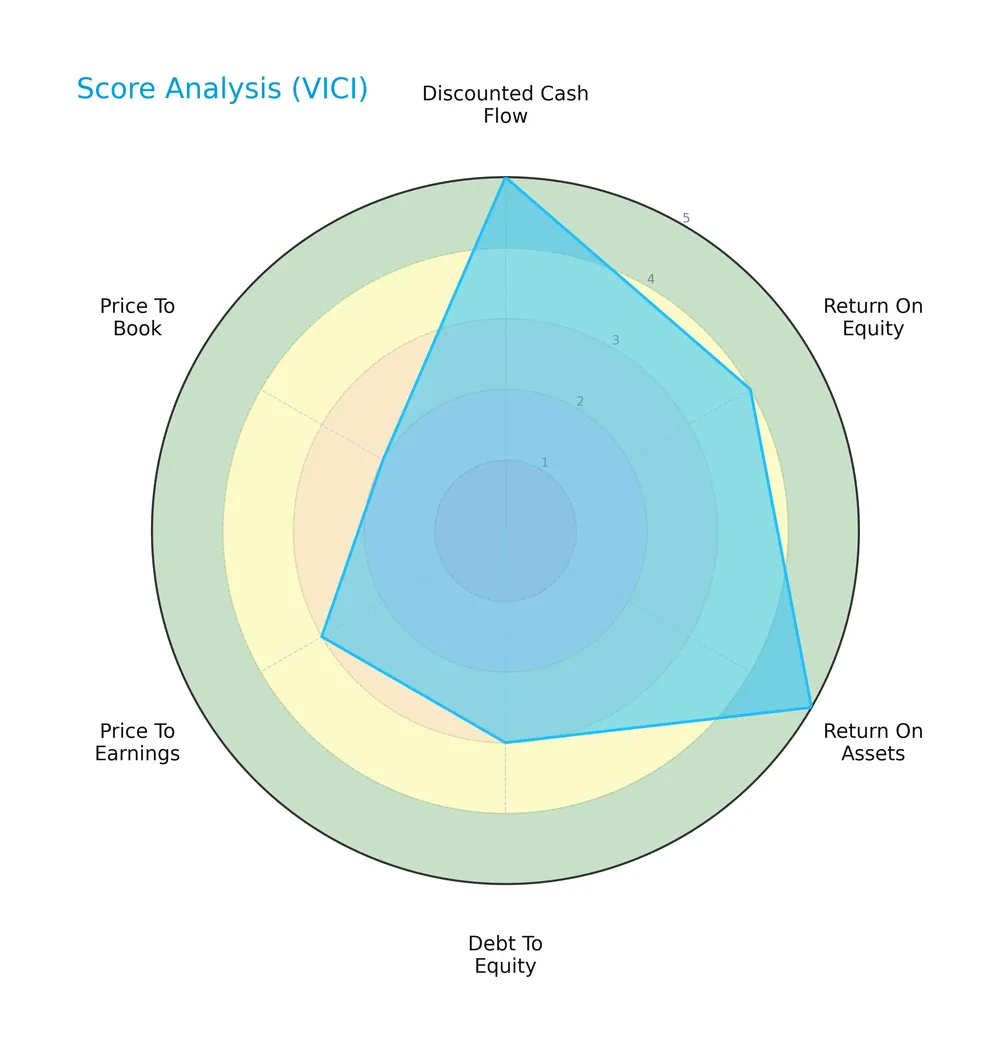
VICI shows very favorable discounted cash flow and return on assets scores, signaling strong cash generation and asset efficiency. Return on equity is favorable, while debt-to-equity and price-to-earnings ratios are moderate. The price-to-book score is unfavorable, indicating valuation concerns relative to book value.
Analysis of the company’s bankruptcy risk
VICI’s Altman Z-Score places it in the distress zone, indicating a high risk of financial distress and potential bankruptcy:

Is the company in good financial health?
The Piotroski Score diagram provides insight into VICI’s overall financial strength and stability:

With a Piotroski score of 5, VICI is in average financial health. This suggests moderate strength but room for improvement in profitability, leverage, and operational efficiency metrics.
Competitive Landscape & Sector Positioning
This sector analysis explores VICI Properties Inc.’s strategic positioning, revenue segments, key products, and main competitors. I will assess whether VICI holds a competitive advantage over its industry peers.
Strategic Positioning
VICI Properties concentrates on experiential real estate, owning 29 gaming and hospitality assets across the U.S., including Caesars Palace. Its portfolio spans 48M sq ft with 19,200 hotel rooms, leased to top operators, reflecting a focused yet geographically diverse strategy within gaming and entertainment real estate.
Revenue by Segment
This pie chart illustrates VICI Properties Inc.’s revenue distribution by segment from 2017 to 2021, highlighting the dominance of its Real Property Business Segment.
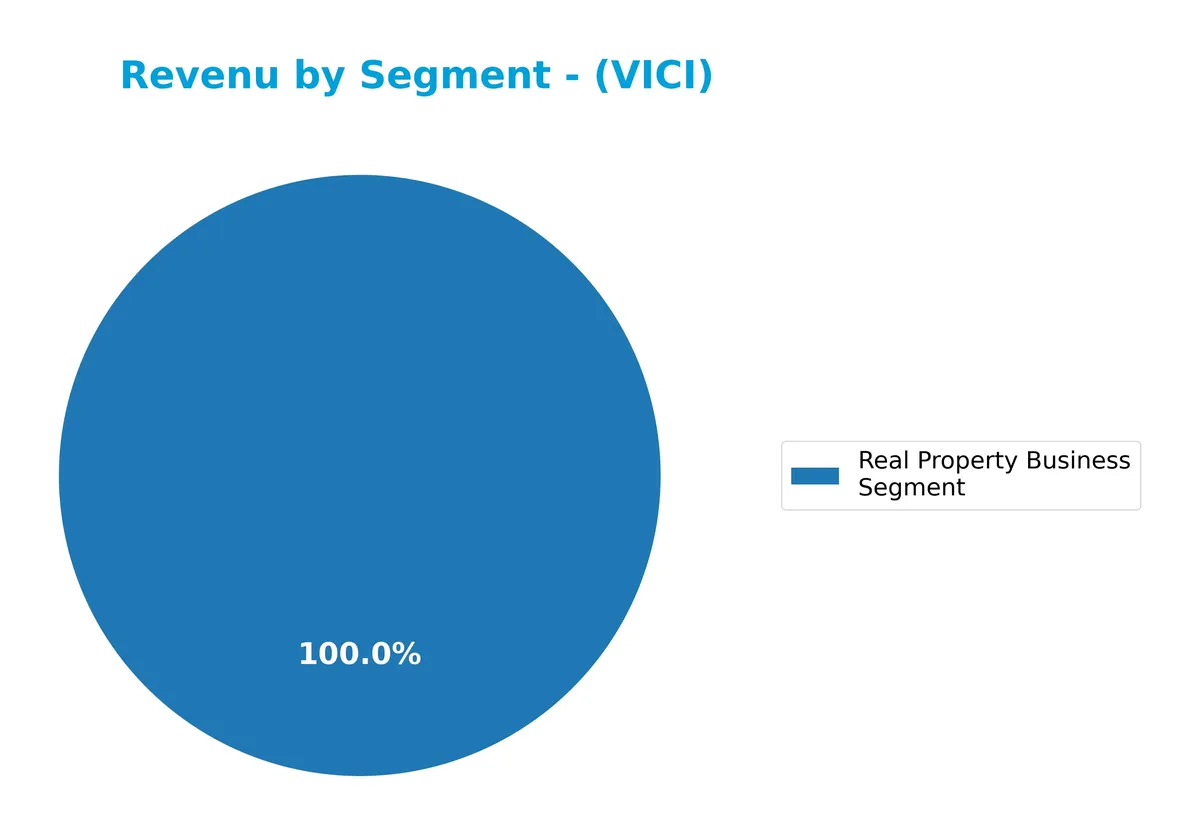
VICI’s revenue is concentrated solely in its Real Property Business Segment, which expanded significantly from 181M in 2017 to 1.48B in 2021. This steady growth reflects the company’s successful capital allocation toward property acquisitions. The trend suggests a strong moat in real estate assets, with no diversification risk apparent given the single-segment focus. The acceleration in 2021 underscores VICI’s expanding market footprint.
Key Products & Brands
The table below outlines VICI Properties Inc.’s key products and brands within its diversified real estate portfolio:
| Product | Description |
|---|---|
| Gaming Facilities Portfolio | Owns 29 gaming facilities totaling over 48M sq ft, leased to top gaming operators like Caesars Entertainment and Hard Rock. |
| Hospitality Assets | Includes approximately 19,200 hotel rooms across its properties, supporting a major hospitality footprint. |
| Food & Beverage Venues | Features more than 200 restaurants, bars, and nightclubs within the gaming and hospitality properties. |
| Championship Golf Courses | Owns four championship golf courses enhancing experiential offerings beyond gaming and lodging. |
| Undeveloped Land | Holds 34 acres adjacent to the Las Vegas Strip, providing potential for future development or strategic use. |
VICI Properties focuses on experiential real estate with a diversified portfolio centered on gaming, hospitality, and entertainment. Its properties generate significant revenue through leasing arrangements with leading operators.
Main Competitors
The sector includes 31 competitors, with the table below listing the top 10 leaders by market capitalization:
| Competitor | Market Cap. |
|---|---|
| Welltower Inc. | 128.3B |
| Prologis, Inc. | 119.7B |
| American Tower Corporation | 81.8B |
| Equinix, Inc. | 74.5B |
| Simon Property Group, Inc. | 60.1B |
| Digital Realty Trust, Inc. | 53.3B |
| Realty Income Corporation | 52.7B |
| CBRE Group, Inc. | 47.7B |
| Public Storage | 45.3B |
| Crown Castle Inc. | 38.6B |
VICI Properties Inc. ranks 12th among 31 competitors in the Real Estate REIT – Diversified industry. It holds about 25% of the market cap of the leader, Welltower Inc., and stands below the average market cap of the top 10 (70.2B) but above the sector median (24.6B). The company maintains a 5.85% market cap gap to the next competitor above it, reflecting a moderate competitive cushion.
Comparisons with competitors
Check out how we compare the company to its competitors:
Aucun article trouvé pour ces critères.
Does VICI have a competitive advantage?
VICI Properties lacks a competitive advantage, as its return on invested capital (ROIC) trails its cost of capital, indicating value destruction and declining profitability. The company shows no excess capital to reinvest, signaling weak economic moat sustainability.
Looking ahead, VICI’s portfolio includes 29 gaming and hospitality properties and 34 acres near the Las Vegas Strip, presenting opportunities to expand its experiential real estate reach. Its partnerships with leading operators like Caesars and Hard Rock could support future growth in gaming and entertainment markets.
SWOT Analysis
This SWOT analysis highlights VICI Properties Inc.’s key strategic factors shaping its investment profile.
Strengths
- Strong net margin at 69%
- Diversified portfolio across gaming and hospitality
- Favorable valuation metrics (P/E 10.76, P/B 1.07)
Weaknesses
- Declining ROIC, destroying value
- Weak interest coverage ratio
- Altman Z-score in distress zone
Opportunities
- Expansion in experiential real estate
- Growing gaming and hospitality demand
- Strategic leases with top operators
Threats
- Economic downturn impacts on discretionary spending
- Regulatory risks in gaming sector
- Rising interest rates increasing borrowing costs
VICI’s strong cash flow and premium property base provide resilience. However, its declining profitability and financial distress signals demand cautious capital allocation. The company must leverage growth opportunities while managing sector-specific and financial risks.
Stock Price Action Analysis
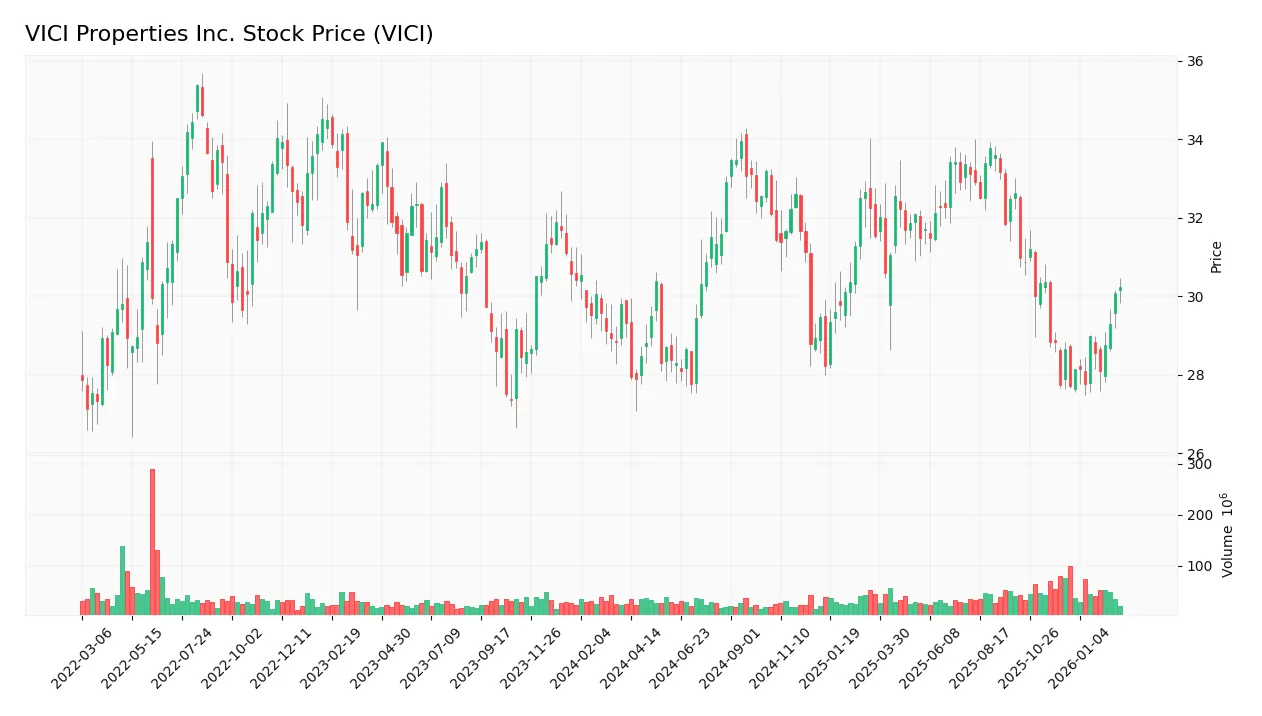
The weekly stock chart below illustrates VICI Properties Inc.’s price movement and volatility over the past 12 months:
Trend Analysis
Over the past 12 months, VICI’s stock price increased by 3.14%, indicating a bullish trend. The price showed acceleration, moving from a low of 27.7 to a high of 33.96. Volatility is moderate with a standard deviation of 1.84. The recent three-month trend continued upward with a 5.51% gain.
Volume Analysis
Trading volume is increasing, with a total of 4.09B shares exchanged over the last year. Buyers account for 49.86%, nearly balanced with sellers. In the recent quarter, buyer dominance rose to 56.2%, reflecting slightly stronger buying interest and growing investor participation.
Target Prices
Analysts set a firm target consensus for VICI Properties Inc., reflecting moderate upside potential.
| Target Low | Target High | Consensus |
|---|---|---|
| 30 | 33 | 31.6 |
The target range of $30 to $33 indicates cautious optimism. The consensus at $31.6 suggests steady growth expectations.

Don’t Let Luck Decide Your Entry Point
Optimize your entry points with our advanced ProRealTime indicators. You’ll get efficient buy signals with precise price targets for maximum performance. Start outperforming now!
Analyst & Consumer Opinions
This section explores Analyst grades and Consumer feedback to provide a balanced view of VICI Properties Inc.’s market perception.
Stock Grades
Here are the latest verified stock grades for VICI Properties Inc. from recognized financial institutions:
| Grading Company | Action | New Grade | Date |
|---|---|---|---|
| Scotiabank | Downgrade | Sector Perform | 2026-02-02 |
| Mizuho | Maintain | Outperform | 2025-12-17 |
| Barclays | Maintain | Overweight | 2025-12-03 |
| Evercore ISI Group | Downgrade | In Line | 2025-12-01 |
| Goldman Sachs | Maintain | Buy | 2025-11-28 |
| Wells Fargo | Downgrade | Equal Weight | 2025-11-18 |
| Cantor Fitzgerald | Maintain | Overweight | 2025-11-06 |
| Evercore ISI Group | Maintain | Outperform | 2025-10-31 |
| Stifel | Maintain | Buy | 2025-10-31 |
| Barclays | Maintain | Overweight | 2025-10-20 |
The grades show a mixed but generally positive outlook, with several downgrades from Outperform to more neutral levels. The consensus remains a Buy, reflecting moderate confidence despite recent caution.
Consumer Opinions
VICI Properties Inc. enjoys generally favorable consumer sentiment, reflecting its strong market presence and asset quality.
| Positive Reviews | Negative Reviews |
|---|---|
| “Stable dividends and consistent income flow.” | “Limited growth potential concerns me.” |
| “Well-managed portfolio with prime retail assets.” | “Stock price volatility is unsettling.” |
| “Reliable REIT with transparent reporting.” | “Rising interest rates could pressure returns.” |
Overall, consumers praise VICI’s dependable dividends and quality assets. However, they worry about growth limitations and sensitivity to interest rate hikes, reflecting typical REIT sector challenges.
Risk Analysis
Below is a summary of key risks facing VICI Properties Inc., highlighting their likelihood and potential impact:
| Category | Description | Probability | Impact |
|---|---|---|---|
| Financial Health | Altman Z-Score in distress zone (1.43) signals elevated bankruptcy risk. | High | High |
| Profitability | ROE at 9.98% is below ideal, indicating weaker shareholder returns. | Medium | Medium |
| Operational | Very low asset turnover (0.09) reflects inefficiency in asset utilization. | Medium | Medium |
| Interest Coverage | Negative interest coverage raises concerns about debt servicing ability. | Low | High |
| Market Exposure | Gaming and hospitality sector cyclicality exposes VICI to economic swings. | High | High |
| Dividend Yield | 6.21% yield is attractive but could pressure cash flow if earnings decline. | Medium | Medium |
The most pressing risks are the financial distress indicated by the Altman Z-Score and the cyclical nature of VICI’s gaming-centric portfolio. Despite a solid current ratio (2.55) and zero debt-to-equity, the company’s negative interest coverage and low asset turnover point to operational challenges. Investors should weigh these risks carefully in the context of a historically volatile sector.
Should You Buy VICI Properties Inc.?
VICI Properties Inc. appears to be a company with moderate profitability and an unfavorable moat, indicating value erosion and declining returns on invested capital. While its leverage profile shows some manageability, the mixed rating of A coupled with a distress-zone Altman Z-Score suggests caution despite operational efficiency signals.
Strength & Efficiency Pillars
VICI Properties Inc. posts a strong net margin of 69.28%, signaling robust operational profitability. The company benefits from a favorable weighted average cost of capital (WACC) of 6.94%, underscoring efficient capital costs. However, the return on invested capital (ROIC) stands at 0%, indicating no value creation and a concerning lack of excess returns above WACC. This disconnect highlights operational margins strength but flags serious inefficiencies in capital deployment.
Weaknesses and Drawbacks
VICI is in financial distress with an Altman Z-Score of 1.43, significantly below the 1.8 distress threshold. This heightens bankruptcy risk despite solid net margins. The firm’s interest coverage is negative, which raises red flags about its ability to service debt. While price-to-earnings (10.76) and price-to-book (1.07) ratios appear moderate, underlying solvency concerns and deteriorating capital returns pose critical challenges. Asset turnover metrics also reflect operational inefficiencies.
Our Final Verdict about VICI Properties Inc.
Despite operational profitability, VICI’s solvency risk and falling capital returns make its investment profile highly speculative. The Altman Z-Score in the distress zone signals potential bankruptcy, overshadowing favorable margins and recent bullish price trends. Investors prioritizing capital preservation should treat VICI as too risky for conservative portfolios, despite moderate valuation and slight buyer dominance in recent trading.
Disclaimer: This content is for informational purposes only and does not constitute financial, investment, or other professional advice. Investing in financial markets involves a significant risk of loss, and past performance is not indicative of future results.
Additional Resources
- VICI Properties Inc. Announces Fourth Quarter and Full Year 2025 Results – Yahoo Finance (Feb 25, 2026)
- VICI Properties Inc. (VICI) Q4 FFO Meet Estimates – Nasdaq (Feb 26, 2026)
- Vici Properties issues soft guidance, delivers in-line Q4 earnings, revenue (VICI:NYSE) – Seeking Alpha (Feb 25, 2026)
- Decoding VICI Properties Inc (VICI): A Strategic SWOT Insight – GuruFocus (Feb 26, 2026)
- VICI Properties Posts Solid Q4 Results, Expands Investments – TipRanks (Feb 25, 2026)
For more information about VICI Properties Inc., please visit the official website: viciproperties.com