Home > Analyses > Healthcare > Viatris Inc.
Viatris Inc. delivers vital medicines that touch millions of lives daily, bridging innovation and accessibility worldwide. It commands a powerful presence in specialty and generic drug manufacturing, backed by a diverse portfolio including biosimilars and complex generics. Known for its global reach and strategic collaborations, Viatris continuously reshapes healthcare delivery. As the pharmaceutical landscape evolves, I ask: does Viatris’s robust pipeline and market position justify its current valuation and growth prospects?

Table of contents
Business Model & Company Overview
Viatris Inc., founded in 1961 and based in Canonsburg, Pennsylvania, commands a significant role in the Drug Manufacturers – Specialty & Generic sector. With a workforce of 32K, it delivers a broad, integrated ecosystem of prescription brands, generics, complex generics, biosimilars, and active pharmaceutical ingredients. Its portfolio spans critical therapeutic areas, creating a unified mission to enhance global healthcare access and outcomes.
The company’s revenue engine balances product sales across developed and emerging markets, emphasizing a mix of oral solids, injectables, and complex dosage forms. It leverages diverse distribution channels, including wholesalers, specialty pharmacies, and e-commerce, to serve customers worldwide. Viatris’s competitive advantage lies in its extensive global footprint and collaboration network, securing its role as a vital innovator shaping the pharmaceutical industry’s future.
Financial Performance & Fundamental Metrics
I analyze Viatris Inc.’s income statement, key financial ratios, and dividend payout policy to assess its operational efficiency and shareholder value creation.
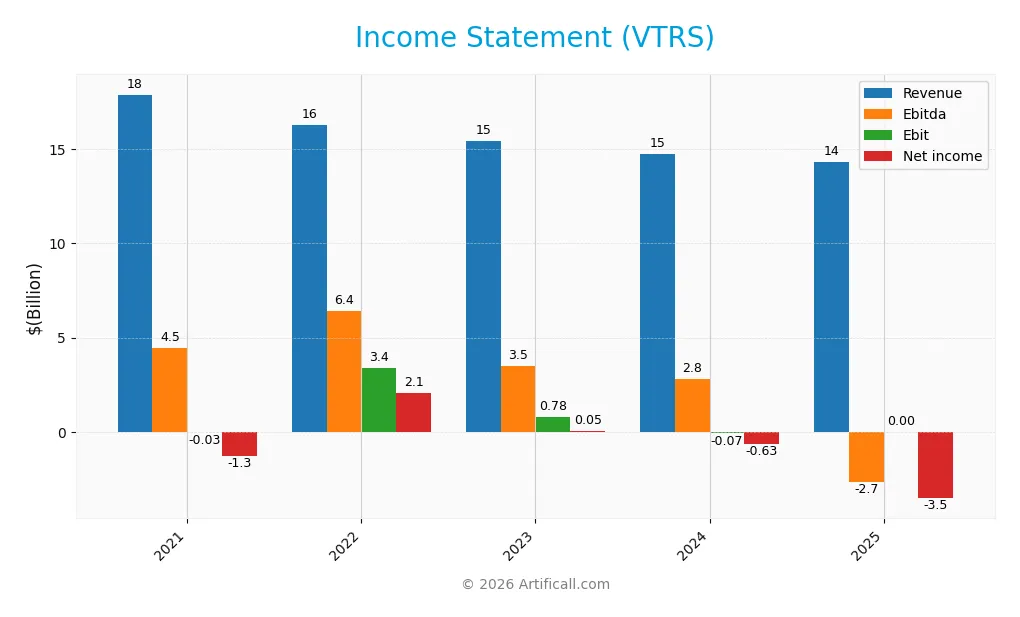
Income Statement
Below is Viatris Inc.’s Income Statement for the fiscal years 2021 through 2025, showing key profitability and expense metrics in USD.
| 2021 | 2022 | 2023 | 2024 | 2025 | |
|---|---|---|---|---|---|
| Revenue | 17.9B | 16.3B | 15.4B | 14.7B | 14.3B |
| Cost of Revenue | 12.3B | 9.8B | 9.0B | 9.1B | 9.3B |
| Operating Expenses | 5.6B | 4.9B | 5.7B | 5.6B | 7.7B |
| Gross Profit | 5.6B | 6.5B | 6.4B | 5.6B | 5.0B |
| EBITDA | 4.5B | 6.4B | 3.5B | 2.8B | -2.7B |
| EBIT | -28M | 3.4B | 776M | -73M | 0 |
| Interest Expense | 636M | 592M | 573M | 550M | 471M |
| Net Income | -1.3B | 2.1B | 55M | -634M | -3.5B |
| EPS | -1.05 | 1.71 | 0.046 | -0.53 | -3.00 |
| Filing Date | 2022-02-28 | 2023-02-27 | 2024-02-28 | 2025-02-27 | 2026-02-26 |
Income Statement Evolution
Viatris Inc.’s revenue declined by 3% in 2025 to $14.3B, continuing a broader 20% fall since 2021. Gross profit dropped 11% last year, reflecting margin pressure. EBIT margin remained flat at 0%, while net margin worsened to -24.6%, signaling deteriorating profitability despite stable operating expenses relative to revenue.
Is the Income Statement Favorable?
The 2025 income statement reveals weak fundamentals. A negative $3.5B net income and a -24.6% net margin highlight significant losses. Interest expense remains manageable at 3.3% of revenue, but operating income is deeply negative. Overall, 79% of key metrics are unfavorable, underscoring persistent profitability challenges and deteriorating earnings per share.
Financial Ratios
The table below summarizes Viatris Inc.’s key financial ratios for the fiscal years 2021 through 2025, providing a snapshot of profitability, liquidity, leverage, and valuation metrics:
| Ratios | 2021 | 2022 | 2023 | 2024 | 2025 |
|---|---|---|---|---|---|
| Net Margin | -7.10% | 12.78% | 0.35% | -4.30% | -24.58% |
| ROE | -6.19% | 9.86% | 0.27% | -3.40% | -23.89% |
| ROIC | -0.07% | 2.67% | 0.49% | 0.03% | -6.87% |
| P/E | -12.89 | 6.49 | 238.65 | -23.43 | -4.15 |
| P/B | 0.80 | 0.64 | 0.64 | 0.80 | 0.99 |
| Current Ratio | 1.10 | 1.58 | 1.67 | 1.65 | 5.06 |
| Quick Ratio | 0.70 | 1.05 | 1.22 | 0.98 | 2.99 |
| D/E | 1.14 | 0.93 | 0.90 | 0.77 | 0.98 |
| Debt-to-Assets | 42.59% | 39.04% | 38.53% | 34.47% | 38.75% |
| Interest Coverage | -0.05 | 2.73 | 1.34 | 0.02 | -5.65 |
| Asset Turnover | 0.33 | 0.33 | 0.32 | 0.36 | 0.38 |
| Fixed Asset Turnover | 5.14 | 4.95 | 5.13 | 5.05 | 0.00 |
| Dividend Yield | 2.44% | 4.31% | 4.43% | 3.87% | 3.85% |
Evolution of Financial Ratios
From 2021 to 2025, Viatris’s Return on Equity (ROE) declined sharply, turning negative by 2025 at -23.9%. The Current Ratio improved significantly, rising from 1.10 in 2021 to 5.06 in 2025, indicating increased liquidity. The Debt-to-Equity Ratio remained relatively stable around 0.9 to 1.0, reflecting consistent leverage. Profitability weakened notably, with net margins deteriorating over the period.
Are the Financial Ratios Favorable?
In 2025, profitability ratios such as net margin (-24.6%) and ROE (-23.9%) are unfavorable, signaling operational challenges. Liquidity appears mixed; a high Current Ratio (5.06) may suggest excessive idle assets, while the Quick Ratio (2.99) is favorable. Leverage metrics like Debt-to-Equity (0.98) and Debt-to-Assets (38.8%) are neutral, but interest coverage stands at zero, a red flag. Market valuation ratios including Price-to-Book (0.99) and Dividend Yield (3.85%) are favorable. Overall, the ratio profile is slightly unfavorable.
Shareholder Return Policy
Viatris Inc. pays dividends with a yield around 3.85% in 2025, supported by a negative payout ratio reflecting net losses. Dividend per share remained stable near $0.48, while free cash flow coverage exceeds 80%, indicating cash flow supports distributions despite earnings weakness.
The company also conducts share buybacks, balancing capital returns with reinvestment needs. Sustaining dividends amid losses poses risks, but free cash flow coverage and moderate leverage suggest the policy aims to preserve long-term shareholder value.
Score analysis
Here is a radar chart illustrating Viatris Inc.’s key financial scores for a balanced overview:
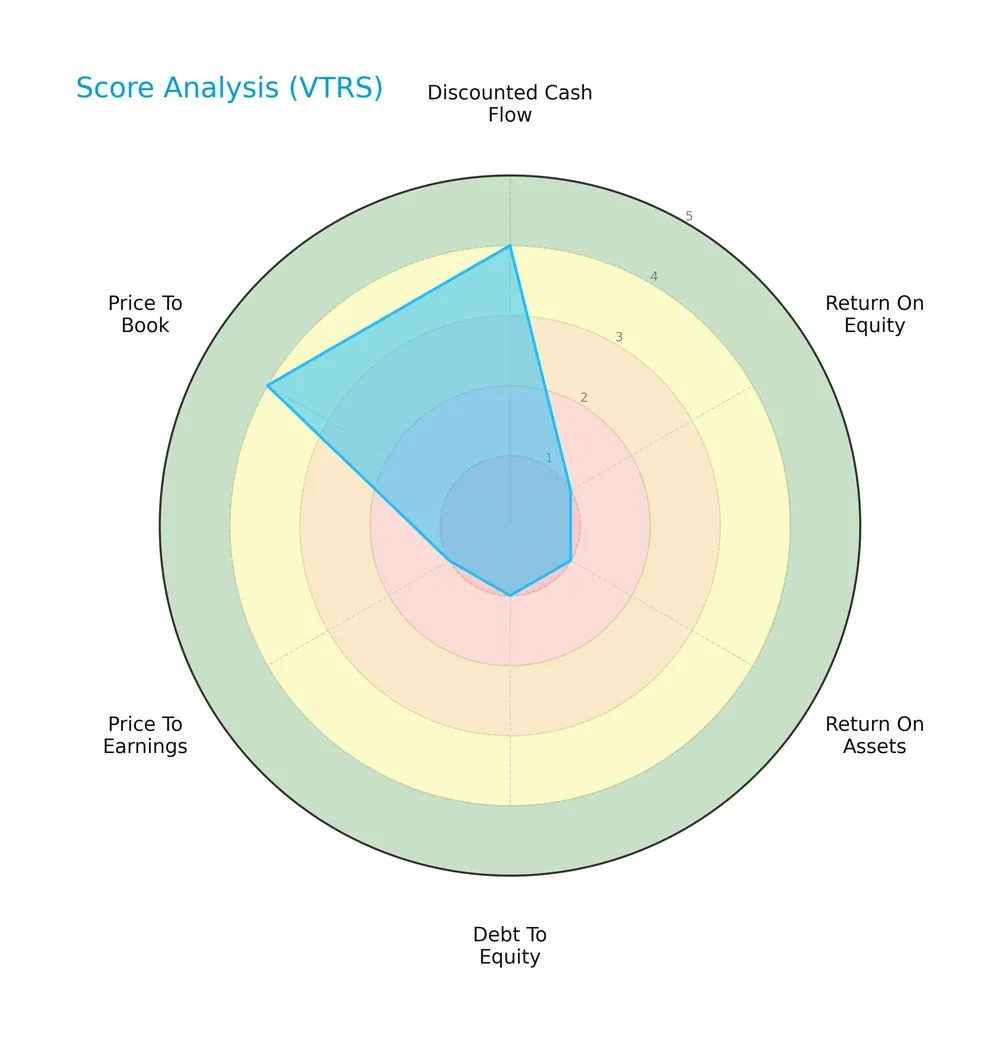
The discounted cash flow and price-to-book scores stand out as favorable at 4 each. Conversely, return on equity, return on assets, debt to equity, and price to earnings scores are very unfavorable at 1, signaling underlying operational and valuation challenges.
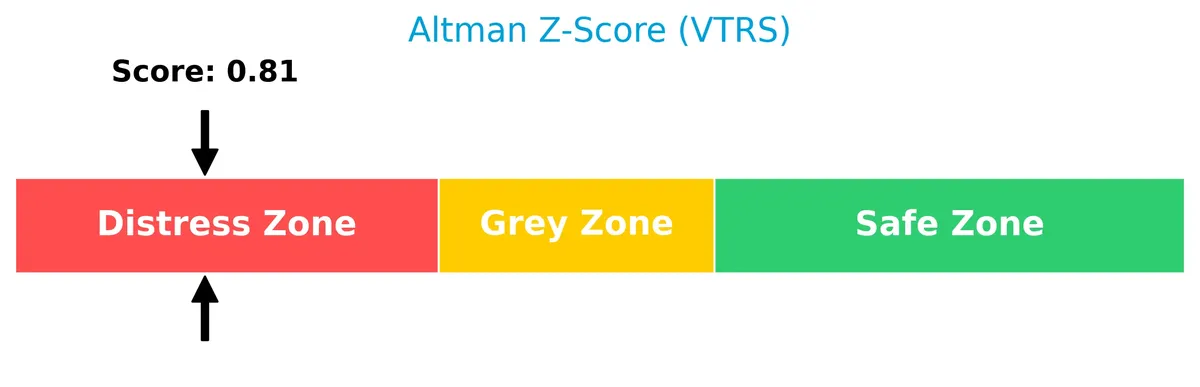
Analysis of the company’s bankruptcy risk
The Altman Z-Score places Viatris Inc. firmly in the distress zone, indicating a high risk of financial distress and potential bankruptcy:
Is the company in good financial health?
The Piotroski Score diagram below reflects Viatris Inc.’s moderate financial health status:
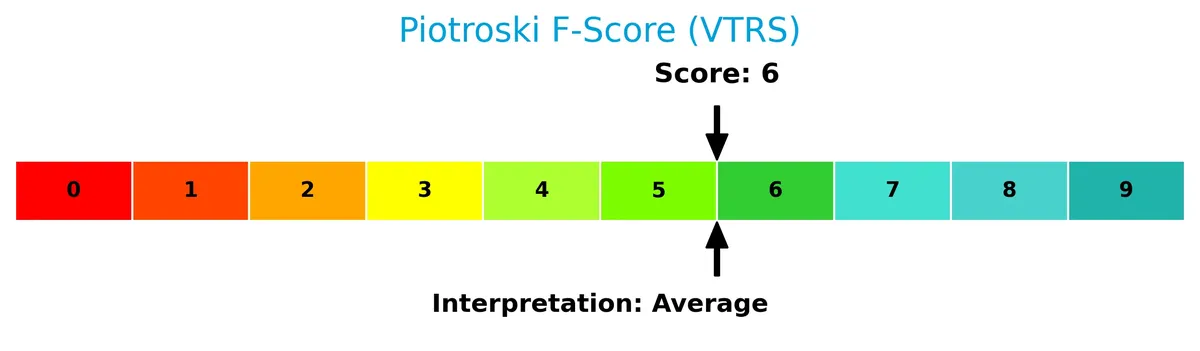
With a Piotroski Score of 6, the company shows average financial strength, suggesting some resilience but also areas requiring improvement to reach a strong health profile.
Competitive Landscape & Sector Positioning
This section examines Viatris Inc.’s strategic positioning, revenue breakdown, products, and competitors within the healthcare sector. I will analyze whether Viatris holds a competitive advantage compared to its main rivals.
Strategic Positioning
Viatris maintains a diversified product portfolio spanning brands, generics, complex generics, and biosimilars, with global geographic exposure across Developed Markets, Greater China, JANZ, and Emerging Markets. This multi-segment approach balances mature and growth regions, supporting resilience amid sector volatility.
Revenue by Segment
This pie chart illustrates Viatris Inc.’s revenue breakdown by product segment for the fiscal year 2025, highlighting contributions from Brands and Generics.
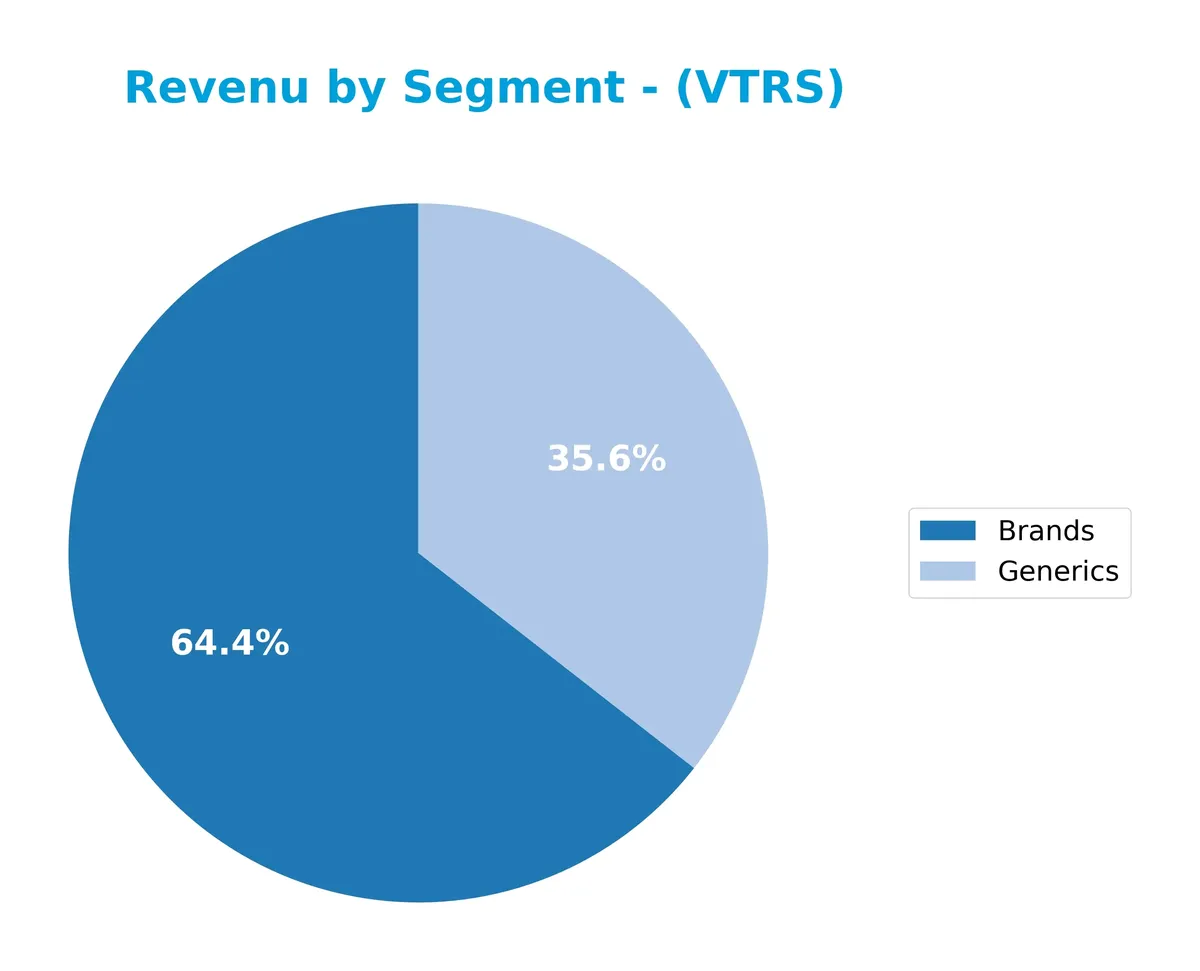
Brands lead Viatris’s revenue with $9.18B in 2025, slightly declining from previous years. Generics follow at $5.07B, showing a steady decrease since 2023. The absence of Complex GX and Biosimilars in 2025 marks a strategic shift or divestment. Overall, the business remains concentrated in Brands, but recent declines suggest caution on growth sustainability in both core segments.
Key Products & Brands
The table below outlines Viatris Inc.’s primary product categories and notable brand offerings:
| Product | Description |
|---|---|
| Brands | Prescription brand drugs including Lyrica, Lipitor, Creon, Influvac, Wixela Inhub, and EpiPen. |
| Generics | Generic drugs across various therapeutic areas for retail, pharmacy, and institutional clients. |
| Complex Generics and Biosimilars | Complex generic drugs and biosimilars in oncology, immunology, endocrinology, and other fields. |
| Active Pharmaceutical Ingredients (APIs) | APIs for antibacterial, CNS agents, cardiovascular, antivirals, antidiabetics, and more. |
| Support Services | Diagnostic clinics, educational seminars, and digital health management tools for patients. |
Viatris maintains a diverse portfolio spanning branded pharmaceuticals, generics, complex generics, and biosimilars. Its broad therapeutic coverage and extensive API offerings support a global healthcare footprint.
Main Competitors
There are 2 competitors in total, with the table below listing the top 10 leaders by market capitalization:
| Competitor | Market Cap. |
|---|---|
| Zoetis Inc. | 55.5B |
| Viatris Inc. | 14.4B |
Viatris ranks 2nd among its competitors in the Drug Manufacturers – Specialty & Generic sector. Its market cap is 31.65% of the leader Zoetis Inc. Viatris sits below both the average market cap of the top 10 competitors (35B) and the sector median (35B). It trails Zoetis by a wide margin, with a 215.93% gap to the next competitor above.
Comparisons with competitors
Check out how we compare the company to its competitors:
Does Viatris have a competitive advantage?
Viatris does not present a competitive advantage, as it is consistently destroying value with a very unfavorable ROIC compared to WACC and a sharply declining profitability trend. Its negative net margin and shrinking revenues reflect challenges in sustaining economic profits amid sector pressures.
Looking ahead, Viatris operates across diverse markets with a broad portfolio including biosimilars and complex generics, offering potential growth in emerging regions and therapeutic areas. However, historical declines suggest cautious monitoring of execution risks in expanding new products and markets.
SWOT Analysis
This SWOT analysis highlights Viatris Inc.’s core internal strengths and weaknesses alongside its external opportunities and threats in the pharmaceutical sector.
Strengths
- diversified global presence
- strong portfolio of generic and biosimilar drugs
- favorable dividend yield of 3.85%
Weaknesses
- declining revenue and profitability
- negative ROIC indicating value destruction
- weak net margin at -24.58%
Opportunities
- expansion in emerging markets
- growth in biosimilars and specialty drugs
- strategic collaborations with biotech firms
Threats
- intense pricing pressure in generics
- regulatory risks in multiple jurisdictions
- high competition from branded and generic peers
Viatris faces significant profitability challenges and value erosion despite its diversified operations and solid dividend. Strategic focus on emerging markets and biosimilars is essential to reverse negative trends and mitigate competitive threats.
Stock Price Action Analysis
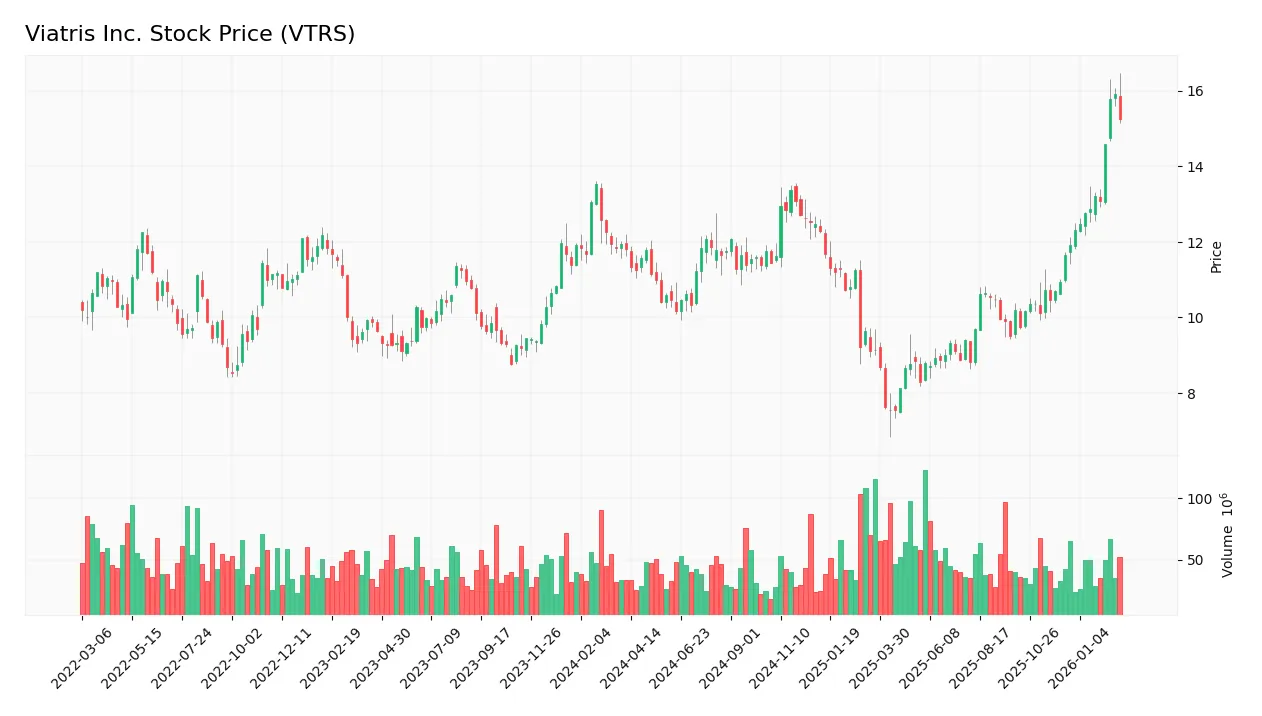
The weekly stock chart below illustrates Viatris Inc.’s price movements over the past 12 months, highlighting key highs and lows with clear upward momentum:
Trend Analysis
Over the past 12 months, VTRS gained 29.24%, confirming a bullish trend with accelerating momentum. The stock rose from a low of 7.54 to a high near 15.92. Volatility remains moderate, with a 1.66 standard deviation, supporting steady upward price movement.
Volume Analysis
Trading volume shows an increasing trend, with buyers controlling 51.03% overall and 83.32% in the recent three months. This strong buyer dominance signals robust market participation and positive investor sentiment toward VTRS.
Target Prices
Analysts project a moderate upside for Viatris Inc., reflecting cautious optimism amid sector challenges.
| Target Low | Target High | Consensus |
|---|---|---|
| 12 | 18 | 15.25 |
The target range suggests that analysts expect Viatris to trade between $12 and $18, with a consensus near $15.25, indicating balanced risk and reward expectations.

Don’t Let Luck Decide Your Entry Point
Optimize your entry points with our advanced ProRealTime indicators. You’ll get efficient buy signals with precise price targets for maximum performance. Start outperforming now!
Analyst & Consumer Opinions
This section examines Viatris Inc. (VTRS) through analyst ratings and consumer feedback to gauge market sentiment.
Stock Grades
Here is a detailed summary of Viatris Inc.’s recent analyst grades from recognized firms:
| Grading Company | Action | New Grade | Date |
|---|---|---|---|
| Piper Sandler | Maintain | Neutral | 2026-01-28 |
| Argus Research | Upgrade | Buy | 2026-01-16 |
| Jefferies | Maintain | Buy | 2025-03-07 |
| Piper Sandler | Maintain | Neutral | 2025-03-05 |
| Barclays | Maintain | Underweight | 2025-02-28 |
| B of A Securities | Maintain | Underperform | 2025-02-28 |
| Piper Sandler | Maintain | Neutral | 2024-12-06 |
| Barclays | Maintain | Underweight | 2024-11-08 |
| Piper Sandler | Maintain | Neutral | 2024-03-28 |
| Piper Sandler | Maintain | Neutral | 2023-11-22 |
The grades show a predominantly neutral to cautious stance, with Piper Sandler consistently maintaining a Neutral rating. Argus Research notably upgraded to Buy in early 2026, while Barclays and B of A Securities maintain a more bearish outlook with Underweight and Underperform grades. Overall, the consensus leans toward Hold.
Consumer Opinions
Viatris Inc. draws mixed reactions from consumers, reflecting its complex market position and product range.
| Positive Reviews | Negative Reviews |
|---|---|
| Wide variety of affordable generic medications | Customer service often slow to respond |
| Strong availability of essential drugs | Some complaints about delayed shipments |
| Competitive pricing compared to peers | Packaging inconsistencies reported |
Consumers appreciate Viatris’ broad product portfolio and cost-effective options. However, recurring issues with customer service and delivery reliability temper overall satisfaction.
Risk Analysis
Below is a summary of key risks facing Viatris Inc., detailing their likelihood and potential impact:
| Category | Description | Probability | Impact |
|---|---|---|---|
| Financial Health | Altman Z-Score in distress zone (0.81) signals high bankruptcy risk. | High | Severe |
| Profitability | Negative ROE (-23.89%) and net margin (-24.58%) indicate poor earnings. | High | High |
| Leverage & Coverage | Interest coverage at 0.0 shows inability to cover debt interest. | Moderate | High |
| Operational Efficiency | Low asset turnover (0.38) limits revenue generation from assets. | Moderate | Moderate |
| Market Volatility | Stock price dropped 5.16% recently, reflecting market sensitivity. | High | Moderate |
| Competitive Pressure | Operating in generic drugs with intense competition and pricing pressure. | Moderate | Moderate |
I observe that financial distress is the most critical threat. The Altman Z-Score below 1.8 warns of bankruptcy risk, especially combined with negative returns on equity and poor interest coverage. This weak financial foundation contrasts with a favorable current ratio, likely reflecting excess liquidity but also signaling inefficient capital use. Investors must weigh these risks carefully against Viatris’s market position and dividend yield of 3.85%, which offers some income cushion amid operational challenges.
Should You Buy Viatris Inc.?
Viatris Inc. appears to be facing substantial challenges, with a deteriorating moat and declining profitability suggesting value destruction. Despite a manageable liquidity profile, its leverage and returns indicate financial distress. The overall rating of C+ reflects a cautious analytical interpretation.
Strength & Efficiency Pillars
Viatris Inc. shows a gross margin of 35.06%, signaling solid operational efficiency in managing production costs. The company benefits from a favorable weighted average cost of capital (WACC) at 5.32%, which reflects relatively low capital costs. However, its return on invested capital (ROIC) stands at -6.87%, well below WACC, indicating value destruction rather than creation. Profitability metrics such as net margin (-24.58%) and return on equity (-23.89%) are unfavorable, highlighting challenges in translating revenue into profit.
Weaknesses and Drawbacks
Viatris is in the financial distress zone with an Altman Z-Score of 0.81, signaling a high bankruptcy risk. This solvency concern overrides other profitability metrics. The company faces significant valuation pressure with a negative P/E ratio (-4.15), complicating traditional earnings comparisons. Although the price-to-book ratio is favorable at 0.99, the current ratio of 5.06 is flagged as unfavorable, suggesting potential inefficiencies in asset utilization. Interest coverage is zero, underscoring strained capacity to meet debt obligations.
Our Final Verdict about Viatris Inc.
Despite some operational strengths like a solid gross margin, Viatris’s solvency risk reflected in its low Altman Z-Score makes its investment profile highly speculative. The balance sheet vulnerability and value destruction signal that the company might be too risky for conservative capital. Investors should approach with caution, as financial distress overshadows potential improvements in market activity or revenue trends.
Disclaimer: This content is for informational purposes only and does not constitute financial, investment, or other professional advice. Investing in financial markets involves a significant risk of loss, and past performance is not indicative of future results.
Additional Resources
- Viatris Reports Fourth-Quarter and Full-Year 2025 Financial Results – PR Newswire (Feb 26, 2026)
- Decoding Viatris Inc (VTRS): A Strategic SWOT Insight – GuruFocus (Feb 27, 2026)
- Viatris (VTRS) Q4 Earnings: Taking a Look at Key Metrics Versus Estimates – Yahoo Finance (Feb 26, 2026)
- Viatris Posts Narrower Loss In Q4; Expects Workforce Reduction Of Up To Approx. 10% – Nasdaq (Feb 26, 2026)
- Viatris beats on Q4; eyes 10% staff reduction (VTRS:NASDAQ) – Seeking Alpha (Feb 26, 2026)
For more information about Viatris Inc., please visit the official website: viatris.com