Home > Analyses > Communication Services > Verizon Communications Inc.
Verizon powers the connections that weave through daily life, from smartphones to smart cities. It dominates U.S. telecommunications, offering robust wireless plans and cutting-edge broadband services. Known for its expansive network and steady innovation, Verizon shapes how consumers and businesses communicate worldwide. As the sector evolves rapidly, I question whether Verizon’s solid fundamentals still justify its sizeable market valuation and growth prospects in 2026.

Table of contents
Business Model & Company Overview
Verizon Communications Inc., founded in 1983 and headquartered in New York City, dominates the telecommunications services sector. It delivers a comprehensive ecosystem of communications, technology, and entertainment products to consumers, businesses, and governments. Verizon’s integrated portfolio spans wireless connectivity, broadband, and video services, reinforcing its role as a critical infrastructure provider.
The company’s revenue engine balances robust wireless postpaid plans with residential fixed connectivity and enterprise solutions worldwide. It serves 115M wireless retail connections and millions more in broadband and video across the Americas, Europe, and Asia. Verizon’s competitive advantage lies in its vast network scale and diversified service mix, securing a durable moat in a capital-intensive industry.
Financial Performance & Fundamental Metrics
I will analyze Verizon Communications Inc.’s income statement, key financial ratios, and dividend payout policy to assess its fundamental strength and shareholder value.
Income Statement
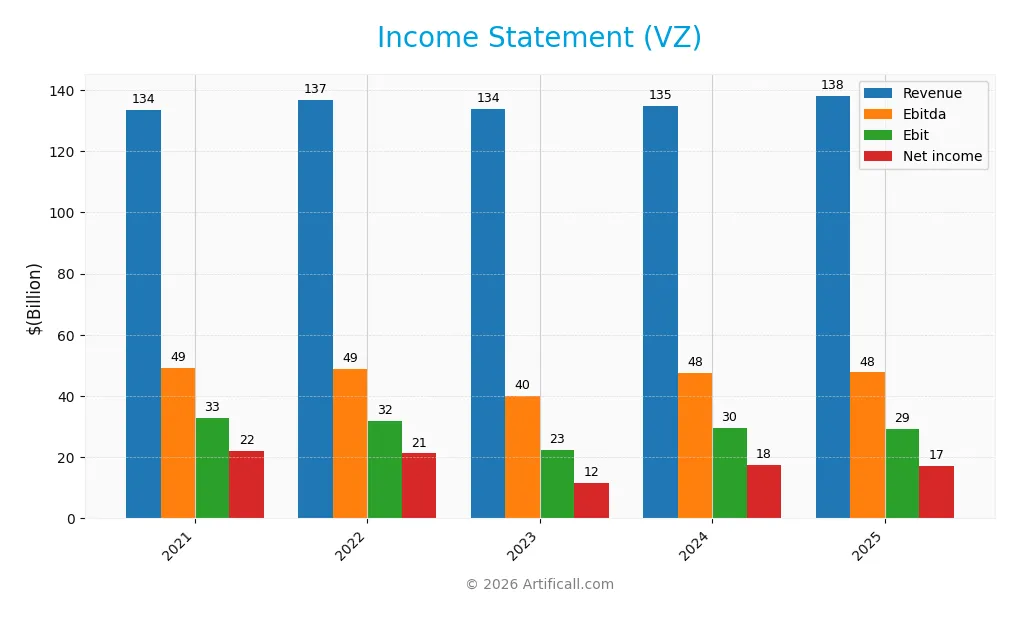
Below is Verizon Communications Inc.’s income statement summary for fiscal years 2021 through 2025, reflecting key profitability and expense figures.
| 2021 | 2022 | 2023 | 2024 | 2025 | |
|---|---|---|---|---|---|
| Revenue | 133.6B | 136.8B | 134.0B | 134.8B | 138.2B |
| Cost of Revenue | 72.5B | 76.2B | 72.5B | 71.9B | 75.1B |
| Operating Expenses | 29.1B | 30.1B | 32.6B | 32.2B | 33.8B |
| Gross Profit | 61.1B | 60.6B | 61.5B | 62.8B | 63.1B |
| EBITDA | 49.1B | 48.9B | 40.1B | 47.5B | 47.7B |
| EBIT | 32.9B | 31.9B | 22.5B | 29.6B | 29.4B |
| Interest Expense | 3.5B | 3.6B | 5.5B | 6.7B | 6.7B |
| Net Income | 22.1B | 21.3B | 11.6B | 17.5B | 17.2B |
| EPS | 5.32 | 5.06 | 2.76 | 4.15 | 4.06 |
| Filing Date | 2022-02-11 | 2023-02-10 | 2024-02-09 | 2025-02-12 | 2026-02-17 |
Income Statement Evolution
Verizon’s revenue rose modestly by 2.5% in 2025 but showed only 3.4% growth over 2021-2025, reflecting sector maturity. Gross margin remained stable near 45.6%, signaling consistent cost control. However, EBIT and net margins declined, with net margin shrinking by 24.7% over the period, indicating pressure on profitability despite steady revenue.
Is the Income Statement Favorable?
The 2025 income statement reveals mixed fundamentals. While Verizon maintains favorable gross (45.6%) and EBIT (21.3%) margins, net income dropped 4.3% year-over-year to $17.2B, with net margin at 12.4%. Interest expense remains manageable at 4.8%. Overall, the income statement shows signs of margin compression and earnings decline, suggesting unfavorable underlying trends.
Financial Ratios
Below is a summary of key financial ratios for Verizon Communications Inc. over the last five fiscal years:
| Ratios | 2021 | 2022 | 2023 | 2024 | 2025 |
|---|---|---|---|---|---|
| Net Margin | 17% | 16% | 9% | 13% | 12% |
| ROE | 27% | 23% | 13% | 18% | 16% |
| ROIC | 7% | 7% | 6% | 7% | 6% |
| P/E | 9.8x | 7.8x | 13.7x | 9.6x | 10.0x |
| P/B | 2.6x | 1.8x | 1.7x | 1.7x | 1.6x |
| Current Ratio | 0.78 | 0.75 | 0.69 | 0.63 | 0.91 |
| Quick Ratio | 0.71 | 0.71 | 0.65 | 0.59 | 0.87 |
| D/E | 2.2x | 1.9x | 1.9x | 1.7x | 1.9x |
| Debt-to-Assets | 49% | 46% | 46% | 44% | 50% |
| Interest Coverage | 9.1x | 8.5x | 5.2x | 4.6x | 4.4x |
| Asset Turnover | 0.36 | 0.36 | 0.35 | 0.35 | 0.34 |
| Fixed Asset Turnover | 1.05 | 1.02 | 1.01 | 1.01 | 1.04 |
| Dividend Yield | 4.8% | 6.5% | 6.9% | 6.7% | 6.7% |
All figures are rounded for clarity.
Evolution of Financial Ratios
Verizon’s Return on Equity (ROE) shows a declining trend from 27% in 2021 to around 16% in 2025, indicating reduced profitability. The Current Ratio fluctuated below 1, signaling tight liquidity with slight improvement to 0.91 in 2025. The Debt-to-Equity Ratio increased from 2.18 in 2021 to 1.92 in 2025, reflecting persistent leverage but a modest decrease.
Are the Financial Ratios Fovorable?
In 2025, Verizon’s profitability metrics remain generally favorable, with a 12.4% net margin and 16.4% ROE outperforming many peers. Liquidity ratios, especially the current ratio at 0.91, are unfavorable, suggesting potential short-term stress. Leverage is high with a 1.92 debt-to-equity ratio, rated unfavorable. Asset turnover is low at 0.34, signaling efficiency concerns. Dividend yield is neutral at 6.67%, reflecting steady shareholder returns. Overall, ratios are slightly favorable.
Shareholder Return Policy
Verizon maintains a steady dividend policy, with a payout ratio around 67% and a dividend yield near 6.7% in 2025. Dividend payments are supported by free cash flow, while share buybacks also contribute to shareholder returns, reflecting balanced capital allocation.
The payout consistency supports sustainable long-term value creation, though a payout ratio above 60% warrants monitoring for potential distribution risks. Overall, Verizon’s combined dividends and buybacks align with prudent shareholder return management amid its capital-intensive industry.
Score analysis
This radar chart highlights Verizon Communications Inc.’s key financial scores for insightful evaluation:
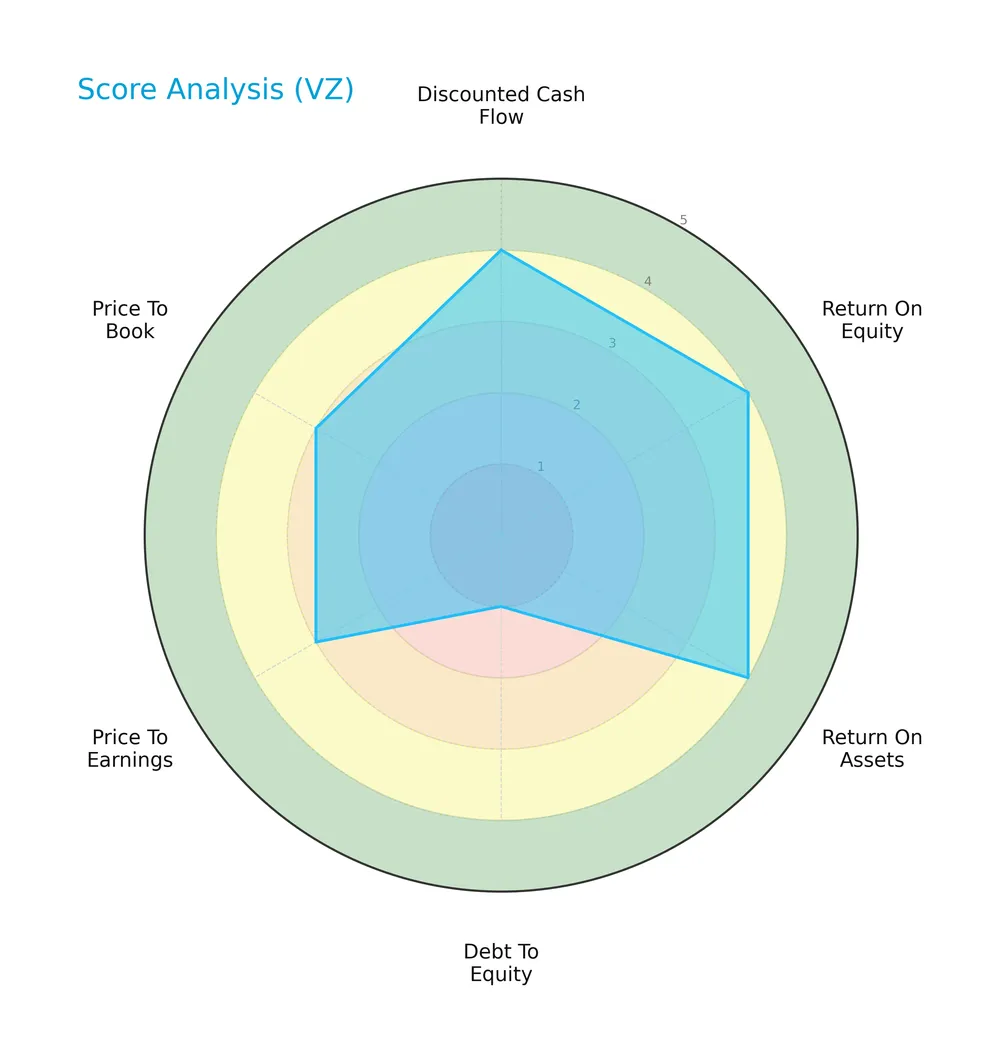
Verizon scores favorably on discounted cash flow, ROE, and ROA with 4s, indicating solid profitability and valuation metrics. However, its debt-to-equity score is very unfavorable at 1, signaling high leverage risk. Price-to-earnings and price-to-book ratios sit at moderate levels of 3.
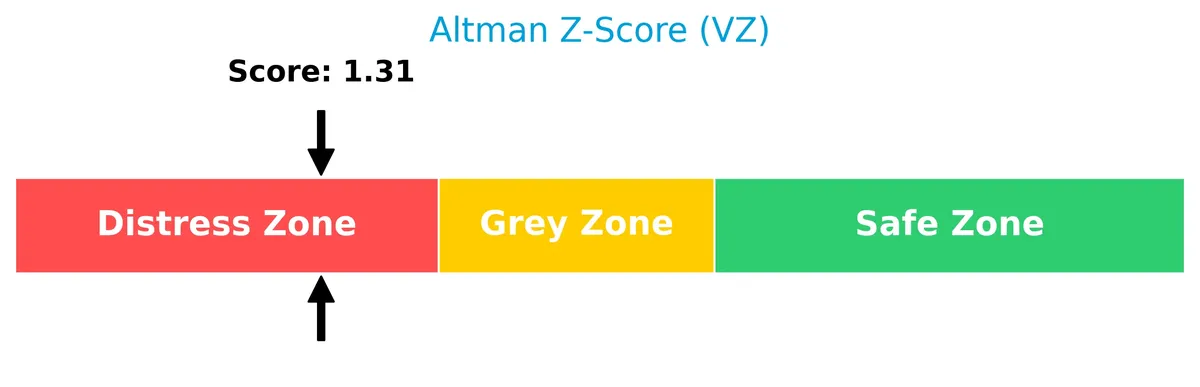
Analysis of the company’s bankruptcy risk
Verizon’s Altman Z-Score places it in the distress zone, indicating elevated bankruptcy risk and financial vulnerability:
Is the company in good financial health?
The following Piotroski diagram illustrates Verizon’s financial strength based on nine key criteria:
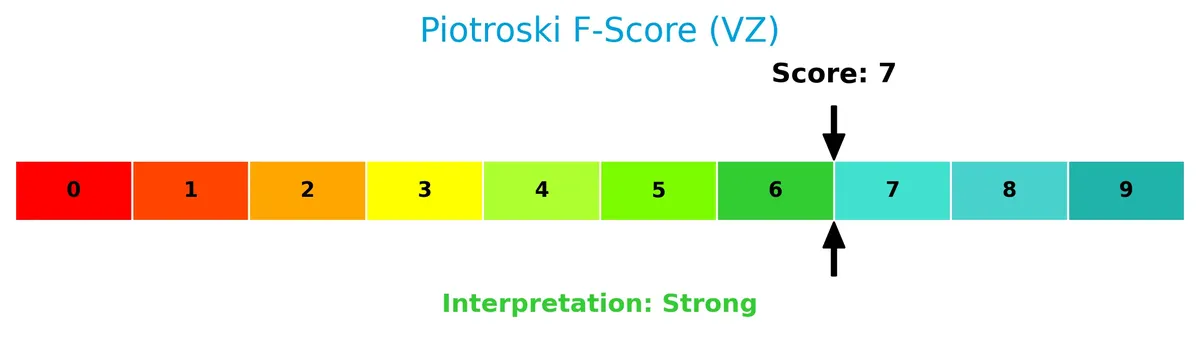
With a Piotroski score of 7, Verizon demonstrates strong financial health, reflecting robust profitability, efficient capital use, and solid operational performance despite leverage concerns.
Competitive Landscape & Sector Positioning
This section analyzes Verizon Communications Inc.’s strategic positioning, revenue segments, key products, and main competitors. I will evaluate whether Verizon holds a competitive advantage over its peers in the telecommunications sector.
Strategic Positioning
Verizon concentrates its revenue predominantly in the Consumer segment, generating $107B in 2025, while the Business segment contributes $29B. Its product portfolio spans wireless, wireline broadband, and IoT services, focusing on the U.S. market with extensive coverage and diversified telecom offerings.
Revenue by Segment
The pie chart illustrates Verizon Communications Inc.’s revenue distribution by segment for fiscal year 2025, highlighting the relative size of its main business units.
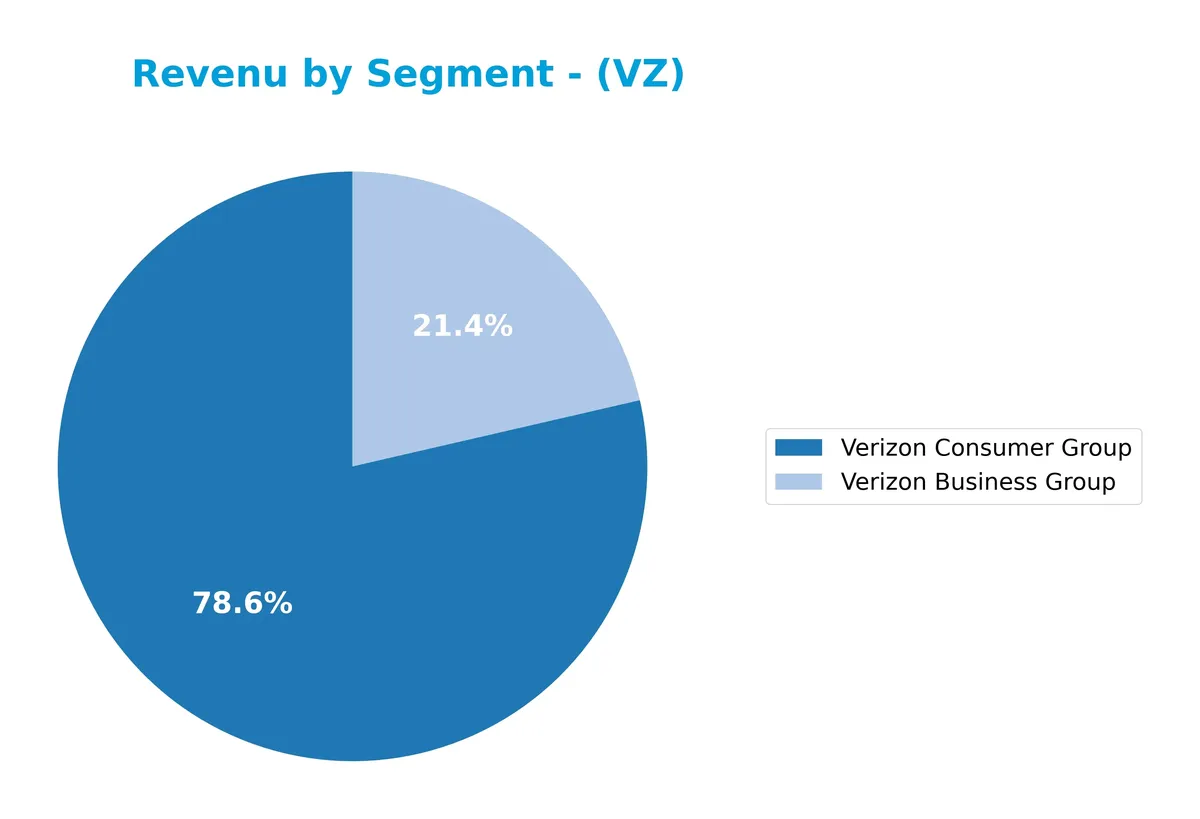
Verizon Consumer Group leads with $107B, underscoring its dominant role in driving overall revenue. Verizon Business Group contributes $29B, showing a modest decline from prior years. Notably, the absence of “Corporate And Other” in 2025 suggests segment reclassification or reduced impact. The Consumer segment’s steady growth signals sustained demand, while Business segment revenues face pressure, raising concentration risk on consumer-facing operations.
Key Products & Brands
The table below summarizes Verizon Communications Inc.’s key products and brands across consumer and business segments:
| Product | Description |
|---|---|
| Consumer Wireless Services | Postpaid and prepaid plans, smartphones, tablets, wireless-enabled internet devices, smart watches, and related wireless equipment. |
| Residential Fixed Connectivity | Internet, video, and voice services delivered via wired connections, including Fios video and broadband services. |
| Business Network Connectivity | Private networking, cloud connectivity, virtual and software-defined networking, and internet access services for businesses. |
| Business Voice & Collaboration | Internet protocol-based voice and video services, unified communications, collaboration tools, and contact center solutions. |
| Business Security & Management Services | Data security, management services, and customer premises equipment tailored for business clients. |
| Internet of Things (IoT) Products | IoT devices and services supporting connected business solutions. |
Verizon’s product portfolio spans a broad telecommunications spectrum. The Consumer segment drives the majority of revenue with wireless and fixed connectivity. The Business segment focuses on advanced network services and security solutions, reflecting a balanced, diversified telecom offering.
Main Competitors
There are 5 competitors in the Telecommunications Services industry, with the table below showing the top 5 leaders by market capitalization:
| Competitor | Market Cap. |
|---|---|
| T-Mobile US, Inc. | 223B |
| AT&T Inc. | 174B |
| Verizon Communications Inc. | 171B |
| Comcast Corporation | 108B |
| Charter Communications, Inc. | 29B |
Verizon Communications Inc. ranks 3rd among its peers. Its market cap stands at 92.41% of the leader, T-Mobile US. Verizon is positioned above both the average market cap of the top 10 competitors (140.96B) and the sector median (170.85B). The company maintains a 15.67% gap below the next competitor above, highlighting a solid mid-tier placement in the sector.
Comparisons with competitors
Check out how we compare the company to its competitors:
Does Verizon have a competitive advantage?
Verizon presents a slight competitive advantage, creating value with an ROIC 2.3% above WACC, despite a declining profitability trend. Its strong gross margin of 45.6% supports operational efficiency.
Looking ahead, Verizon’s diverse product portfolio—including wireless, broadband, and IoT services—positions it to capitalize on evolving technology demands and expand in business connectivity and consumer markets.
SWOT Analysis
This SWOT analysis highlights Verizon Communications Inc.’s key strategic factors to guide investment decisions.
Strengths
- strong brand and market presence
- solid net margin at 12.43%
- favorable ROE at 16.44%
Weaknesses
- declining ROIC trend
- high debt-to-equity ratio at 1.92
- unfavorable current ratio at 0.91
Opportunities
- growth in 5G and IoT markets
- expansion of business segment services
- potential cost optimization
Threats
- intense telecom competition
- regulatory pressures
- technology disruption risks
Verizon’s solid profitability and market position anchor its competitive moat. However, rising leverage and declining profitability trends demand careful capital management. Strategic focus on innovation and cost control will be critical to sustain growth amid sector headwinds.
Stock Price Action Analysis
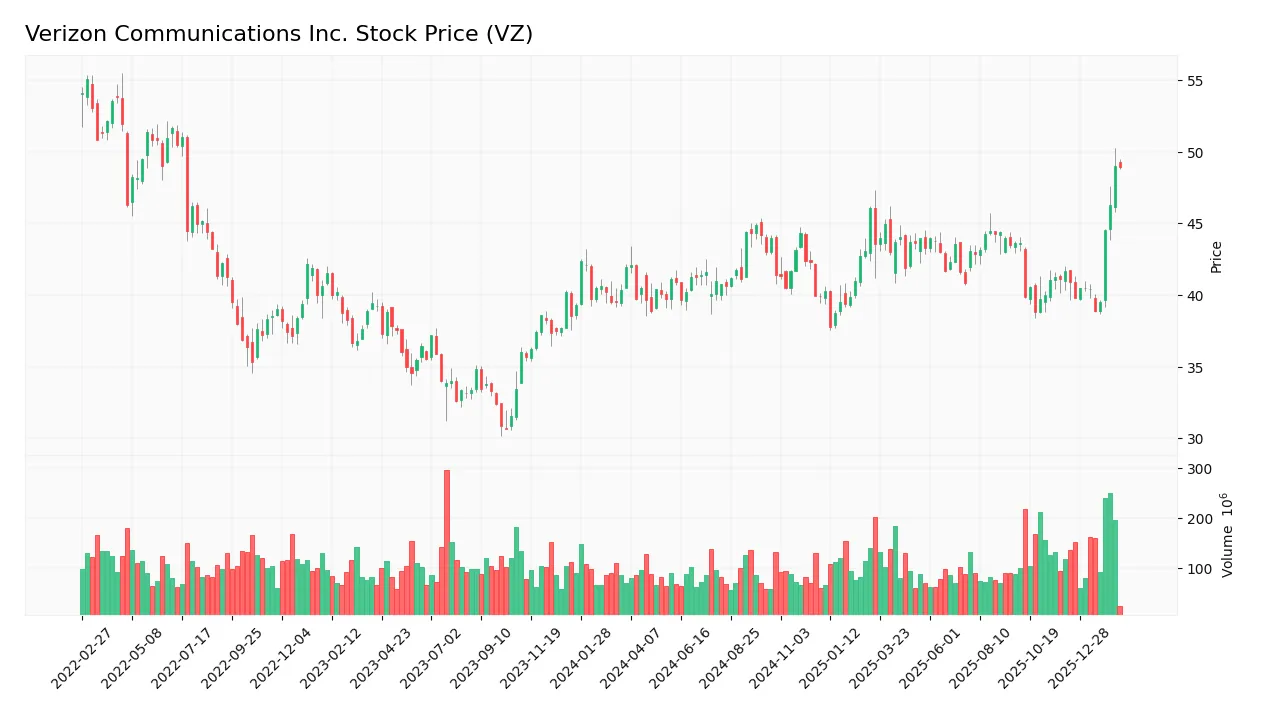
The weekly stock chart below illustrates Verizon Communications Inc.’s price movements and volatility over the past 12 weeks:
Trend Analysis
Over the past 12 weeks, Verizon’s stock price rose by 16.61%, marking a clear bullish trend with acceleration. The price fluctuated between a low of 37.81 and a high of 49.01, supported by a moderate volatility level at a 2.08% standard deviation.
Volume Analysis
Trading volume shows an increasing trend, with buyers dominating 54.12% of total activity overall. In the recent weeks, buyer dominance strengthened to 62.02%, indicating strong buyer-driven momentum and heightened investor participation. Seller activity remains less pronounced but still significant.
Target Prices
Analysts set a clear target consensus for Verizon Communications Inc. reflecting moderate upside potential.
| Target Low | Target High | Consensus |
|---|---|---|
| 44 | 54 | 48.28 |
The target range from 44 to 54 signals cautious optimism. The consensus of 48.28 suggests analysts expect steady performance without aggressive growth.

Don’t Let Luck Decide Your Entry Point
Optimize your entry points with our advanced ProRealTime indicators. You’ll get efficient buy signals with precise price targets for maximum performance. Start outperforming now!
Analyst & Consumer Opinions
This section examines Verizon Communications Inc.’s analyst ratings and consumer feedback to provide balanced insights.
Stock Grades
Here is the latest summary of Verizon Communications Inc. grades from leading financial institutions as of early 2026:
| Grading Company | Action | New Grade | Date |
|---|---|---|---|
| RBC Capital | Maintain | Sector Perform | 2026-02-03 |
| Citigroup | Maintain | Buy | 2026-02-03 |
| JP Morgan | Maintain | Neutral | 2026-02-03 |
| Morgan Stanley | Maintain | Equal Weight | 2026-02-02 |
| Evercore ISI Group | Maintain | Outperform | 2026-02-02 |
| Wells Fargo | Maintain | Equal Weight | 2026-02-02 |
| Scotiabank | Maintain | Sector Perform | 2026-02-02 |
| Wells Fargo | Maintain | Equal Weight | 2026-01-26 |
| Bernstein | Maintain | Market Perform | 2026-01-16 |
| Morgan Stanley | Maintain | Equal Weight | 2025-12-10 |
The consensus reflects a stable outlook with no recent upgrades or downgrades. Most firms assign neutral or hold-equivalent ratings, indicating cautious confidence without strong conviction for a near-term price surge or decline.
Consumer Opinions
Verizon Communications Inc. consistently draws strong reactions from its user base, reflecting its market standing and service quality.
| Positive Reviews | Negative Reviews |
|---|---|
| Reliable network coverage, especially in rural areas | Customer service response times can be slow |
| Competitive pricing on bundled plans | Occasional billing errors reported by customers |
| Strong 5G rollout with fast data speeds | Limited flexibility in contract terms |
Overall, Verizon’s consumer feedback highlights robust network reliability and competitive pricing. However, customer service and billing issues remain recurring pain points, requiring management’s attention to sustain loyalty.
Risk Analysis
Below is a concise table outlining Verizon’s key risks, their likelihood, and potential impact:
| Category | Description | Probability | Impact |
|---|---|---|---|
| Leverage Risk | High debt-to-equity ratio (1.92) raises financial strain. | High | High |
| Liquidity Risk | Current ratio below 1 (0.91) signals tight short-term liquidity. | Medium | Medium |
| Bankruptcy Risk | Altman Z-Score at 1.31 places Verizon in the distress zone. | Medium | High |
| Market Volatility | Low beta (0.32) suggests limited stock price sensitivity. | Low | Medium |
| Competitive Risk | Telecom sector faces intense competition and rising costs. | Medium | Medium |
The most pressing risks are Verizon’s elevated leverage and low liquidity, reflected in its distress-zone Altman Z-Score. Despite solid profitability and a strong Piotroski score, heavy debt threatens financial flexibility. Investors must watch debt servicing closely amid industry headwinds.
Should You Buy Verizon Communications Inc.?
Verizon appears to be a moderately profitable firm with a slightly favorable moat supported by value-creating ROIC above WACC despite a declining trend. Its substantial leverage profile and Altman Z-score in distress zone suggest caution. The overall B+ rating implies a generally favorable, though nuanced, investment profile.
Strength & Efficiency Pillars
Verizon Communications Inc. posts solid profitability with a net margin of 12.43% and a return on equity (ROE) of 16.44%. Its return on invested capital (ROIC) at 6.22% comfortably exceeds its weighted average cost of capital (WACC) at 3.92%, confirming Verizon as a value creator. The company’s gross margin of 45.64% and EBIT margin of 21.25% underline operational efficiency despite a declining ROIC trend. These figures suggest Verizon maintains strong core business fundamentals amid evolving market conditions.
Weaknesses and Drawbacks
Verizon is in financial distress, evidenced by a concerning Altman Z-Score of 1.31, signaling a high bankruptcy risk. This solvency red flag overshadows its profitability metrics. Additionally, the company suffers from a high debt-to-equity ratio of 1.92 and a below-par current ratio of 0.91, indicating liquidity constraints. Modest valuation multiples, including a price-to-earnings ratio of 10.02 and price-to-book of 1.65, offer limited upside. These leverage and liquidity weaknesses warrant caution, especially under market volatility.
Our Final Verdict about Verizon Communications Inc.
Despite operational strengths and value creation, Verizon’s distressed financial status and solvency concerns make its investment profile highly speculative. The elevated bankruptcy risk compels prudence, overshadowing favorable margins and a bullish stock trend. Conservative investors may find Verizon too risky, while others might view it as a turnaround opportunity contingent on improved financial health.
Disclaimer: This content is for informational purposes only and does not constitute financial, investment, or other professional advice. Investing in financial markets involves a significant risk of loss, and past performance is not indicative of future results.
Additional Resources
- Verizon Communications Inc. (VZ) is Attracting Investor Attention: Here is What You Should Know – Yahoo Finance (Feb 17, 2026)
- Decoding Verizon Communications Inc (VZ): A Strategic SWOT Insig – GuruFocus (Feb 18, 2026)
- (02/18/26) Top Picks 2026: Verizon Communications Inc. (VZ) – moneyshow.com (Feb 18, 2026)
- NEOS Investment Management LLC Buys 178,825 Shares of Verizon Communications Inc. $VZ – MarketBeat (Feb 17, 2026)
- Verizon Communications Inc. (NYSE:VZ) Stock Rockets 26% But Many Are Still Ignoring The Company – simplywall.st (Feb 16, 2026)
For more information about Verizon Communications Inc., please visit the official website: verizon.com