Home > Analyses > Technology > Veritone, Inc.
Veritone, Inc. transforms how businesses extract value from data by powering artificial intelligence across diverse industries. Its flagship aiWARE platform integrates advanced machine learning models to unlock insights from audio, video, and text, reshaping media, government, and legal sectors. Known for innovation and a broad AI infrastructure, Veritone challenges traditional data processing. The key question remains: can its evolving fundamentals support sustainable growth and justify its current market valuation in a competitive tech landscape?

Table of contents
Business Model & Company Overview
Veritone, Inc. operates as a leading AI infrastructure provider, headquartered in Denver, Colorado. Founded in 2014, it commands a niche in the software infrastructure sector through its aiWARE platform. This AI operating system integrates advanced machine learning models and cognitive processes, delivering insights from complex structured and unstructured data. Veritone’s solutions form a cohesive ecosystem that serves media, government, legal, and energy sectors, reflecting its broad industry reach.
The company’s revenue engine balances software-driven AI services with media advertising agency offerings, targeting clients in the US and UK. Veritone monetizes through outbound sales and partnerships, delivering media planning, campaign analytics, and AI-based data solutions. Its strategic presence across key global markets underpins a durable economic moat, positioning it as a transformative force in AI-powered data intelligence.
Financial Performance & Fundamental Metrics
I analyze Veritone, Inc.’s income statement, key financial ratios, and dividend payout policy to assess its core financial health and shareholder value creation.
Income Statement
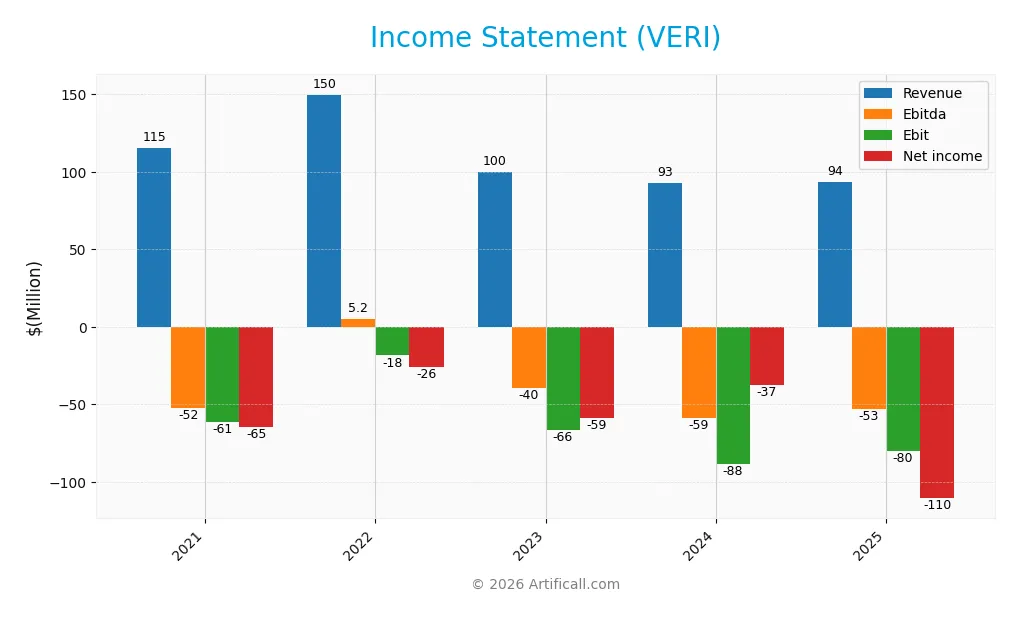
This table summarizes Veritone, Inc.’s key income statement metrics for fiscal years 2021 through 2025, reflecting the company’s financial performance and profitability trends.
| 2021 | 2022 | 2023 | 2024 | 2025 | |
|---|---|---|---|---|---|
| Revenue | 115.3M | 149.7M | 100.0M | 92.6M | 93.7M |
| Cost of Revenue | 22.1M | 27.4M | 27.8M | 27.3M | 29.7M |
| Operating Expenses | 154.5M | 160.3M | 171.8M | 153.6M | 144.1M |
| Gross Profit | 93.2M | 122.3M | 72.2M | 65.4M | 64.0M |
| EBITDA | -52.0M | 5.2M | -39.5M | -58.8M | -53.0M |
| EBIT | -61.4M | -18.4M | -66.3M | -88.1M | -80.2M |
| Interest Expense | 0.5M | 4.9M | 2.4M | 12.1M | 10.2M |
| Net Income | -64.7M | -25.6M | -58.6M | -37.4M | -110.5M |
| EPS | -1.94 | -0.71 | -1.59 | -0.98 | -1.75 |
| Filing Date | 2022-03-17 | 2023-03-16 | 2024-04-01 | 2025-04-01 | 2026-03-26 |
Income Statement Evolution
Veritone’s revenue declined 19% from 2021 to 2025, with a slight 1.15% increase in 2025. Gross profit contracted 2.1% last year but maintained a strong 68.3% margin. Operating expenses grew in line with revenue in 2025, while EBIT improved by 9%, yet all operating and net margins remain deeply negative.
Is the Income Statement Favorable?
In 2025, Veritone posted $93.7M revenue but a $110.5M net loss, reflecting an unfavorable net margin near -118%. Interest expense consumed nearly 11% of revenue, weighing heavily on profitability. Despite a solid gross margin, persistent operating losses and weak net income signal underlying structural challenges. The fundamentals are clearly unfavorable.
Financial Ratios
The following table presents key financial ratios for Veritone, Inc. over the past five fiscal years, highlighting profitability, valuation, liquidity, leverage, and efficiency metrics:
| Ratios | 2021 | 2022 | 2023 | 2024 | 2025 |
|---|---|---|---|---|---|
| Net Margin | -56.1% | -17.1% | -58.6% | -40.4% | -117.9% |
| ROE | -74.8% | -32.0% | -153.7% | -277.9% | 0 |
| ROIC | -18.8% | -16.3% | -48.6% | -58.3% | 0 |
| P/E | -11.6 | -7.5 | -1.1 | -3.3 | -2.7 |
| P/B | 8.65 | 2.39 | 1.75 | 9.27 | 0 |
| Current Ratio | 1.98 | 1.44 | 0.97 | 0.97 | 0 |
| Quick Ratio | 1.98 | 1.44 | 0.97 | 0.97 | 0 |
| D/E | 2.26 | 1.75 | 3.74 | 8.91 | 0 |
| Debt-to-Assets | 37.6% | 32.9% | 37.7% | 60.5% | 0 |
| Interest Coverage | -114.1 | -7.8 | -40.7 | -7.3 | -7.9 |
| Asset Turnover | 0.22 | 0.35 | 0.26 | 0.47 | 0 |
| Fixed Asset Turnover | 74.1 | 28.3 | 10.3 | 8.5 | 0 |
| Dividend Yield | 0 | 0 | 0 | 0 | 0 |
Evolution of Financial Ratios
Veritone’s Return on Equity (ROE) declined to zero by 2025, reflecting deteriorating profitability. The Current Ratio dropped sharply from 1.98 in 2021 to zero in 2025, indicating worsening liquidity. Debt-to-Equity Ratio showed volatility, peaking at 8.91 in 2024 before dropping to zero in 2025, signaling fluctuating leverage and financial structure instability.
Are the Financial Ratios Favorable?
The 2025 ratios present an unfavorable financial profile overall. Profitability metrics, including net margin and ROE, remain negative or zero, signaling losses. Liquidity ratios are critically low at zero, highlighting potential short-term financial stress. Leverage ratios like debt-to-equity show improvement but reflect unusual reporting. Valuation metrics such as price-to-earnings are favorable, yet the majority of key ratios indicate financial weakness and elevated risk.
Shareholder Return Policy
Veritone, Inc. does not pay dividends, reflecting its negative net income and ongoing investment phase. The company prioritizes reinvestment in growth and innovation to build long-term shareholder value. No share buyback programs are currently reported.
This approach aligns with Veritone’s strategy to sustain future profitability despite present losses. However, investors should monitor profitability trends closely, as lack of distributions shifts value creation entirely onto operational success and capital appreciation.
Score analysis
The radar chart below illustrates Veritone, Inc.’s key financial scores across valuation, profitability, and leverage metrics:
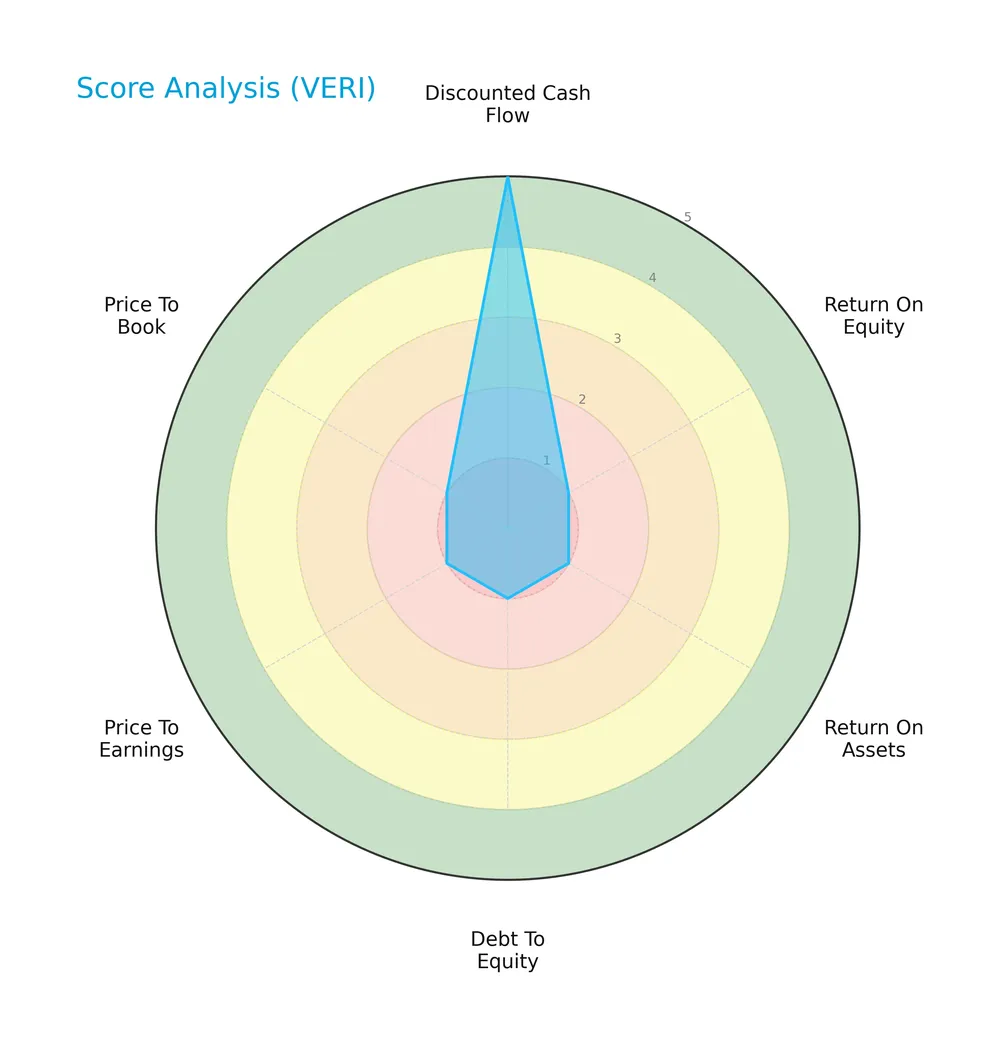
Veritone scores very favorably on discounted cash flow with a 5, indicating strong intrinsic value. However, it struggles with profitability and valuation ratios, each scoring 1, reflecting weak returns and expensive multiples. The debt-to-equity score of 1 signals high leverage risk.
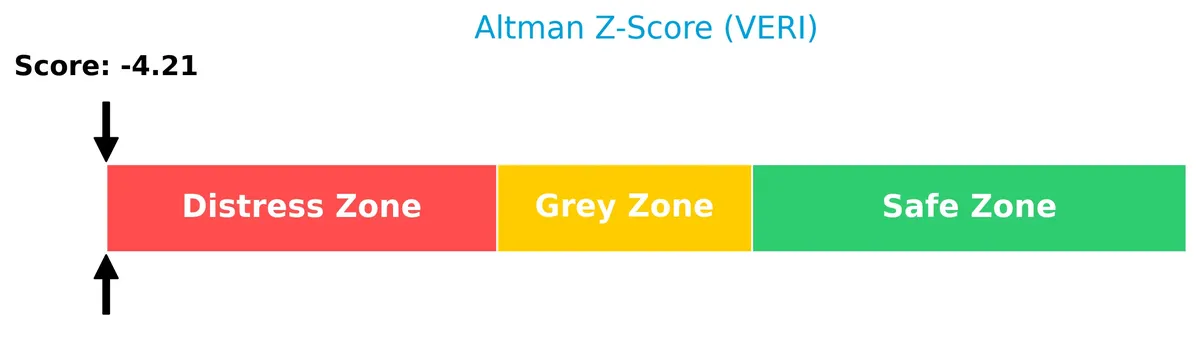
Analysis of the company’s bankruptcy risk
Veritone’s Altman Z-Score places it firmly in the distress zone, highlighting a significant risk of financial distress and potential bankruptcy:
Is the company in good financial health?
The Piotroski Score diagram presents Veritone’s financial strength based on nine key criteria:
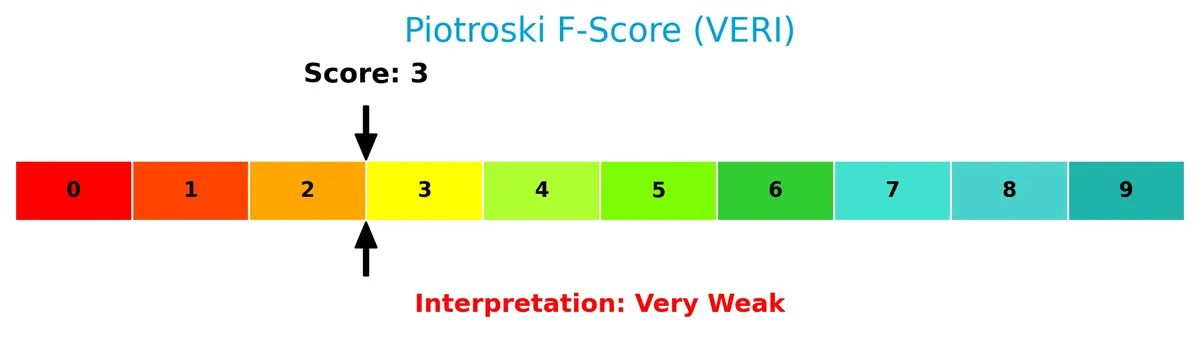
With a Piotroski Score of 3, Veritone’s financial health is very weak. This low score indicates poor profitability, liquidity, and efficiency metrics, suggesting limited fundamental strength at this time.
Competitive Landscape & Sector Positioning
This section reviews Veritone, Inc.’s strategic positioning, revenue streams, and key products within the software infrastructure sector. I will evaluate whether Veritone holds a competitive advantage over its main competitors.
Strategic Positioning
Veritone concentrates on AI-driven software and managed services, with significant revenue from advertising and licensing. Its geographic focus is primarily the US and UK, targeting media, government, and compliance sectors. This focused portfolio aligns with its AI operating system specialization.
Revenue by Segment
This pie chart illustrates Veritone, Inc.’s revenue distribution by segment for fiscal year 2024, highlighting the relative contribution of License, Managed Services, and Software Products and Services.
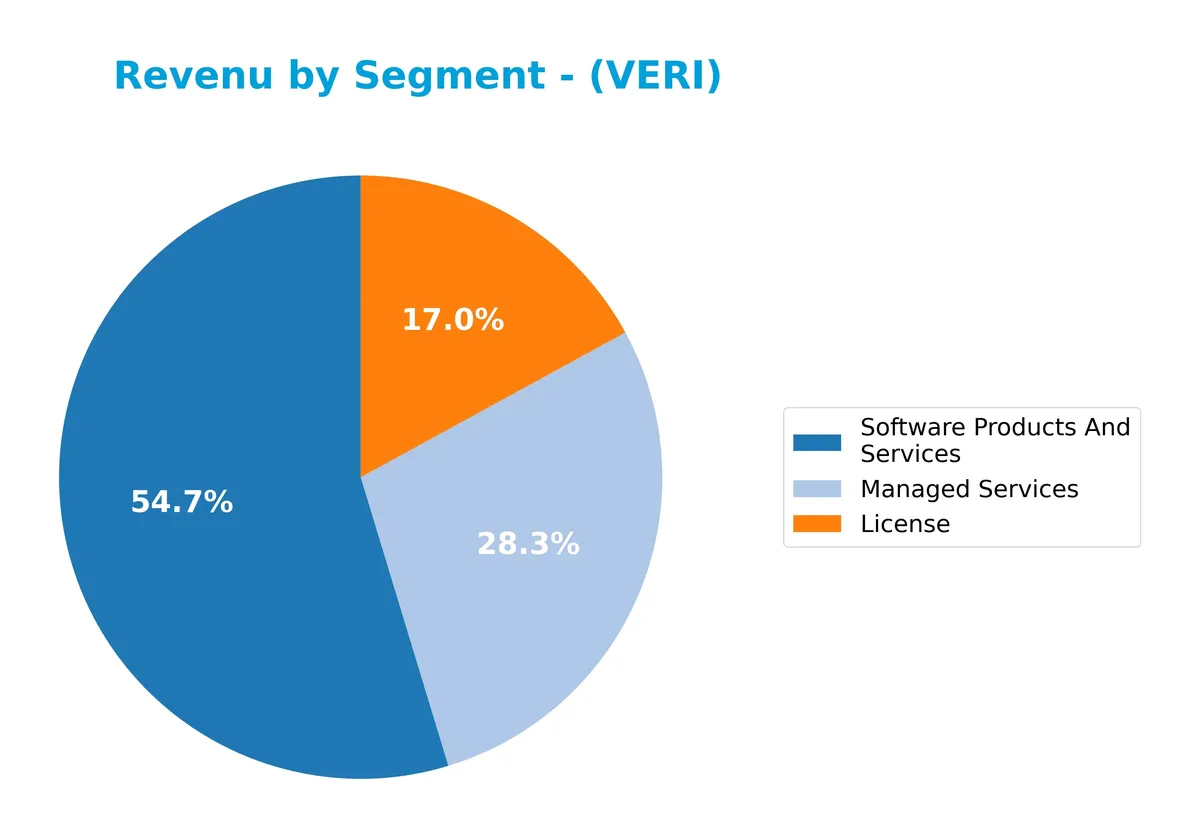
In 2024, Software Products and Services lead with $61M, followed by Managed Services at $31.6M, and License at $19M. This reflects a shift from 2023 where Advertising generated $38.8M but dropped out in 2024. The concentration now favors software and managed services, signaling a strategic pivot towards recurring and scalable revenue streams. This may reduce volatility but raises dependency risk on core product innovation.
Key Products & Brands
The following table summarizes Veritone, Inc.’s main products and brands with their core functionalities:
| Product | Description |
|---|---|
| aiWARE Platform | AI operating system using machine learning for perception, prediction, transcription, recognition, and cognitive tasks. |
| Software Products and Services | Includes aiWARE and related AI computing solutions across multiple industries. |
| Managed Services | Services supporting AI deployment and operation, tailored for diverse verticals including government and media. |
| Advertising | Media planning, buying, placement, campaign messaging, and analytics for advertisers and agencies. |
| License | Licensing of AI technology and software products to clients. |
Veritone’s portfolio centers on its aiWARE platform, combining AI-driven software products with managed services and advertising solutions. Licensing complements these offerings, enabling broad market reach.
Main Competitors
The Technology sector counts 32 competitors; here are the top 10 leaders by market capitalization:
| Competitor | Market Cap. |
|---|---|
| Microsoft Corporation | 3.52T |
| Oracle Corporation | 553B |
| Palantir Technologies Inc. | 383B |
| Adobe Inc. | 140B |
| Palo Alto Networks, Inc. | 120B |
| CrowdStrike Holdings, Inc. | 113B |
| Synopsys, Inc. | 92B |
| Cloudflare, Inc. | 69B |
| Fortinet, Inc. | 59B |
| Block, Inc. | 40B |
Veritone, Inc. ranks 32nd among 32 competitors, with a market cap effectively negligible compared to the leader. It sits well below both the average market cap of the top 10 (508B) and the sector median (19B). The company’s market cap trails the next closest competitor by a substantial 268%, highlighting its marginal scale within this highly concentrated sector.
Comparisons with competitors
Check out how we compare the company to its competitors:
Does VERI have a competitive advantage?
Veritone, Inc. does not present a clear competitive advantage based on available data. Its financials show unfavorable net and EBIT margins, with revenue growth lagging sector norms.
The company’s AI platform and diversified vertical markets offer growth potential. Expansion into new AI applications and media services could improve its future market position.
SWOT Analysis
This analysis highlights Veritone, Inc.’s key internal and external factors to guide strategic decisions.
Strengths
- advanced AI platform with diverse applications
- strong gross margin at 68.3%
- growing ROIC trend
Weaknesses
- severe net losses with -117.93% net margin
- weak liquidity ratios (current and quick ratio at 0)
- very weak Altman Z-score and Piotroski score
Opportunities
- expanding AI adoption in media and government sectors
- potential to improve operational efficiency
- growing demand for AI-driven analytics
Threats
- intense competition in AI software infrastructure
- high volatility with beta of 2.29
- ongoing financial distress risk reflected by negative interest coverage
Veritone’s strengths in AI technology and gross margins are overshadowed by poor profitability and liquidity. The company must focus on stabilizing finances and leveraging AI market growth to survive competitive and financial headwinds.
Stock Price Action Analysis
The weekly stock chart below illustrates Veritone, Inc.’s price movements and volatility over the past 12 months:
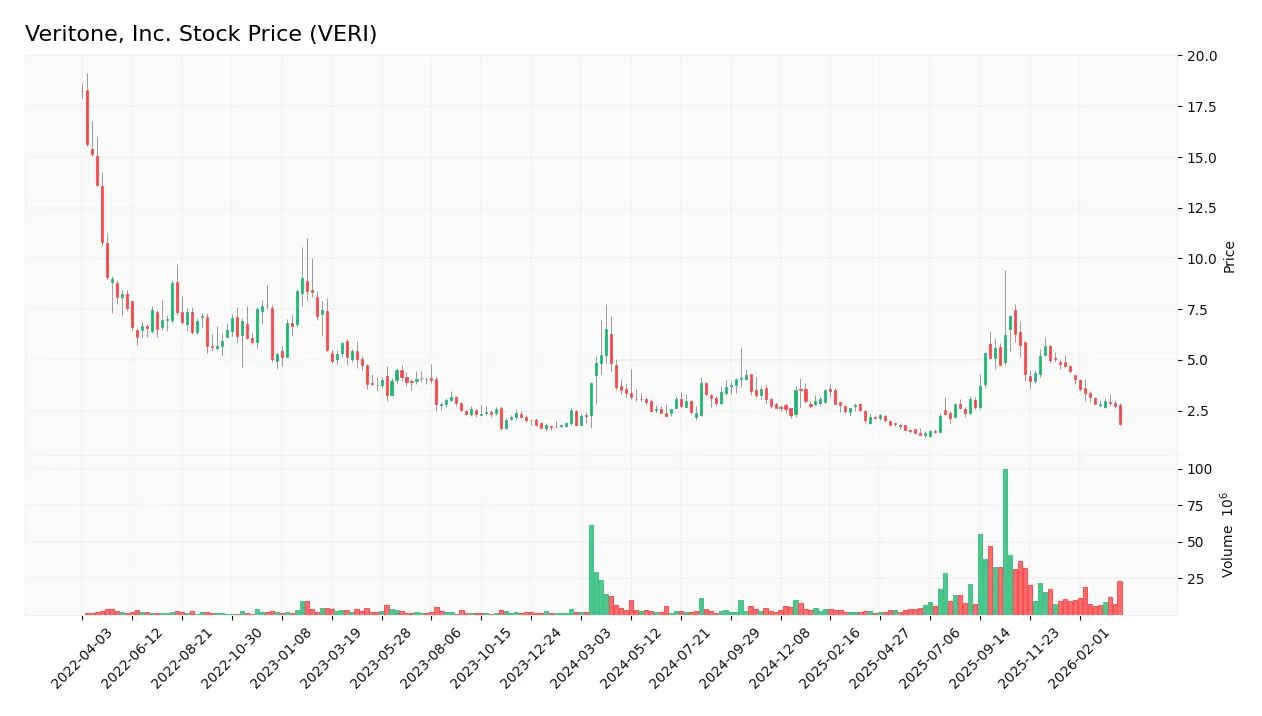
Trend Analysis
Over the past 12 months, Veritone, Inc. stock declined sharply by 45.24%, signaling a clear bearish trend. The price decelerated with volatility measured at 1.17, hitting a high of 7.18 and a low of 1.3. Recent months accelerated the downtrend with a 60.77% drop and a gentler slope of -0.21.
Volume Analysis
Trading volume has increased overall, with buyers accounting for 53.01% of total activity historically. However, in the recent three months, sellers dominated with only 6.56% buyer volume, suggesting bearish sentiment and heightened selling pressure. Market participation appears strong but skewed toward liquidation.
Target Prices
Analysts set a clear target consensus for Veritone, Inc., reflecting moderate confidence in its near-term valuation.
| Target Low | Target High | Consensus |
|---|---|---|
| 9 | 10 | 9.5 |
The target range between $9 and $10 suggests analysts expect modest upside from current levels, with a balanced outlook on growth prospects.

Don’t Let Luck Decide Your Entry Point
Optimize your entry points with our advanced ProRealTime indicators. You’ll get efficient buy signals with precise price targets for maximum performance. Start outperforming now!
Analyst & Consumer Opinions
This section examines Veritone, Inc.’s recent analyst ratings alongside consumer feedback and sentiment trends.
Stock Grades
Here are the latest verified analyst grades for Veritone, Inc. from recognized financial firms:
| Grading Company | Action | New Grade | Date |
|---|---|---|---|
| D. Boral Capital | Maintain | Buy | 2026-03-27 |
| D. Boral Capital | Maintain | Buy | 2026-03-17 |
| D. Boral Capital | Maintain | Buy | 2026-03-03 |
| D. Boral Capital | Maintain | Buy | 2026-02-11 |
| D. Boral Capital | Maintain | Buy | 2026-01-30 |
| D. Boral Capital | Maintain | Buy | 2025-12-09 |
| D. Boral Capital | Maintain | Buy | 2025-12-04 |
| D. Boral Capital | Maintain | Buy | 2025-12-02 |
| Needham | Maintain | Buy | 2025-12-02 |
| D. Boral Capital | Maintain | Buy | 2025-11-07 |
The grades show a consistent “Buy” consensus with no changes over several months, reflecting steady analyst confidence. Notably, D. Boral Capital repeatedly maintains a buy rating, underscoring stable positive sentiment.
Consumer Opinions
Veritone, Inc. draws a mix of praise and criticism from its users, reflecting both its innovative edge and operational challenges.
| Positive Reviews | Negative Reviews |
|---|---|
| “Impressive AI capabilities that improve workflow efficiency significantly.” | “Customer support response times can be slow and frustrating.” |
| “The platform integrates well with multiple data sources, boosting productivity.” | “Pricing is steep for small to mid-sized businesses.” |
| “Constant updates and feature additions keep the software competitive.” | “Occasional glitches disrupt real-time data processing.” |
Overall, consumers applaud Veritone’s cutting-edge AI and integration strengths. However, recurring concerns include service reliability and high costs, which may hinder broader adoption.
Risk Analysis
Below is a summary of key risks affecting Veritone, Inc., highlighting their likelihood and potential impact:
| Category | Description | Probability | Impact |
|---|---|---|---|
| Financial Health | Negative net margin (-118%) and negative Altman Z-Score (-4.21) indicate high bankruptcy risk. | High | Severe |
| Liquidity | Current and quick ratios are zero, signaling poor short-term liquidity and operational strain. | High | High |
| Profitability | Zero ROE and ROIC reflect failure to generate returns above cost of capital. | High | High |
| Market Volatility | Beta of 2.29 shows stock price swings well above market average, increasing investment risk. | Medium | Moderate |
| Debt Management | Favorable debt-to-equity and debt-to-assets ratios suggest low leverage risk. | Low | Low |
| Operational Risk | Declining price (-29.5%) and high volume volatility expose sensitivity to market sentiment. | High | Moderate |
Veritone faces severe financial distress with an Altman Z-Score deep in the distress zone. Liquidity issues and poor profitability compound risk. Historically, companies in this sector with such weak fundamentals struggle to stabilize without major restructuring. Investors should weigh these red flags heavily before considering exposure.
Should You Buy Veritone, Inc.?
Veritone, Inc. appears to have weak profitability and a very weak Piotroski score, suggesting operational challenges. While ROIC shows growth, debt metrics and valuation scores indicate a fragile leverage profile. The overall rating of C could be seen as cautionary.
Strength & Efficiency Pillars
Veritone, Inc. shows operational resilience with a strong gross margin of 68.3%, reflecting effective cost control in production. Despite negative net and EBIT margins (-117.93% and -85.59%, respectively), the company maintains a favorable trend in operating expenses relative to revenue growth. However, the lack of positive ROE and ROIC figures, coupled with unavailable WACC data, limits the assessment of value creation. The operational efficiency does not translate into profitability or shareholder returns, indicating a challenging business environment.
Weaknesses and Drawbacks
The company is in financial distress, with a critically low Altman Z-Score of -4.21, signaling a high bankruptcy risk. This alarming solvency warning eclipses other metrics. Additionally, Veritone suffers from unfavorable leverage and liquidity ratios, including a 0 current ratio and negative interest coverage (-7.86), underscoring short-term financial fragility. Valuation metrics like P/E at -2.66 and P/B of 0, although flagged favorable, stem from distorted earnings and book value figures, reflecting deeper structural issues. Market pressure intensifies with a recent seller dominance of 93.44%.
Our Final Verdict about Veritone, Inc.
Despite some operational strengths, Veritone’s extremely weak solvency profile, marked by a distress-zone Altman Z-Score, renders its investment case highly speculative. The persistent negative margins and deteriorating earnings compound the risk. This profile is too risky for conservative capital and may only appeal to investors with a high tolerance for potential loss. Caution is paramount given the acute financial distress overshadowing any positive trends.
Disclaimer: This content is for informational purposes only and does not constitute financial, investment, or other professional advice. Investing in financial markets involves a significant risk of loss, and past performance is not indicative of future results.
Additional Resources
- Why Is Veritone Stock Tanking Friday? – Benzinga (Mar 27, 2026)
- Veritone, Inc. (NASDAQ:VERI) Q4 2025 earnings call transcript – MSN (Mar 27, 2026)
- Veritone Reports Preliminary, Unaudited Q4 2025 Results and Announces Strategic Deal with Oracle – Business Wire (Mar 26, 2026)
- Veritone Inc. (VERI) stock falls on Q4 2025 Earnings – Quiver Quantitative (Mar 26, 2026)
- Veritone: Oracle Deal Doesn’t Fully Bridge Ongoing Issues (NASDAQ:VERI) – Seeking Alpha (Mar 28, 2026)
For more information about Veritone, Inc., please visit the official website: veritone.com