Home > Analyses > Industrials > Verisk Analytics, Inc.
Verisk Analytics transforms how industries anticipate risk and make decisions. Its advanced data analytics and AI-driven models dominate insurance, energy, and financial services. Known for precision and innovation, Verisk shapes critical sectors with predictive insights that drive smarter underwriting, capital allocation, and fraud detection. As market dynamics evolve, I’m keen to explore whether Verisk’s solid fundamentals still support its premium valuation and growth prospects in 2026.

Table of contents
Business Model & Company Overview
Verisk Analytics, Inc. stands as a leading player in the consulting services sector, founded in 1971 and headquartered in Jersey City, NJ. It delivers a cohesive ecosystem of predictive analytics and decision support across insurance, energy, and financial services. This integrated approach helps clients manage risk, optimize capital allocation, and enhance operational efficiency globally.
The company generates value through a balanced mix of data-driven software platforms and tailored consulting services. Its reach spans the Americas, Europe, and Asia, serving sectors from property and casualty insurance to natural resources and financial institutions. Verisk’s competitive advantage lies in its proprietary analytics and AI models, creating a durable economic moat that shapes risk management and strategic decisions worldwide.
Financial Performance & Fundamental Metrics
I analyze Verisk Analytics, Inc.’s income statement, key financial ratios, and dividend payout policy to assess its core financial health and shareholder returns.
Income Statement
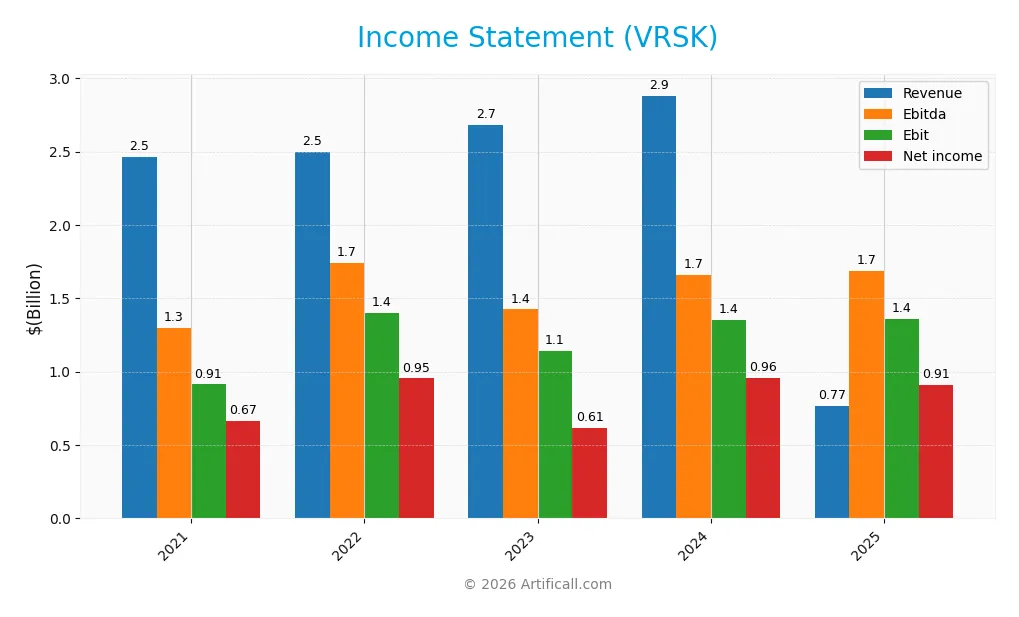
The table below summarizes Verisk Analytics, Inc.’s key income statement figures for fiscal years 2021 through 2025, reported in USD.
| 2021 | 2022 | 2023 | 2024 | 2025 | |
|---|---|---|---|---|---|
| Revenue | 2.46B | 2.50B | 2.68B | 2.88B | 768.3M |
| Cost of Revenue | 854M | 825M | 877M | 901M | 230M |
| Operating Expenses | 697M | 266M | 673M | 727M | 193M |
| Gross Profit | 1.61B | 1.67B | 1.80B | 1.98B | 539M |
| EBITDA | 1.30B | 1.74B | 1.42B | 1.66B | 1.69B |
| EBIT | 914M | 1.40B | 1.14B | 1.35B | 1.36B |
| Interest Expense | 127M | 139M | 116M | 125M | 171M |
| Net Income | 666M | 954M | 614M | 958M | 908M |
| EPS | 4.12 | 6.04 | 4.19 | 6.74 | 6.50 |
| Filing Date | 2022-02-22 | 2023-02-28 | 2024-02-21 | 2025-02-26 | 2026-02-18 |
Income Statement Evolution
Verisk Analytics saw revenue decline sharply by 73% in 2025, following a similar downward trend over the five-year period. Despite revenue contraction, net income rose 36%, reflecting improved net margins and stable EBIT. Gross margin remained favorable at 70%, signaling efficient cost control amid shrinking top-line figures.
Is the Income Statement Favorable?
The 2025 income statement shows strong fundamentals, with net income at $908M and a robust net margin of 118%. However, interest expense accounted for 22% of revenue, an unfavorable sign that pressures profitability. EBITDA and EBIT margins remain strong, supporting operational efficiency despite revenue headwinds. Overall, the income statement trends favor continued resilience but highlight interest costs as a risk factor.
Financial Ratios
The following table summarizes key financial ratios for Verisk Analytics, Inc. over the last five fiscal years:
| Ratios | 2021 | 2022 | 2023 | 2024 | 2025 |
|---|---|---|---|---|---|
| Net Margin | 27.1% | 38.2% | 22.9% | 33.2% | 118.2% |
| ROE | 0.24 | 0.55 | 1.98 | 9.57 | 2.94 |
| ROIC | 10.1% | 19.1% | 23.2% | 27.2% | 26.3% |
| P/E | 55.6 | 29.2 | 57.0 | 40.9 | 34.4 |
| P/B | 13.1 | 15.9 | 113.0 | 391.1 | 101.1 |
| Current Ratio | 0.49 | 0.40 | 1.05 | 0.74 | 0.62 |
| Quick Ratio | 0.49 | 0.40 | 1.05 | 0.74 | 0.62 |
| D/E | 1.27 | 2.26 | 9.99 | 32.4 | 16.3 |
| Debt-to-Assets | 45.8% | 56.8% | 70.9% | 76.1% | 81.3% |
| Interest Coverage | 7.18 | 10.1 | 9.80 | 10.1 | 2.02 |
| Asset Turnover | 0.32 | 0.36 | 0.61 | 0.68 | 0.12 |
| Fixed Asset Turnover | 3.26 | 3.45 | 3.37 | 3.78 | 0.00 |
| Dividend Yield | 0.51% | 0.70% | 0.56% | 0.57% | 0.80% |
Evolution of Financial Ratios
Return on Equity (ROE) surged sharply from 0.24% in 2021 to nearly 2.94% in 2025, showing significant profitability improvement. The Current Ratio declined steadily, dropping from 1.05 in 2023 to 0.62 in 2025, indicating worsening liquidity. Debt-to-Equity Ratio rose dramatically to 16.3 in 2025, reflecting increased leverage and financial risk.
Are the Financial Ratios Favorable?
In 2025, profitability ratios like net margin (118.22%) and ROE (293.95%) were favorable, demonstrating strong earnings quality. However, liquidity ratios such as current and quick ratios were unfavorable at 0.62, signaling potential short-term stress. Leverage metrics, including a high debt-to-equity ratio (16.3) and debt-to-assets (81.31%), were also unfavorable. Market valuation ratios, including P/E (34.4) and P/B (101.11), appeared stretched. Overall, unfavorable ratios outweighed favorable ones, suggesting cautious interpretation.
Shareholder Return Policy
Verisk Analytics maintains a dividend payout ratio near 28%, with dividend per share rising steadily to $1.80 in 2025. The annual yield hovers around 0.8%, supported by free cash flow coverage and complemented by share buybacks, indicating balanced capital return.
This policy aligns with sustainable shareholder value, balancing distribution and reinvestment. However, moderate yield and payout ratio suggest cautious growth prioritization over aggressive returns, reflecting prudent capital allocation amid a highly leveraged balance sheet.
Score analysis
The following radar chart presents Verisk Analytics’ key financial scores for a comprehensive view:
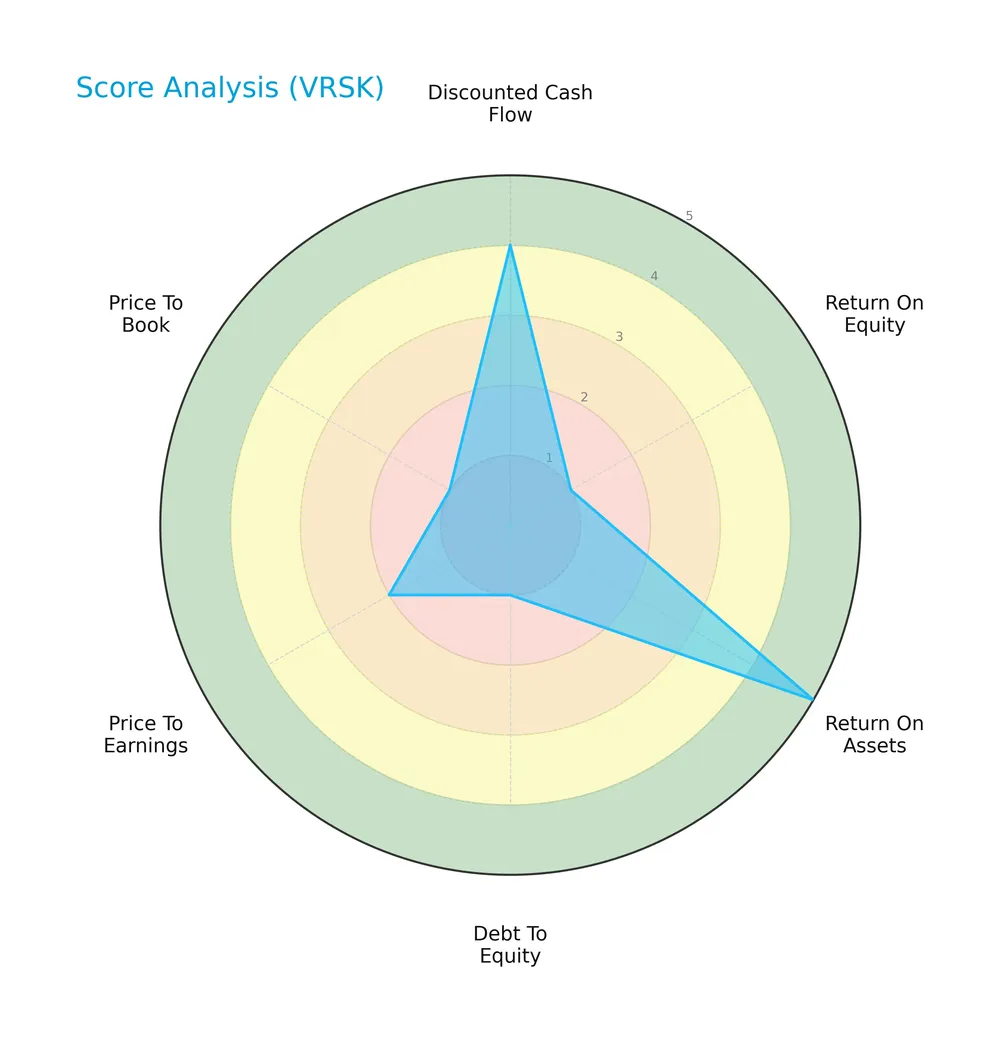
Verisk’s discounted cash flow and return on assets scores are favorable to very favorable. However, return on equity, debt-to-equity, price-to-earnings, and price-to-book scores remain very to moderately unfavorable, signaling mixed financial signals.
Is the company in good financial health?
The Piotroski diagram illustrates Verisk Analytics’ financial strength based on nine fundamental criteria:

With a Piotroski Score of 7, Verisk demonstrates strong financial health. This suggests solid profitability, liquidity, and operational efficiency, positioning the company above average in financial resilience.
Competitive Landscape & Sector Positioning
This sector analysis explores Verisk Analytics, Inc.’s strategic positioning, revenue segments, key products, and main competitors. I will assess whether Verisk maintains a competitive advantage over its industry peers.
Strategic Positioning
Verisk Analytics concentrates heavily on its Insurance segment, generating over $2B in recent years. Its Energy and Financial Services segments have diminished, indicating portfolio narrowing. Geographically, it remains US-centric, with modest but steady revenue from the UK and other countries, reflecting targeted international exposure.
Revenue by Segment
This pie chart illustrates Verisk Analytics’ revenue distribution by segment for the fiscal year 2025, highlighting the relative contribution of each business line.
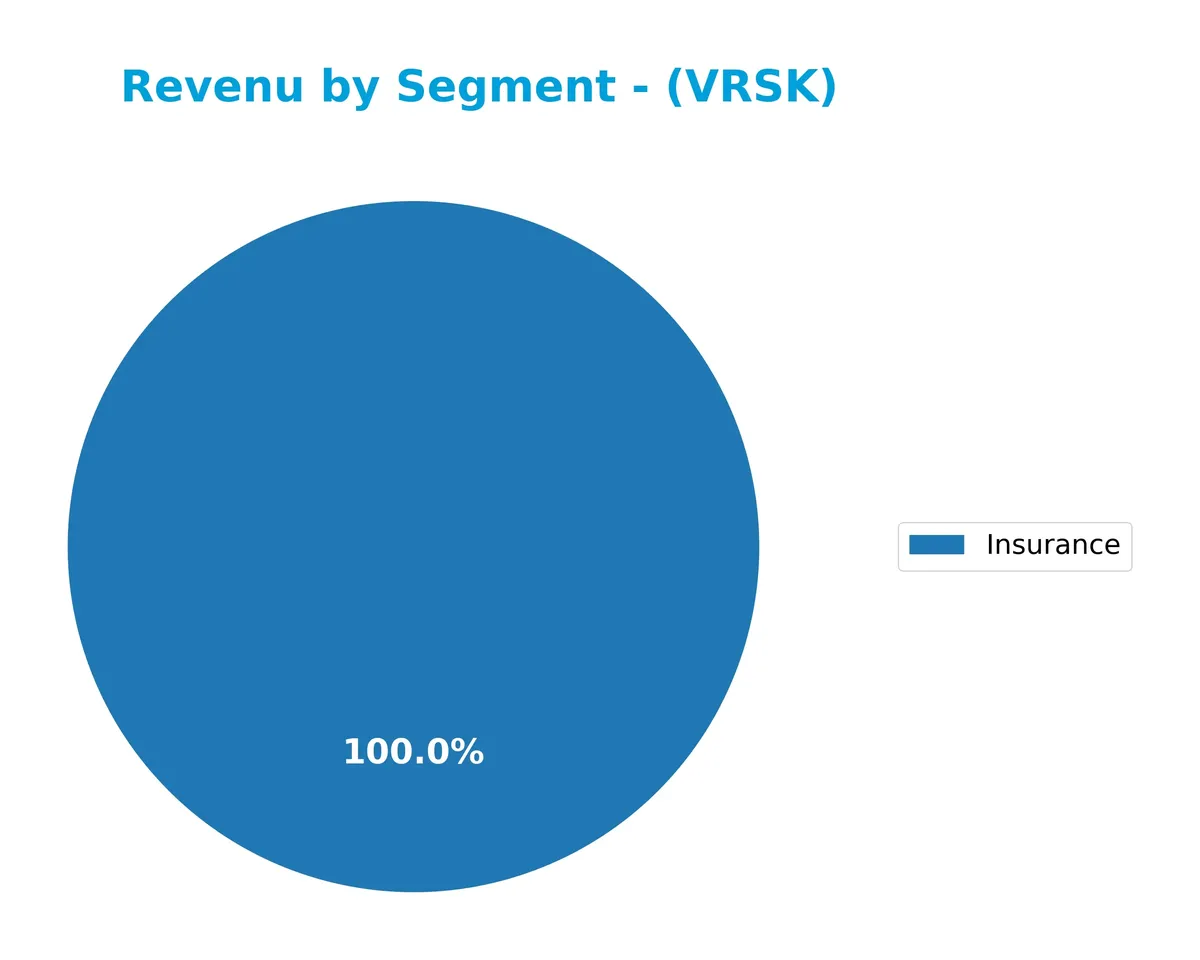
Verisk’s revenue in 2025 is heavily concentrated in the Insurance segment, which generated $2.18B. This segment has consistently driven the business, though revenue declined from $2.88B in 2024, signaling potential headwinds. Other segments like Energy and Specialized Markets and Financial Services showed minimal or no contribution in 2025, indicating a narrowing focus and increased concentration risk in Insurance.
Key Products & Brands
Below is an overview of Verisk Analytics’ key products and brands by segment and their primary functions:
| Product | Description |
|---|---|
| Insurance | Predictive analytics and decision support for property and casualty insurers, including risk selection, pricing, fraud detection, and compliance. |
| Energy and Specialized Markets | Data analytics and consulting for natural resources sectors such as energy, chemicals, metals, mining, power, and renewables, supporting capital allocation and asset valuation. |
| Financial Services | Benchmarking, decision algorithms, business intelligence, and customized analytics for financial institutions, lenders, regulators, and merchants. |
Verisk Analytics focuses on data-driven solutions across insurance, energy, and financial sectors. The Insurance segment remains the largest revenue contributor, emphasizing risk assessment and AI-powered forecasting. Energy and Financial Services provide specialized analytics and consulting support.
Main Competitors
There are 3 competitors in total, with the table below listing the top 3 leaders by market capitalization:
| Competitor | Market Cap. |
|---|---|
| Verisk Analytics, Inc. | 30.8B |
| Equifax Inc. | 26.5B |
| Booz Allen Hamilton Holding Corporation | 10.5B |
Verisk Analytics ranks 1st among its 3 main competitors. Its market cap is 83.3% of the top player’s scale, positioning it above the average market cap of the top 10 in the sector but below the median market cap. The company leads with no competitor above and holds a 3.18% margin over the nearest rival.
Comparisons with competitors
Check out how we compare the company to its competitors:
Does Verisk Analytics have a competitive advantage?
Verisk Analytics presents a strong competitive advantage, evidenced by a very favorable moat rating and a ROIC exceeding its WACC by nearly 20%. This indicates efficient capital use and consistent value creation over 2021-2025.
Looking ahead, Verisk’s expansion in predictive analytics across insurance, energy, and financial services offers growth opportunities. Its machine learning models and global market presence support future innovation and geographic diversification.
SWOT Analysis
This SWOT analysis highlights Verisk Analytics’ key internal and external factors shaping its competitive position and strategic focus.
Strengths
- strong moat with ROIC well above WACC
- diversified revenue streams across sectors and geographies
- robust net margin exceeding 100%
Weaknesses
- high debt-to-assets ratio above 80%
- weak liquidity with current ratio below 1
- valuation metrics (PE, PB) significantly stretched
Opportunities
- expanding data analytics demand in emerging markets
- AI and machine learning enhancing predictive capabilities
- cross-sector growth in financial and energy analytics
Threats
- intense competition in consulting and analytics
- regulatory changes impacting data usage
- economic downturn reducing client spending
Verisk’s durable competitive advantage supports sustained profitability. However, leverage and liquidity risks require cautious capital management. The company must capitalize on AI-driven innovation while mitigating external market and regulatory threats.
Stock Price Action Analysis
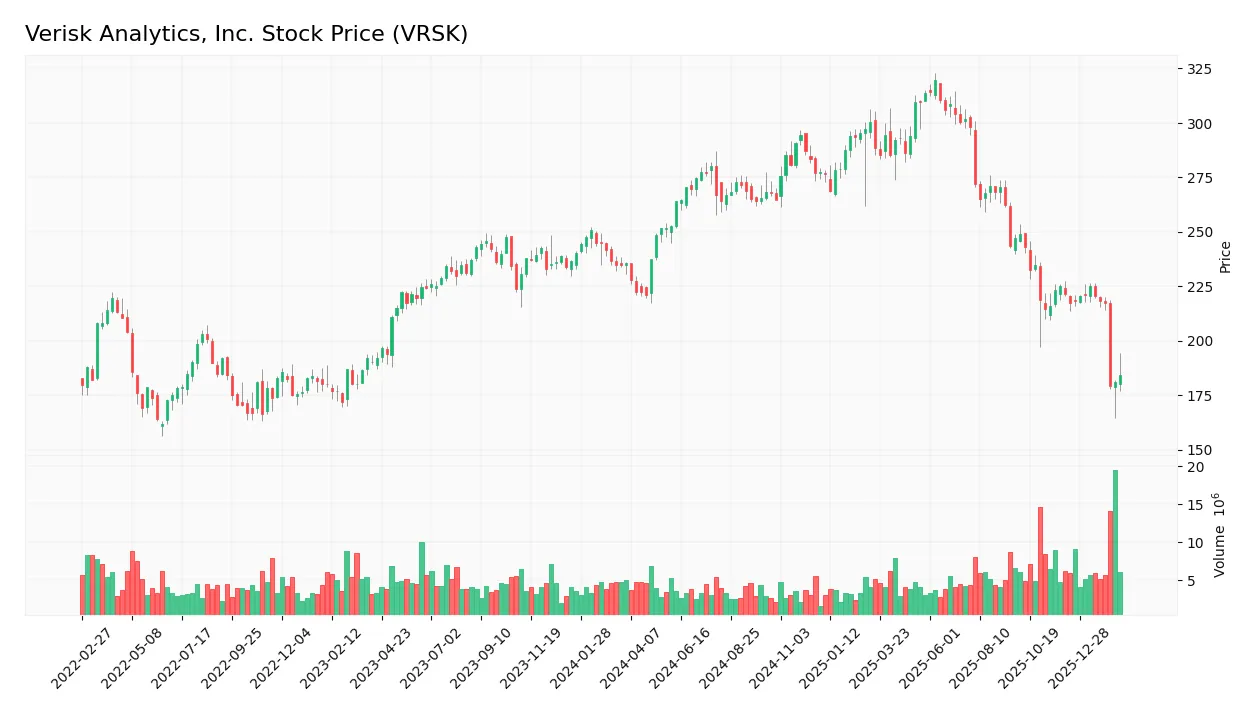
The weekly stock chart below illustrates Verisk Analytics, Inc.’s price movement over the past 100 weeks, highlighting key trends and volatility:
Trend Analysis
Over the past 100 weeks, the stock price declined by 21.91%, indicating a bearish trend. The trend decelerates despite high volatility (31.68 std deviation). The price peaked at 319.6 and bottomed at 179.1, confirming a broad downward movement with no recent acceleration.
Volume Analysis
Trading volume has increased overall to 562M shares. Buyers slightly dominate with 53.6% of volume in the recent three months, suggesting modest buying interest amid a bearish price trend. This signals cautious market participation with a slight tilt toward accumulation.
Target Prices
Analysts set a solid target consensus for Verisk Analytics, Inc., reflecting measured optimism.
| Target Low | Target High | Consensus |
|---|---|---|
| 233 | 280 | 251.5 |
The target range from 233 to 280 suggests analysts expect moderate upside from current levels. The consensus of 251.5 balances growth potential with cautious valuation.

Don’t Let Luck Decide Your Entry Point
Optimize your entry points with our advanced ProRealTime indicators. You’ll get efficient buy signals with precise price targets for maximum performance. Start outperforming now!
Analyst & Consumer Opinions
This section examines Verisk Analytics, Inc. (VRSK) through analyst grades and consumer feedback to provide balanced insights.
Stock Grades
Here are the latest verified stock grades from leading financial institutions for Verisk Analytics, Inc.:
| Grading Company | Action | New Grade | Date |
|---|---|---|---|
| Wells Fargo | Maintain | Overweight | 2026-02-11 |
| Morgan Stanley | Maintain | Equal Weight | 2025-12-17 |
| Wells Fargo | Maintain | Overweight | 2025-10-30 |
| Evercore ISI Group | Maintain | In Line | 2025-10-30 |
| Goldman Sachs | Maintain | Neutral | 2025-10-30 |
| JP Morgan | Maintain | Overweight | 2025-10-30 |
| Barclays | Upgrade | Overweight | 2025-10-30 |
| RBC Capital | Maintain | Outperform | 2025-10-30 |
| Rothschild & Co | Downgrade | Sell | 2025-10-16 |
| Evercore ISI Group | Maintain | In Line | 2025-10-14 |
The consensus leans toward a Hold rating, with a spread of opinions from Overweight to Sell. Most firms maintain stable views, though Barclays upgraded and Rothschild downgraded, indicating some divergence in outlook.
Consumer Opinions
Verisk Analytics inspires mixed but insightful consumer sentiment, revealing both its core strengths and areas needing attention.
| Positive Reviews | Negative Reviews |
|---|---|
| “Reliable data analytics that enhance decision-making.” | “Pricing is on the higher side compared to peers.” |
| “Excellent customer support with quick response times.” | “Occasional delays in software updates frustrate users.” |
| “Robust platform with comprehensive industry coverage.” | “Interface can be complex for new users.” |
Overall, consumers praise Verisk’s data reliability and customer service. However, pricing and usability issues recur as notable concerns. This mix suggests strong fundamentals with room for user experience improvements.
Risk Analysis
Below is a summary of key risks affecting Verisk Analytics, Inc., their likelihood, and potential impact:
| Category | Description | Probability | Impact |
|---|---|---|---|
| Financial Leverage | Extremely high debt-to-assets ratio at 81.3% poses refinancing risks. | High | High |
| Liquidity Risk | Current and quick ratios at 0.62 indicate weak short-term liquidity. | High | Medium |
| Valuation Risk | Elevated P/E (34.4) and P/B (101.1) ratios suggest overvaluation. | Medium | Medium |
| Profitability | Exceptionally high ROE (294%) and ROIC (26.3%) reflect strong margins. | Low | High |
| Market Volatility | Beta of 0.79 shows lower stock sensitivity but limited upside in downturns. | Medium | Low |
Leverage stands out as the largest concern. Historically, in capital-intensive sectors, such high debt ratios increase risk during tightening credit cycles. Verisk’s liquidity metrics also raise red flags for operational flexibility. Despite excellent profitability metrics, valuation extremes reduce margin of safety. Investors must weigh these risks carefully in 2026’s uncertain macro environment.
Should You Buy Verisk Analytics, Inc.?
Verisk Analytics appears to be a company with a very favorable competitive moat, demonstrated by growing ROIC that suggests strong value creation. Despite a challenging leverage profile and mixed profitability signals, its overall B- rating could be seen as cautiously optimistic.
Strength & Efficiency Pillars
Verisk Analytics, Inc. exhibits strong operational efficiency with a remarkable net margin of 118.22% and an impressive return on equity (ROE) of 293.95%. The return on invested capital (ROIC) stands at 26.29%, significantly exceeding the weighted average cost of capital (WACC) at 6.62%. This gap confirms that Verisk is a clear value creator. The company’s growing ROIC trend further signals a sustainable competitive advantage and robust profitability, which supports its very favorable moat status.
Weaknesses and Drawbacks
The Altman Z-Score is unavailable, so solvency risk cannot be fully assessed. However, several red flags demand caution. Valuation metrics are stretched, with a price-to-earnings (P/E) ratio of 34.4 and a price-to-book (P/B) ratio of 101.11, indicating a premium that may not be fully justified by fundamentals. Leverage is notably high, with a debt-to-equity ratio of 16.3 and a current ratio of only 0.62, highlighting liquidity concerns. These factors, combined with a bearish overall stock trend and decelerating price momentum, suggest heightened market pressure.
Our Final Verdict about Verisk Analytics, Inc.
Despite Verisk’s strong profitability and value creation, the lack of Altman Z-Score data and significant leverage risks make the investment profile cautious. The stretched valuation and weak liquidity ratios introduce potential volatility. While the company’s long-term fundamentals may appear attractive, the prevailing bearish technical trend and elevated financial risks suggest a wait-and-see approach might be prudent before considering entry.
Disclaimer: This content is for informational purposes only and does not constitute financial, investment, or other professional advice. Investing in financial markets involves a significant risk of loss, and past performance is not indicative of future results.
Additional Resources
- Decoding Verisk Analytics Inc (VRSK): A Strategic SWOT Insight – GuruFocus (Feb 19, 2026)
- Skandinaviska Enskilda Banken AB publ Has $13.38 Million Stock Position in Verisk Analytics, Inc. $VRSK – MarketBeat (Feb 19, 2026)
- Verisk Analytics (VRSK) Tops Q4 Earnings and Revenue Estimates – Nasdaq (Feb 18, 2026)
- Verisk (Nasdaq: VRSK) 2025 revenue grows while cash flow surges – Stock Titan (Feb 18, 2026)
- Verisk: Q4 Earnings Snapshot – kens5.com (Feb 18, 2026)
For more information about Verisk Analytics, Inc., please visit the official website: verisk.com