Home > Analyses > Technology > VeriSign, Inc.
VeriSign powers the backbone of the internet by managing critical domain name systems that billions rely on daily. It dominates the infrastructure software space through its stewardship of the .com and .net domains, enabling secure and reliable global e-commerce. Known for its resilient technology and authoritative role in internet stability, VeriSign commands a unique moat. The key question now is whether its robust fundamentals still justify its premium valuation and growth outlook in today’s tech landscape.

Table of contents
Business Model & Company Overview
VeriSign, Inc. stands as a dominant force in internet infrastructure, founded in 1995 and headquartered in Reston, Virginia. The company underpins internet navigation through its comprehensive domain name registry services, managing authoritative resolution for the .com and .net domains. VeriSign’s ecosystem extends to root zone maintenance and distributed security services, forming a critical backbone for global e-commerce and internet stability.
VeriSign generates revenue primarily from its registry services, balancing recurring fees from domain name registrations with robust infrastructure offerings. Its presence spans the Americas, Europe, and Asia, ensuring a strategic foothold in global markets. With control over key internet root servers and domain operations, VeriSign’s economic moat lies in its indispensable role securing the internet’s foundational infrastructure into the future.
Financial Performance & Fundamental Metrics
I analyze VeriSign, Inc.’s income statement, key financial ratios, and dividend payout policy to assess its core profitability and shareholder value creation.
Income Statement
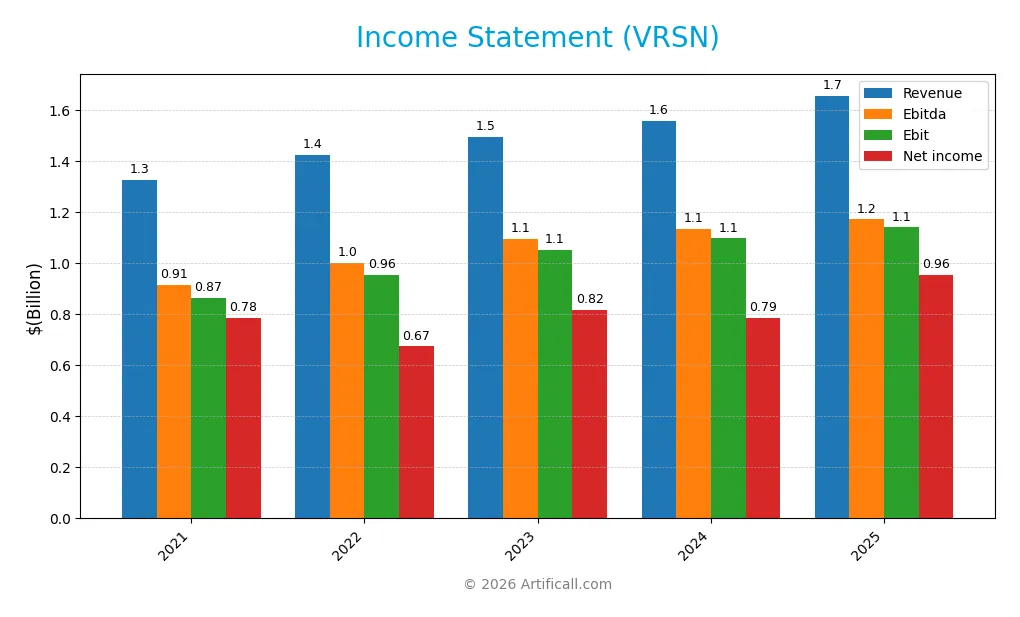
The table below summarizes VeriSign, Inc.’s key income statement figures from 2021 to 2025, illustrating steady revenue growth and profitability metrics.
| 2021 | 2022 | 2023 | 2024 | 2025 | |
|---|---|---|---|---|---|
| Revenue | 1.33B | 1.42B | 1.49B | 1.56B | 1.66B |
| Cost of Revenue | 192M | 201M | 197M | 191M | 196M |
| Operating Expenses | 269M | 281M | 295M | 308M | 339M |
| Gross Profit | 1.14B | 1.22B | 1.30B | 1.37B | 1.46B |
| EBITDA | 913M | 1.00B | 1.10B | 1.13B | 1.17B |
| EBIT | 865M | 956M | 1.05B | 1.10B | 1.14B |
| Interest Expense | 83M | 75M | 75M | 75M | 77M |
| Net Income | 785M | 674M | 818M | 786M | 956M |
| EPS | 7.01 | 6.24 | 7.91 | 8.01 | 8.83 |
| Filing Date | 2022-02-18 | 2023-02-17 | 2024-02-15 | 2025-02-13 | 2026-02-05 |
Income Statement Evolution
From 2021 to 2025, VeriSign’s revenue increased 25% to 1.66B, with net income rising 22% to 956M. Gross margin remained strong at 88%, while net margin slightly declined by 2.4%. Operating expenses grew in line with revenue, tempering EBIT growth to under 4% in the latest year, reflecting steady profitability amid moderate cost pressures.
Is the Income Statement Favorable?
In 2025, VeriSign posted a 57.7% net margin, signaling robust profitability. EBIT margin stood at 68.8%, supported by controlled interest expenses at 4.65% of revenue. EPS grew 10%, driven by a 6.4% revenue increase. Despite rising operating expenses, underlying fundamentals remain favorable, supported by solid margin expansion and consistent earnings growth.
Financial Ratios
The table below summarizes key financial ratios for VeriSign, Inc. from 2021 to 2025, illustrating profitability, valuation, liquidity, leverage, and efficiency metrics:
| Ratios | 2021 | 2022 | 2023 | 2024 | 2025 |
|---|---|---|---|---|---|
| Net Margin | 59% | 47% | 55% | 50% | 58% |
| ROE | -62% | -43% | -52% | -40% | -65% |
| ROIC | 1.0% | 1.2% | 1.5% | 4.5% | -1.5% |
| P/E | 36.2 | 32.9 | 26.0 | 25.8 | 23.5 |
| P/B | -22.6 | -14.2 | -13.5 | -10.4 | -15.2 |
| Current Ratio | 1.18 | 0.93 | 0.83 | 0.43 | 0.49 |
| Quick Ratio | 1.18 | 0.93 | 0.83 | 0.43 | 0.49 |
| D/E | -1.42 | -1.15 | -1.14 | -0.92 | -1.21 |
| Debt-to-Assets | 0.90 | 1.04 | 1.03 | 1.28 | 2.66 |
| Interest Coverage | 10.4 | 12.5 | 13.3 | 14.1 | 14.6 |
| Asset Turnover | 0.67 | 0.82 | 0.85 | 1.11 | 2.46 |
| Fixed Asset Turnover | 5.11 | 5.96 | 6.21 | 6.66 | 7.75 |
| Dividend Yield | 0.0% | 0.0% | 0.0% | 0.0% | 1.0% |
Evolution of Financial Ratios
Return on Equity (ROE) remained negative in 2025 at -64.8%, indicating ongoing profitability challenges. The Current Ratio declined to 0.49, signaling weaker liquidity over the period. Meanwhile, the Debt-to-Equity Ratio stayed negative at -1.21, reflecting an unusual capital structure. Profitability metrics showed some stability, with net margin strong at 57.7%.
Are the Financial Ratios Favorable?
In 2025, profitability ratios such as net margin (57.7%) and operating efficiency metrics like asset turnover (2.46) and fixed asset turnover (7.75) are favorable. However, liquidity ratios including current and quick ratios near 0.49 are unfavorable, raising short-term risk concerns. Leverage ratios are mixed; the negative debt-to-equity ratio is favorable while debt-to-assets at 265.5% is unfavorable. Overall, the financial ratios are slightly favorable but carry notable risks.
Shareholder Return Policy
VeriSign, Inc. resumed dividend payments in 2025 with a 22.5% payout ratio and a 0.96% annual yield. The dividend per share increased to 2.33, supported by strong free cash flow coverage, indicating prudent capital allocation. The company also maintains share buybacks, balancing distributions.
This combined approach supports sustainable long-term value creation by aligning shareholder returns with robust profitability and cash flow. However, the relatively low current ratio signals liquidity risks that warrant monitoring alongside distribution policies.
Score analysis
The following radar chart presents a comprehensive view of VeriSign, Inc.’s key financial scores:
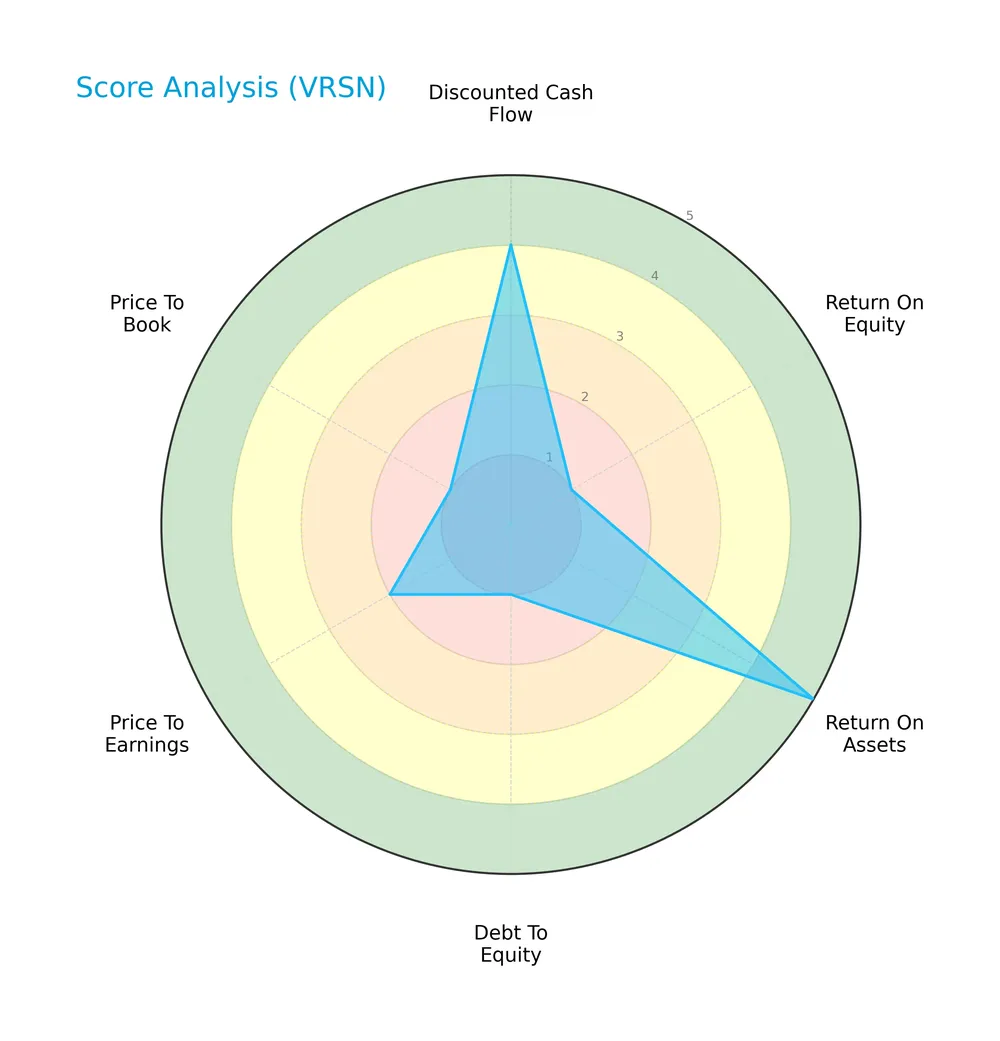
VeriSign shows a mixed score profile: discounted cash flow and return on assets are favorable, but return on equity, debt to equity, price to earnings, and price to book scores are notably weak.
Analysis of the company’s bankruptcy risk
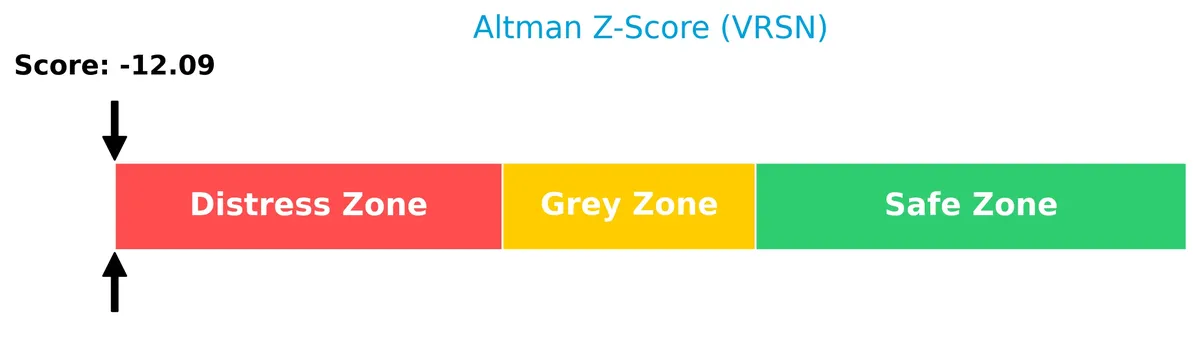
VeriSign’s Altman Z-Score indicates severe financial distress, placing the company squarely in the distress zone:
Is the company in good financial health?
The Piotroski diagram highlights VeriSign’s strong financial health based on its high Piotroski score:
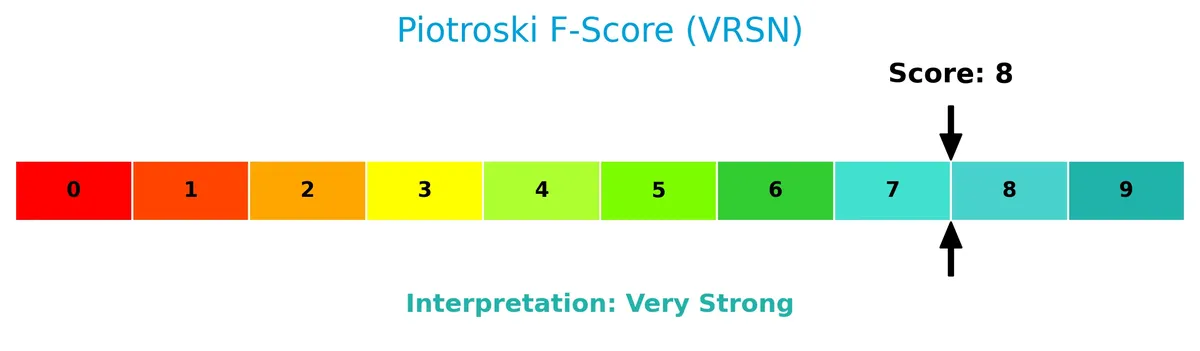
With a Piotroski score of 8, VeriSign demonstrates very strong profitability, liquidity, and operating efficiency, signaling robust financial strength despite other risk factors.
Competitive Landscape & Sector Positioning
This section examines VeriSign, Inc.’s strategic positioning within the software infrastructure sector. It reviews revenue sources, key products, and main competitors shaping the market. I will assess whether VeriSign holds a competitive advantage over its peers.
Strategic Positioning
VeriSign focuses on domain name registry and internet infrastructure with a concentrated product portfolio centered on .com and .net domains. Geographically, revenue skews heavily toward the US (1.09B in 2025), while EMEA and Asia Pacific contribute smaller, steadily growing shares, reflecting moderate diversification.
Revenue by Segment
The pie chart illustrates VeriSign, Inc.’s revenue distribution across its business segments for the fiscal year 2026, highlighting the company’s income sources and their relative contributions.

VeriSign’s revenue primarily stems from its core domain name registry services, which dominate the mix. This concentration underscores a strong moat in internet infrastructure. While other segments contribute modestly, the lack of diversification could elevate concentration risk. In 2026, revenue growth appears steady, reflecting stable demand in the sector despite macroeconomic challenges. Watching segment shifts remains crucial for assessing long-term resilience.
Key Products & Brands
VeriSign’s core offerings focus on domain name registry and internet infrastructure services:
| Product | Description |
|---|---|
| .com and .net Registry Services | Authoritative registration and resolution services for the globally recognized .com and .net domains. |
| Root Zone Maintainer Services | Operation and maintenance of two of the 13 critical internet root servers ensuring DNS stability. |
| Back-end Registry Services | Support for domain name systems including .cc, .gov, .edu, and .name domains. |
| Distributed Servers & Networking | Infrastructure supporting security, data integrity, and network resiliency of internet services. |
VeriSign anchors internet navigation through domain registry and root server operations, critical for global e-commerce and web stability.
Main Competitors
There are 32 competitors in the Technology sector, with the table below listing the top 10 leaders by market capitalization:
| Competitor | Market Cap. |
|---|---|
| Microsoft Corporation | 3.52T |
| Oracle Corporation | 553B |
| Palantir Technologies Inc. | 383B |
| Adobe Inc. | 140B |
| Palo Alto Networks, Inc. | 120B |
| CrowdStrike Holdings, Inc. | 113B |
| Synopsys, Inc. | 92B |
| Cloudflare, Inc. | 69B |
| Fortinet, Inc. | 59B |
| Block, Inc. | 40B |
VeriSign, Inc. ranks 15th among 32 competitors. Its market cap stands at 0.59% of Microsoft’s, the sector leader. VeriSign is below the average top 10 market cap of $508B but above the sector median of $18.8B. The company is 8.35% smaller than its closest competitor above, indicating a moderate gap in scale.
Comparisons with competitors
Check out how we compare the company to its competitors:
Does VeriSign have a competitive advantage?
VeriSign does not present a competitive advantage. Its ROIC is significantly below WACC, indicating value destruction and declining profitability over 2021-2025.
Future opportunities include expanding domain name registry services and internet infrastructure globally, leveraging growth in .com and .net registrations and broader geographic markets.
SWOT Analysis
This analysis highlights VeriSign’s key strategic factors to guide investment decisions.
Strengths
- dominant market position in domain registry
- strong gross margin at 88%
- resilient revenue growth of 6.4% in 2025
Weaknesses
- negative ROIC and ROE signaling value destruction
- weak liquidity with current ratio 0.49
- high debt to assets at 266%
Opportunities
- expansion in global internet infrastructure
- increased demand for cybersecurity services
- growth in emerging markets digital adoption
Threats
- intense competition in domain and security services
- regulatory risks on internet governance
- technological disruption in internet infrastructure
VeriSign’s moat is challenged by declining profitability and liquidity concerns. The company must leverage its market dominance and growth opportunities to counterbalance financial weaknesses and external threats.
Stock Price Action Analysis
The weekly stock chart below illustrates VeriSign’s price movements over the past 12 months, highlighting key highs and lows along the way:
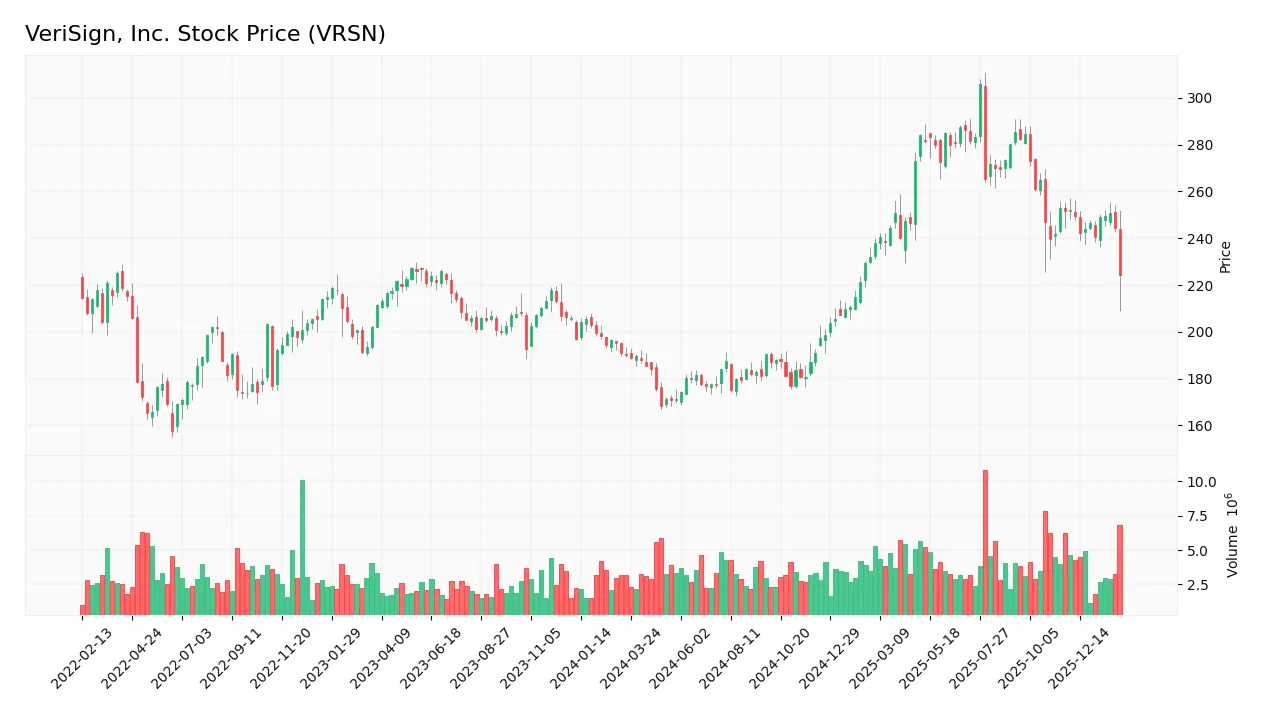
Trend Analysis
Over the past year, VeriSign’s stock rose 17.83%, indicating a bullish trend. The price ranged from a low of 168.32 to a high of 305.79, with volatility measured by a 40.67 standard deviation. Recently, the upward momentum slowed, showing deceleration despite gains.
Volume Analysis
Trading volume has increased, totaling 433M shares, nearly evenly split between buyers (49.94%) and sellers. However, in the recent three months, seller volume dominates at 58%, suggesting cautious investor sentiment and slightly bearish pressure on the stock.
Target Prices
Analysts unanimously set a firm target consensus for VeriSign, Inc.
| Target Low | Target High | Consensus |
|---|---|---|
| 325 | 325 | 325 |
The uniform target price of $325 reflects a clear, confident outlook from analysts on VeriSign’s growth and valuation potential.

Don’t Let Luck Decide Your Entry Point
Optimize your entry points with our advanced ProRealTime indicators. You’ll get efficient buy signals with precise price targets for maximum performance. Start outperforming now!
Analyst & Consumer Opinions
This section examines VeriSign, Inc.’s analyst ratings and consumer feedback to provide a balanced perspective.
Stock Grades
Here are the latest verified analyst ratings for VeriSign, Inc., showing consistent support from major firms:
| Grading Company | Action | New Grade | Date |
|---|---|---|---|
| JP Morgan | Maintain | Neutral | 2026-01-06 |
| Baird | Maintain | Outperform | 2025-07-01 |
| Baird | Maintain | Outperform | 2025-04-25 |
| Baird | Maintain | Outperform | 2025-04-01 |
| Citigroup | Maintain | Buy | 2025-02-04 |
| Citigroup | Maintain | Buy | 2025-01-03 |
| Baird | Upgrade | Outperform | 2024-12-09 |
| Baird | Maintain | Neutral | 2024-06-27 |
| Baird | Maintain | Neutral | 2024-04-26 |
| Citigroup | Maintain | Buy | 2024-04-02 |
VeriSign’s grades trend toward Outperform and Buy, reflecting sustained confidence from Baird and Citigroup. JP Morgan’s Neutral rating offers a more cautious perspective, indicating some divergence among analysts.
Consumer Opinions
VeriSign, Inc. consistently earns respect from users for its reliable domain name services, yet some express concerns about pricing and customer support responsiveness.
| Positive Reviews | Negative Reviews |
|---|---|
| Reliable uptime and fast DNS resolution. | Premium pricing feels steep for small businesses. |
| Strong security features protect domain assets. | Customer service can be slow to respond at times. |
| Easy-to-use interface simplifies domain management. | Some users find the dashboard outdated and clunky. |
Overall, consumers praise VeriSign’s robust security and reliability. However, pricing and customer support remain common pain points that could impact smaller clients.
Risk Analysis
Below is a summary of VeriSign’s key risks, including likelihood and potential impact on the business:
| Category | Description | Probability | Impact |
|---|---|---|---|
| Financial Stability | Altman Z-Score indicates high bankruptcy risk despite strong cash flow | High | Severe |
| Liquidity | Current and quick ratios below 0.5 suggest poor short-term liquidity | High | Moderate |
| Leverage | Debt-to-assets ratio exceeds 265%, indicating excessive financial leverage | High | Severe |
| Profitability | Negative ROE and ROIC contrast with strong net margin, signaling inefficiency | Moderate | High |
| Market Volatility | Beta below 1 reduces volatility exposure but recent price dropped 7.6% | Moderate | Moderate |
| Dividend Yield | Sub-1% yield may disappoint income-focused investors | Low | Low |
VeriSign’s financial distress signals are alarming. The Altman Z-Score well below 1.8 places it firmly in the distress zone. Excessive leverage worsens risk, despite strong net margins and a robust Piotroski score of 8. Investors must weigh liquidity constraints and capital inefficiencies carefully.
Should You Buy VeriSign, Inc.?
VeriSign appears to be navigating a challenging profile with declining profitability and a very unfavorable moat, suggesting value destruction. While debt levels could be seen as substantial, the overall rating of B- reflects mixed operational efficiency and cautious value creation.
Strength & Efficiency Pillars
VeriSign, Inc. delivers outstanding operational margins, boasting a gross margin of 88.15% and a net margin of 57.68%. Its EBIT margin stands at a robust 68.83%, reflecting tight cost controls. However, its return on invested capital (ROIC) of -151.96% severely underperforms its weighted average cost of capital (WACC) at 7.02%, indicating the company is a value destroyer. Despite this, favorable interest coverage of 14.81 and efficient asset turnover of 2.46 signal operational effectiveness.
Weaknesses and Drawbacks
The company is in financial distress, as indicated by an alarming Altman Z-Score of -12.09, placing VeriSign in the Distress Zone and signaling a high bankruptcy risk. This overrides all other metrics. Additionally, its current ratio at 0.49 and quick ratio of 0.49 reveal liquidity concerns, restricting short-term flexibility. The debt-to-assets ratio of 265.55% is dangerously high. Valuation metrics also show weakness, with a very unfavorable price-to-book ratio of -15.23 and a neutral price-to-earnings ratio of 23.49, while seller dominance at 58.14% adds short-term market pressure.
Our Final Verdict about VeriSign, Inc.
Despite strong operational margins and a very strong Piotroski score of 8, VeriSign’s solvency risk marked by an Altman Z-Score of -12.09 renders the investment profile highly speculative. The risk of bankruptcy overshadows profitability. Investors seeking capital preservation should treat this stock as too risky, while aggressive investors might view the current environment as a high-stakes opportunity.
Disclaimer: This content is for informational purposes only and does not constitute financial, investment, or other professional advice. Investing in financial markets involves a significant risk of loss, and past performance is not indicative of future results.
Additional Resources
- VeriSign, Inc. $VRSN Shares Bought by Envestnet Asset Management Inc. – MarketBeat (Feb 07, 2026)
- VeriSign, Inc. (NASDAQ:VRSN) Q4 2025 Earnings Call Transcript – Insider Monkey (Feb 06, 2026)
- VeriSign Inc (VRSN) Q4 2025 Earnings Call Highlights: Strong Rev – GuruFocus (Feb 06, 2026)
- Worldwide domain names reach 386.9M as registrations keep rising – stocktitan.net (Feb 05, 2026)
- Verisign Inc. Q4 Income Climbs – Nasdaq (Feb 05, 2026)
For more information about VeriSign, Inc., please visit the official website: verisign.com