Home > Analyses > Industrials > Veralto Corporation
Veralto Corporation transforms how industries monitor and improve water quality while enhancing product packaging worldwide. Its Water Quality segment leads with precision instruments and treatment technologies trusted by municipalities and manufacturers alike. Meanwhile, its Product Quality & Innovation division drives packaging excellence through iconic brands like Videojet and Pantone. As Veralto shapes vital environmental and industrial processes, I ask: do its financial fundamentals justify its premium valuation and growth outlook?

Table of contents
Business Model & Company Overview
Veralto Corporation, founded in 2022 and headquartered in Waltham, Massachusetts, commands a leading position in the industrial pollution and treatment controls sector. Its ecosystem spans water analytics, treatment, marking, coding, and packaging solutions. Operating under renowned brands like Hach, Trojan Technologies, Videojet, and Pantone, it integrates precision instrumentation with innovative packaging technologies to serve municipal utilities, food and beverage, pharmaceutical, and industrial markets.
The company’s revenue engine balances hardware and recurring services across two key segments: Water Quality and Product Quality & Innovation. Veralto leverages global reach across the Americas, Europe, and Asia, selling chemical reagents, digital water solutions, marking systems, and color management software. This strategic diversification builds a durable economic moat, positioning Veralto as a key architect of its industry’s sustainable future.
Financial Performance & Fundamental Metrics
I analyze Veralto Corporation’s income statement, key financial ratios, and dividend payout policy to reveal its underlying profitability and capital efficiency.
Income Statement
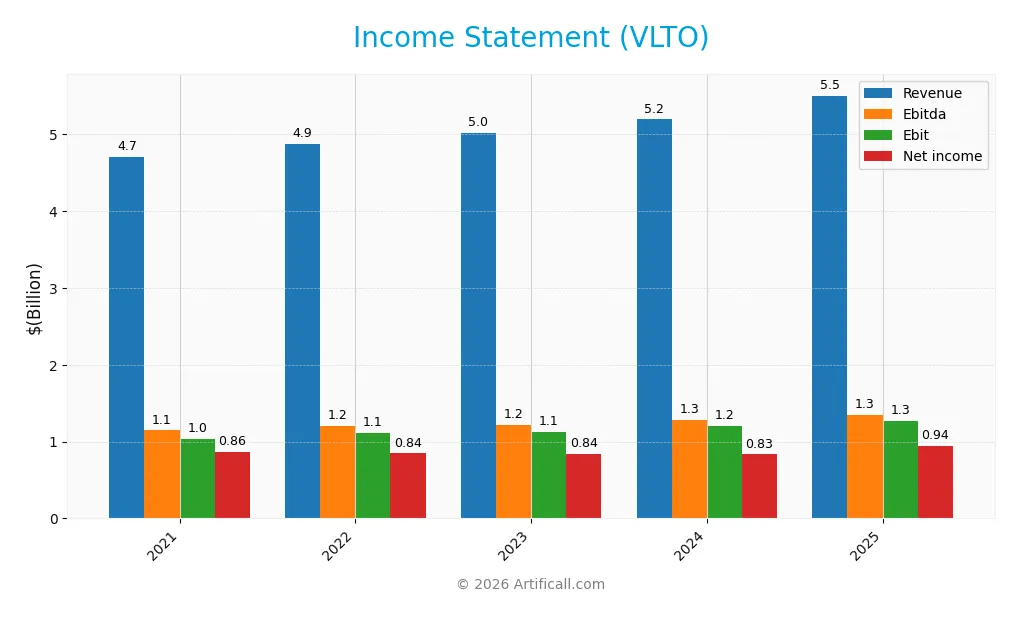
The table below summarizes Veralto Corporation’s key income statement figures for fiscal years 2021 through 2025, all values in USD.
| 2021 | 2022 | 2023 | 2024 | 2025 | |
|---|---|---|---|---|---|
| Revenue | 4.7B | 4.87B | 5.02B | 5.19B | 5.5B |
| Cost of Revenue | 1.99B | 2.11B | 2.12B | 2.09B | 2.2B |
| Operating Expenses | 1.67B | 1.65B | 1.76B | 1.90B | 2.02B |
| Gross Profit | 2.71B | 2.77B | 2.90B | 3.10B | 3.30B |
| EBITDA | 1.15B | 1.20B | 1.21B | 1.28B | 1.35B |
| EBIT | 1.04B | 1.11B | 1.13B | 1.20B | 1.27B |
| Interest Expense | 0 | 0 | 30M | 113M | 96M |
| Net Income | 861M | 845M | 839M | 833M | 940M |
| EPS | 3.50 | 3.43 | 3.41 | 3.37 | 3.79 |
| Filing Date | 2021-12-31 | 2022-12-31 | 2023-12-31 | 2025-02-25 | 2026-02-20 |
Income Statement Evolution
Veralto Corporation’s revenue grew 17.1% from 2021 to 2025, showing steady expansion. Net income increased 9.2% over the same period, indicating moderate bottom-line growth. Gross margin held favorably at nearly 60%, while EBIT margin remained strong at 23.1%, reflecting consistent operational efficiency despite slight margin pressure overall.
Is the Income Statement Favorable?
In 2025, Veralto reported $5.5B revenue and $940M net income, yielding a 17.1% net margin. EBIT margin at 23.1% and interest expense at 1.74% of revenue demonstrate solid profitability and manageable debt costs. EPS rose 12.6% year-over-year. However, operating expenses grew at the same pace as revenue, which may limit future margin expansion. The fundamentals appear generally favorable.
Financial Ratios
The following table presents key financial ratios for Veralto Corporation (VLTO) over the past five years, illustrating profitability, leverage, liquidity, and market valuation metrics:
| Ratios | 2021 | 2022 | 2023 | 2024 | 2025 |
|---|---|---|---|---|---|
| Net Margin | 18.3% | 17.4% | 16.7% | 16.0% | 17.1% |
| ROE | 26.9% | 26.1% | 60.7% | 40.9% | 30.3% |
| ROIC | 22.8% | 22.6% | 19.6% | 17.8% | 16.1% |
| P/E | 23.0 | 23.5 | 24.2 | 30.2 | 26.4 |
| P/B | 6.20 | 6.13 | 14.7 | 12.4 | 8.0 |
| Current Ratio | 1.07 | 1.14 | 1.64 | 1.92 | 1.67 |
| Quick Ratio | 0.79 | 0.83 | 1.40 | 1.69 | 1.52 |
| D/E | 0.04 | 0.04 | 2.01 | 1.36 | 0.86 |
| Debt-to-Assets | 2.8% | 2.5% | 48.8% | 43.2% | 34.7% |
| Interest Coverage | N/A | 0.0 | 38.0 | 10.7 | 13.3 |
| Asset Turnover | 0.97 | 1.01 | 0.88 | 0.81 | 0.72 |
| Fixed Asset Turnover | 18.1 | 19.7 | 19.2 | 19.4 | 18.7 |
| Dividend Yield | 0.0% | 0.0% | 0.1% | 0.4% | 0.4% |
Evolution of Financial Ratios
Return on Equity (ROE) for Veralto Corporation improved significantly, peaking at 60.67% in 2023 before moderating to 30.26% in 2025. The Current Ratio has fluctuated but remained above 1.5 since 2023, indicating stable liquidity. Debt-to-Equity Ratio rose sharply from 0.04 in 2021 to 1.36 in 2024, then declined to 0.86 in 2025, reflecting variable leverage and risk management. Profitability margins stayed relatively stable, with net margin around 16-18% recently.
Are the Financial Ratios Fovorable?
In 2025, Veralto shows favorable profitability with ROE at 30.26% and net margin at 17.08%, outperforming typical market averages. Liquidity ratios (Current at 1.67, Quick at 1.52) are solid, supporting operational flexibility. Leverage metrics (Debt-to-Equity 0.86) are neutral, suggesting moderate financial risk. Valuation ratios like P/E (26.36) and P/B (7.98) are unfavorable, indicating potential market overpricing. Overall, the financial ratios lean slightly favorable, balancing strengths in profitability and liquidity against valuation concerns.
Shareholder Return Policy
Veralto Corporation pays dividends with a payout ratio near 11.6% in 2025 and an annual yield under 0.45%. Dividends per share have grown steadily, supported by strong free cash flow coverage around 94%, indicating disciplined cash allocation. The company also engages in share buybacks, enhancing shareholder value.
This balanced approach reflects prudent capital management, avoiding excessive distributions or buybacks. Historically, such policies align with sustainable long-term value creation by maintaining financial flexibility while rewarding shareholders moderately.
Score analysis
The following radar chart illustrates Veralto Corporation’s valuation and financial performance scores:
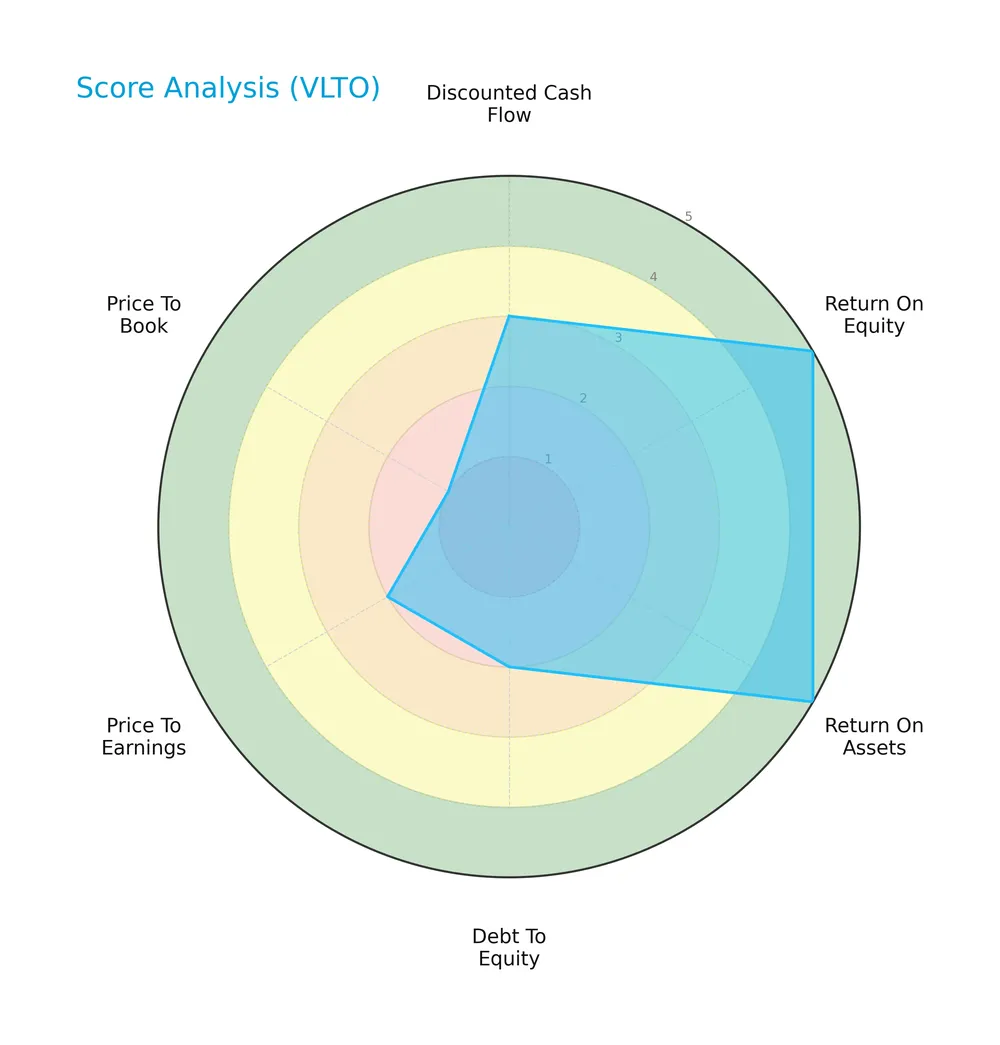
Veralto scores very favorably on return on equity and assets, indicating efficient capital use. However, debt-to-equity, price-to-earnings, and price-to-book scores are unfavorable, signaling leverage concerns and valuation challenges. The discounted cash flow score remains moderate.
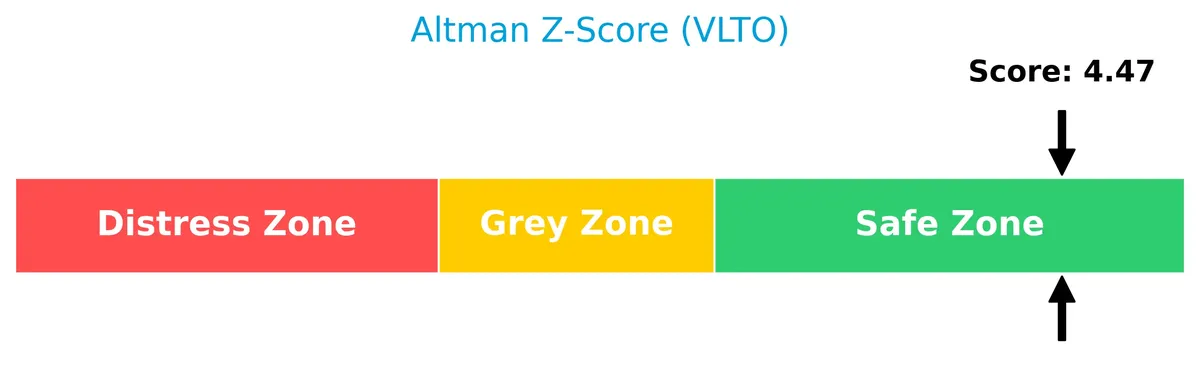
Analysis of the company’s bankruptcy risk
The Altman Z-Score places Veralto firmly in the safe zone, indicating low bankruptcy risk and solid financial stability:
Is the company in good financial health?
This Piotroski diagram presents Veralto’s financial health based on key profitability and efficiency metrics:

With a Piotroski Score of 5, Veralto shows average financial health. The score suggests moderate strength but leaves room for improvement in operational efficiency and liquidity management.
Competitive Landscape & Sector Positioning
This analysis explores Veralto Corporation’s sector, focusing on strategic positioning and revenue segments. I will assess whether Veralto holds a competitive advantage over its main industry rivals.
Strategic Positioning
Veralto Corporation operates through two distinct segments: Water Quality and Product Quality & Innovation. It maintains geographic diversification, generating roughly equal revenue from the US (2.44B) and other countries (2.45B) in 2025, with smaller contributions from China (336M) and Germany (281M).
Revenue by Segment
This pie chart illustrates Veralto Corporation’s revenue distribution by contract type for fiscal year 2025, comparing recurring and nonrecurring measurement revenues.
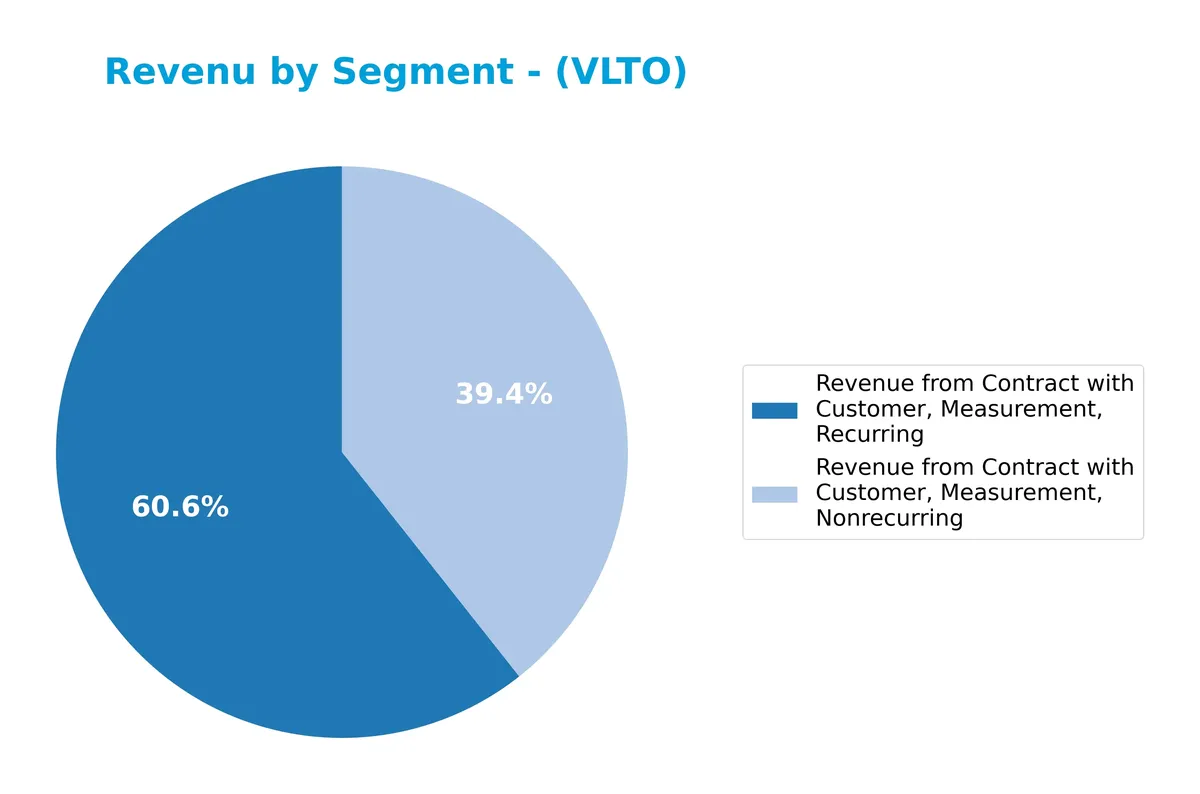
Veralto’s recurring measurement contracts dominate revenue with $3.36B in 2025, up from $3.15B in 2024, signaling steady growth and reliable cash flow. Nonrecurring measurement revenue also rose moderately to $2.14B. The business shows a healthy balance but leans on recurring contracts, reducing concentration risk and supporting valuation stability.
Key Products & Brands
Veralto Corporation’s key products and brands span water quality and product innovation segments as follows:
| Product | Description |
|---|---|
| Water Quality (WQ) Segment | Offers precision instrumentation and water treatment technologies for residential, commercial, and industrial use under Hach, Trojan Technologies, ChemTreat, and other brands. Includes chemical reagents, services, and digital water solutions. |
| Product Quality & Innovation (PQI) Segment | Provides marking and coding systems, inline printing solutions, software for digital asset and marketing resource management, design and imaging software, color management solutions, and color standard services under Videojet, Linx, Esko, X-Rite, and Pantone brands. |
Veralto’s product portfolio balances water analytics and treatment with advanced marking, coding, and color technology, serving diverse industries from municipal utilities to pharmaceuticals.
Main Competitors
The Industrials sector features 89 competitors, with the table below showing the top 10 leaders by market capitalization:
| Competitor | Market Cap. |
|---|---|
| GE Aerospace | 338B |
| Caterpillar Inc. | 280B |
| RTX Corporation | 251B |
| The Boeing Company | 171B |
| Union Pacific Corporation | 138B |
| Eaton Corporation plc | 127B |
| Deere & Company | 126B |
| Honeywell International Inc. | 124B |
| Lockheed Martin Corporation | 116B |
| Parker-Hannifin Corporation | 114B |
Veralto Corporation ranks 56th among 89 competitors, with a market cap at 6.83% of the leader, GE Aerospace. It sits below both the average market cap of the top 10 (179B) and the sector median (36B). Veralto is 6.47% smaller than its closest competitor above, highlighting a moderate gap in scale.
Comparisons with competitors
Check out how we compare the company to its competitors:
Aucun article trouvé pour ces critères.
Does Veralto have a competitive advantage?
Veralto presents a competitive advantage, demonstrated by a ROIC exceeding its WACC by 7.9%, indicating efficient capital use and value creation. However, its ROIC trend shows a notable decline of 29%, signaling weakening profitability.
Looking ahead, Veralto’s diverse product lines in water quality and packaging solutions position it to capture growth across municipal, industrial, and consumer markets. Expansion in digital and chemical reagent offerings offers opportunities to offset margin pressures.
SWOT Analysis
This SWOT analysis highlights Veralto Corporation’s strategic position by examining internal strengths and weaknesses alongside external opportunities and threats.
Strengths
- strong ROIC at 16.15% well above WACC
- diversified product portfolio across water and product quality segments
- favorable income margins and robust net margin growth
Weaknesses
- elevated valuation metrics with high P/E and P/B ratios
- declining ROIC trend signals margin pressure
- moderate Piotroski score indicates average financial strength
Opportunities
- expanding global water treatment demand
- growth potential in digital and packaging innovation
- cross-selling opportunities between segments
Threats
- rising raw material and operational costs
- regulatory risks in industrial pollution control
- competition from specialized niche players
Veralto’s solid profitability and brand diversity create a competitive advantage. However, elevated valuations and a declining ROIC require cautious capital allocation. Growth initiatives in water analytics and packaging tech must offset margin risks and external pressures.
Stock Price Action Analysis
The weekly stock chart below illustrates Veralto Corporation’s price movements and volatility over the past 100 weeks:
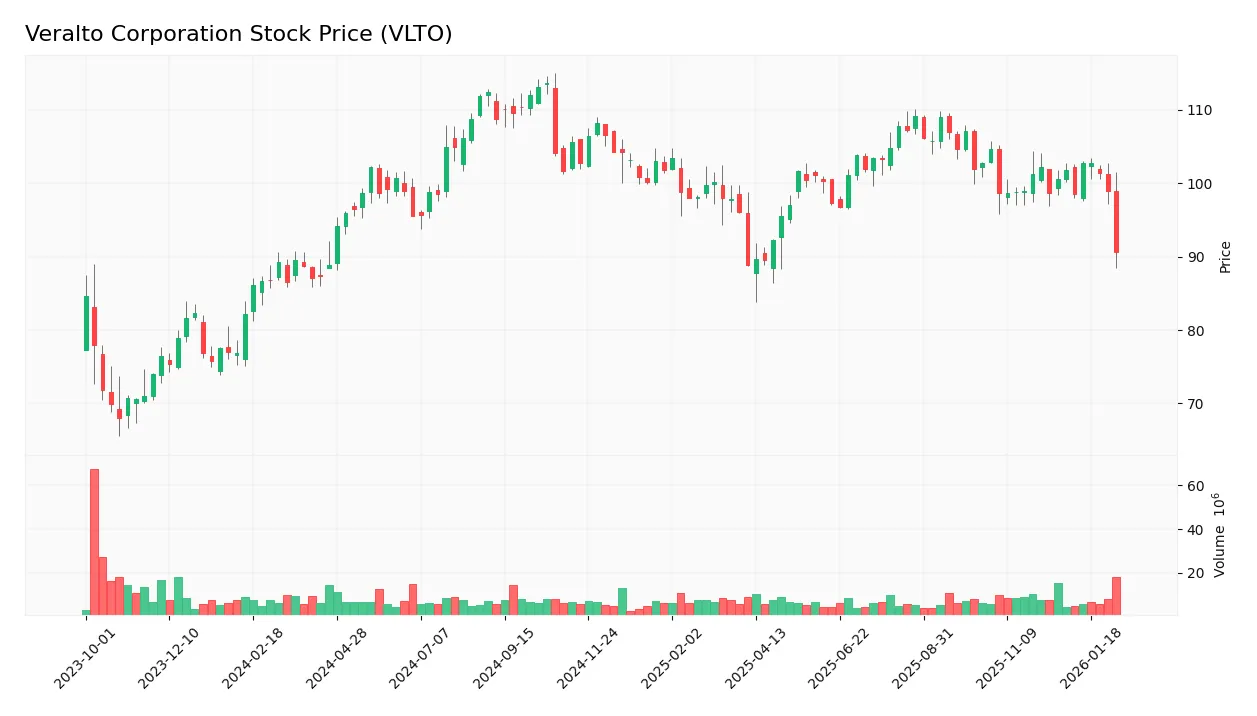
Trend Analysis
Over the past 12 months, VLTO’s stock gained 4.99%, indicating a bullish trend. The trend shows deceleration despite a 5.87 volatility level. The highest price reached 113.6, with a low of 87.09. However, a recent 2.5-month period saw an 8.89% decline, reflecting short-term bearish pressure.
Volume Analysis
Total volume reached 890M shares, with buyers accounting for 58.2%, signaling buyer dominance. However, volume trends downwards overall. Recent three-month activity remains slightly buyer-dominant at 53.1%, suggesting cautious investor participation amid declining volume.
Target Prices
Analysts set a clear target consensus for Veralto Corporation, signaling moderate upside potential.
| Target Low | Target High | Consensus |
|---|---|---|
| 102 | 118 | 108.57 |
The target range reflects confidence in Veralto’s growth, with a consensus price suggesting 5-10% upside from current levels.

Don’t Let Luck Decide Your Entry Point
Optimize your entry points with our advanced ProRealTime indicators. You’ll get efficient buy signals with precise price targets for maximum performance. Start outperforming now!
Analyst & Consumer Opinions
This section examines Veralto Corporation’s recent analyst grades alongside consumer feedback to gauge market sentiment.
Stock Grades
Here is the latest overview of Veralto Corporation’s stock grades from reputable financial institutions:
| Grading Company | Action | New Grade | Date |
|---|---|---|---|
| RBC Capital | Maintain | Sector Perform | 2026-02-05 |
| Citigroup | Maintain | Neutral | 2026-02-05 |
| Jefferies | Downgrade | Hold | 2025-12-10 |
| BMO Capital | Maintain | Outperform | 2025-11-25 |
| UBS | Maintain | Neutral | 2025-11-05 |
| Citigroup | Maintain | Neutral | 2025-10-30 |
| RBC Capital | Maintain | Sector Perform | 2025-10-30 |
| Barclays | Maintain | Overweight | 2025-10-30 |
| Barclays | Maintain | Overweight | 2025-10-06 |
| RBC Capital | Maintain | Sector Perform | 2025-07-30 |
The consensus leans toward a Hold rating, reflecting cautious optimism. Notably, no recent upgrades or downgrades contradict a generally stable outlook.
Consumer Opinions
Veralto Corporation sparks mixed reactions from its customer base, reflecting both loyalty and areas for improvement.
| Positive Reviews | Negative Reviews |
|---|---|
| “Product quality consistently exceeds expectations.” | “Customer service response times are slow.” |
| “Innovative features keep me coming back.” | “Pricing feels high compared to competitors.” |
| “Reliable performance and durability.” | “Occasional issues with software updates.” |
Overall, consumers praise Veralto’s product quality and innovation. However, slow customer support and premium pricing remain recurring concerns that could impact brand loyalty.
Risk Analysis
Below is a table summarizing Veralto Corporation’s key risks by category, probability, and impact:
| Category | Description | Probability | Impact |
|---|---|---|---|
| Valuation Risk | Elevated P/E (26.36) and P/B (7.98) ratios suggest potential overvaluation versus industry norms. | Moderate | High |
| Leverage Risk | Debt-to-equity ratio of 0.86 signals moderate leverage; interest coverage remains strong at 13.2x. | Moderate | Medium |
| Market Volatility | Beta of 1.11 indicates sensitivity to market swings, exposing investors to sector cyclicality. | High | Medium |
| Dividend Yield Risk | Low dividend yield of 0.44% may deter income-focused investors amid rising rates. | High | Low |
| Financial Health | Altman Z-score of 4.5 places the company firmly in a safe zone, reducing bankruptcy risk. | Low | Low |
| Operational Risk | Exposure to industrial and municipal sectors may face regulatory changes impacting growth. | Moderate | Medium |
Valuation risks stand out given the high P/E and P/B multiples, raising caution about price sustainability. Market volatility is significant due to a beta above 1, reflecting cyclical sensitivity. However, the robust Altman Z-score and strong interest coverage mitigate default concerns. Investors should monitor regulatory shifts affecting Veralto’s industrial water treatment and packaging segments.
Should You Buy Veralto Corporation?
Veralto appears to be a moderately profitable company with a slightly favorable moat, creating value despite declining ROIC. Its leverage profile shows moderate risk, reflected in a B+ rating, suggesting a balanced but cautious investment profile.
Strength & Efficiency Pillars
Veralto Corporation exhibits solid profitability, with a net margin of 17.08% and a return on equity (ROE) of 30.26%. Its return on invested capital (ROIC) stands at 16.15%, well above the weighted average cost of capital (WACC) at 8.27%, confirming it as a clear value creator. Operating efficiency is also strong, supported by a favorable EBIT margin of 23.06% and an interest expense ratio of only 1.74%. These metrics collectively indicate robust operational performance amid a slightly favorable moat.
Weaknesses and Drawbacks
Despite operational strengths, valuation metrics raise concerns. The price-to-earnings (P/E) ratio at 26.36 and price-to-book (P/B) ratio at 7.98 suggest a premium valuation that may pressure future returns. Although leverage is moderate with a debt-to-equity ratio of 0.86, the dividend yield is low at 0.44%, potentially limiting income appeal. Market volume trends show decreasing activity, and recent price momentum deceleration signals caution on short-term liquidity and investor sentiment.
Our Final Verdict about Veralto Corporation
Veralto’s long-term fundamentals appear attractive, supported by strong profitability and value creation. However, recent market deceleration and premium valuations suggest a cautious stance. Despite a bullish overall trend, the slight buyer dominance and recent price pullback recommend a wait-and-see approach for a more favorable entry point. The company might appeal to investors prioritizing operational strength but wary of near-term market pressures.
Disclaimer: This content is for informational purposes only and does not constitute financial, investment, or other professional advice. Investing in financial markets involves a significant risk of loss, and past performance is not indicative of future results.
Additional Resources
- Public Sector Pension Investment Board Purchases 12,271 Shares of Veralto Corporation $VLTO – MarketBeat (Feb 21, 2026)
- Veralto Corporation $VLTO Shares Acquired by HFR Wealth Management LLC – MarketBeat (Feb 21, 2026)
- Are Wall Street Analysts Predicting Veralto Stock Will Climb or Sink? – Yahoo Finance (Feb 17, 2026)
- Veralto Reports Fourth Quarter and Full Year 2025 Results – PR Newswire (Feb 03, 2026)
- Veralto Announces Agreement to Acquire In-Situ and Establishes $750 Million Share Repurchase Program – PR Newswire (Nov 25, 2025)
For more information about Veralto Corporation, please visit the official website: veralto.com