Home > Analyses > Real Estate > Ventas, Inc.
Ventas, Inc. transforms healthcare real estate, shaping environments where care providers thrive and patients benefit. As a top REIT in healthcare facilities, Ventas commands a diverse portfolio and partners with industry leaders to leverage the aging population trend. Its reputation for innovation and steady cash flow highlights a resilient strategy through market cycles. The question now is whether Ventas’s strong fundamentals still justify its premium valuation and growth outlook in 2026.

Table of contents
Business Model & Company Overview
Ventas, Inc., founded in 1997 and headquartered in Chicago, stands as a leading REIT in healthcare facilities. It operates a diversified ecosystem that bridges real estate with healthcare, supporting providers, research institutions, and innovators. With a portfolio of approximately 1,200 properties, Ventas leverages its scale and expertise to serve an aging population’s growing needs, anchoring its position in a niche that blends stability with demographic growth.
The company generates value through a balanced mix of property ownership and joint ventures across the Americas, Europe, and Asia. Its revenue engine combines stable rental income from high-quality healthcare tenants and strategic capital deployment. Ventas’s competitive advantage lies in its seasoned management team and resilient portfolio, creating a durable economic moat that shapes the future of healthcare real estate investment.
Financial Performance & Fundamental Metrics
I analyze Ventas, Inc.’s income statement, key financial ratios, and dividend payout policy to assess its operational efficiency and shareholder value creation.
Income Statement
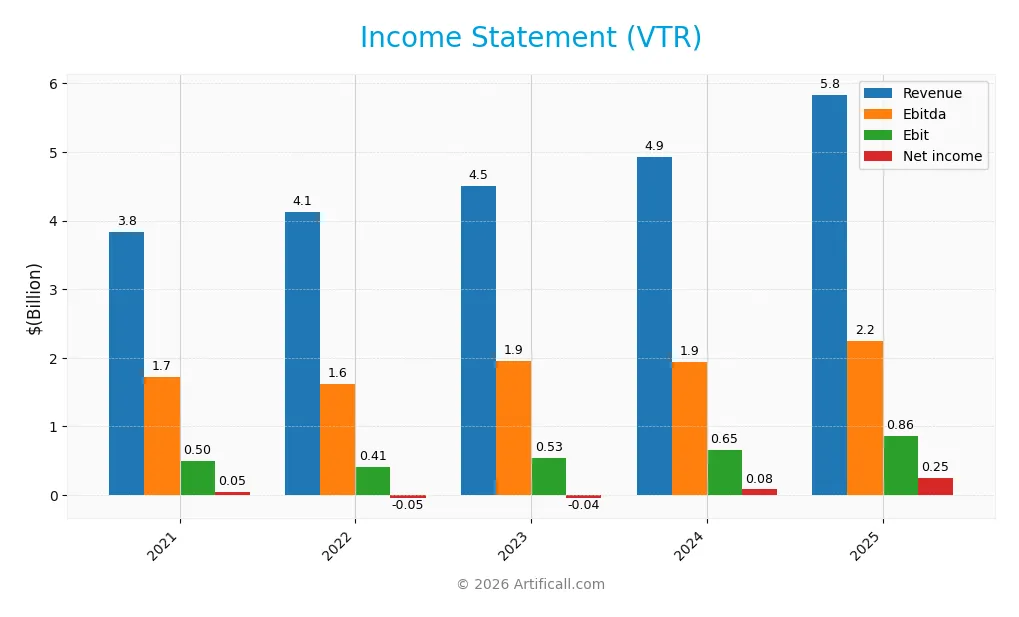
The table below summarizes Ventas, Inc.’s key income statement figures for fiscal years 2021 through 2025, reflecting trends in revenue, profitability, and earnings per share.
| 2021 | 2022 | 2023 | 2024 | 2025 | |
|---|---|---|---|---|---|
| Revenue | 3.83B | 4.13B | 4.50B | 4.92B | 5.83B |
| Cost of Revenue | 2.09B | 2.28B | 2.56B | 2.83B | 6.18B |
| Operating Expenses | 1.32B | 1.36B | 1.52B | 1.42B | -1.17B |
| Gross Profit | 1.74B | 1.85B | 1.94B | 2.10B | -344M |
| EBITDA | 1.72B | 1.62B | 1.95B | 1.94B | 2.24B |
| EBIT | 501M | 410M | 534M | 653M | 860M |
| Interest Expense | 440M | 468M | 574M | 603M | 612M |
| Net Income | 49M | -47M | -41M | 81M | 251M |
| EPS | 0.13 | -0.13 | -0.10 | 0.20 | 0.55 |
| Filing Date | 2022-02-18 | 2023-02-10 | 2024-02-15 | 2025-02-13 | 2026-02-06 |
Income Statement Evolution
Ventas, Inc. posted 52% revenue growth from 2021 to 2025, accelerating to 18% in the last year. Net income surged over 400% in five years, with a 161% jump in 2025 alone. Despite this, gross margin turned negative in 2025, reflecting higher costs. However, EBIT margin improved, indicating better operational control despite margin pressures.
Is the Income Statement Favorable?
In 2025, revenue increased by 18%, driven by operational expansion and cost management. EBIT margin rose to a favorable 14.7%, while net margin remained neutral at 4.3%, signaling moderate profitability. Interest expense at 10.5% of revenue is a concern, pressuring net income. Overall, the income statement fundamentals appear favorable but warrant caution on cost and interest trends.
Financial Ratios
The table below presents key financial ratios for Ventas, Inc. over the 2021–2025 fiscal years, illustrating its profitability, liquidity, leverage, and efficiency:
| Ratios | 2021 | 2022 | 2023 | 2024 | 2025 |
|---|---|---|---|---|---|
| Net Margin | 1.3% | -1.1% | -0.9% | 1.6% | 4.3% |
| ROE | 0.5% | -0.5% | -0.4% | 0.8% | 2.0% |
| ROIC | 1.7% | 1.5% | 1.3% | 2.7% | 21.6% |
| P/E | 399.3 | -354.5 | -488.8 | 298.8 | 140.1 |
| P/B | 1.8 | 1.7 | 2.1 | 2.3 | 2.8 |
| Current Ratio | 0.62 | 0.61 | 0.73 | 1.04 | 5.04 |
| Quick Ratio | 0.62 | 0.61 | 0.73 | 1.04 | 5.04 |
| D/E | 1.13 | 1.23 | 1.44 | 1.28 | 1.07 |
| Debt-to-Assets | 49.5% | 51.7% | 55.4% | 52.5% | 48.7% |
| Interest Coverage | 0.96 | 1.03 | 0.72 | 1.13 | 1.35 |
| Asset Turnover | 0.15 | 0.17 | 0.18 | 0.19 | 0.21 |
| Fixed Asset Turnover | 0 | 0 | 0 | 0 | 0 |
| Dividend Yield | 3.5% | 4.3% | 3.6% | 3.1% | 2.4% |
Evolution of Financial Ratios
Ventas, Inc. shows a mixed trend in key metrics over recent years. Return on Equity (ROE) has remained low and mostly unfavorable, peaking at 2.01% in 2025. The Current Ratio surged to 5.04 in 2025, indicating improved liquidity but deviating from typical benchmarks. Debt-to-Equity Ratio declined slightly to 1.07 but remains elevated, reflecting consistent leverage.
Are the Financial Ratios Favorable?
In 2025, profitability ratios like net margin (4.31%) and ROE (2.01%) are weak, signaling challenges in earnings efficiency. The return on invested capital (21.6%) and WACC (6.57%) suggest value creation above cost of capital. Liquidity is strong via the quick ratio (5.04) but the high current ratio signals potential inefficiency. Leverage and interest coverage ratios raise caution. Overall, the ratio profile leans unfavorable.
Shareholder Return Policy
Ventas, Inc. maintains a consistent dividend payment with a yield around 2.4% in 2025 and a payout ratio near 3.4. Dividend coverage by free cash flow is solid, supported by share buybacks, indicating a balanced capital return approach.
The payout policy appears sustainable given current cash flow and capital expenditure coverage ratios. However, the company’s high price-to-earnings ratio suggests investors should monitor valuation risks alongside the dividend strategy.
Score analysis
Here is a radar chart illustrating the company’s scores across key financial metrics:
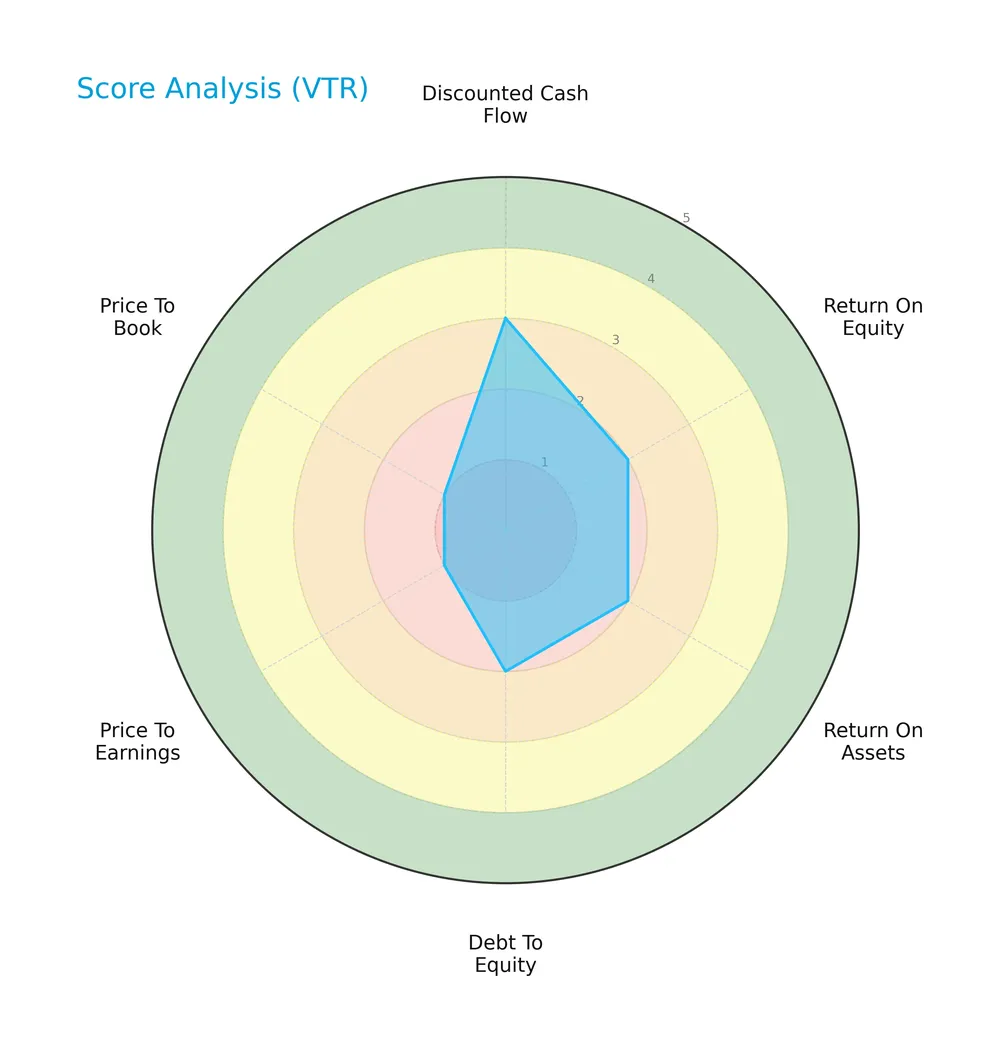
Ventas, Inc. scores moderately on discounted cash flow (3) but shows unfavorable returns on equity (2) and assets (2). Leverage is also unfavorable (2), while valuation multiples score very unfavorably (PE 1, PB 1).
Analysis of the company’s bankruptcy risk
The Altman Z-Score places the company in the distress zone, signaling a high risk of bankruptcy based on financial ratios:

Is the company in good financial health?
The Piotroski Score chart highlights the company’s financial strength based on nine key criteria:

With a Piotroski Score of 7, Ventas, Inc. demonstrates strong financial health despite other concerns, indicating solid profitability, leverage, and operational efficiency.
Competitive Landscape & Sector Positioning
This sector analysis examines Ventas, Inc.’s strategic positioning, revenue segments, key products, and major competitors. I will assess whether Ventas maintains a competitive advantage in its healthcare real estate niche.
Strategic Positioning
Ventas, Inc. concentrates in healthcare real estate with a diversified portfolio spanning senior living, medical offices, and triple net leased properties. Geographically, it focuses mainly on the U.S., with growing Canadian and modest U.K. exposure, leveraging demographic trends in aging populations.
Revenue by Segment
This pie chart illustrates Ventas, Inc.’s revenue distribution by segment for the fiscal year 2025, highlighting the relative size of each business unit’s contribution.
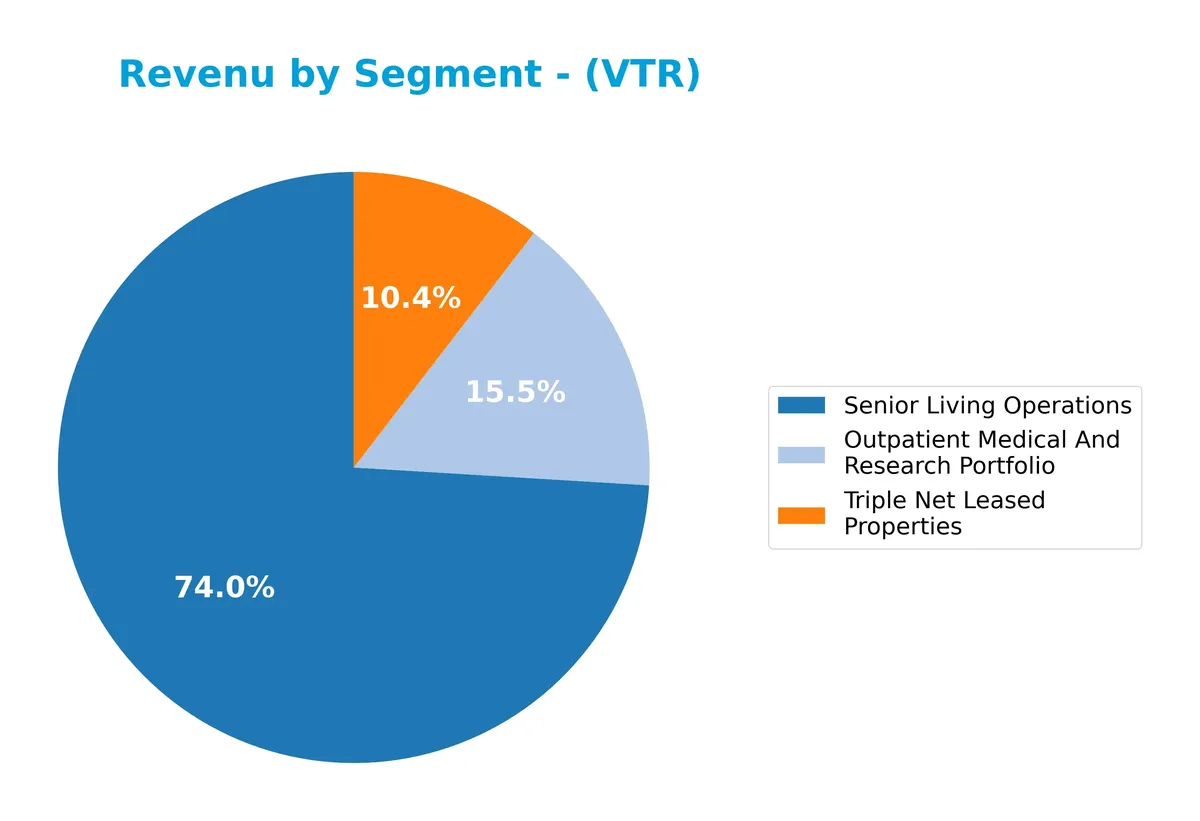
Ventas’ revenue is predominantly driven by Senior Living Operations at 4.3B in 2025, showing robust growth from 3.4B in 2024. Outpatient Medical and Research Portfolio contributes 898M, a new distinct segment replacing Medical Office Building Operations, which was about 878M in 2024. Triple Net Leased Properties remains stable around 602M. The shift towards outpatient medical services signals strategic repositioning with growth acceleration in senior living.
Key Products & Brands
Ventas generates revenue from diversified healthcare real estate and related operations, including senior living and medical properties:
| Product | Description |
|---|---|
| Senior Living Operations | Revenue from managing and operating senior living communities, the largest segment at $4.28B in 2025. |
| Medical Office Building Operations | Income from owning and operating medical office buildings, reported as $898M in 2025. |
| Outpatient Medical And Research Portfolio | Revenue related to outpatient medical facilities and research properties, $898M in 2025. |
| Triple Net Leased Properties | Income from properties leased on a triple net basis, contributing $602M in 2025. |
Ventas focuses on senior living and healthcare real estate, with senior living operations dominating its revenue mix. The company balances growth across medical office and triple net leased assets, reflecting a diversified healthcare REIT model.
Main Competitors
There are 3 competitors in total, with the table below listing the top 3 leaders by market capitalization:
| Competitor | Market Cap. |
|---|---|
| Welltower Inc. | 128.3B |
| Ventas, Inc. | 34.2B |
| Healthpeak Properties, Inc. | 11.3B |
Ventas, Inc. ranks 2nd among its competitors with a market cap at 30.56% of the leader, Welltower Inc. The company is below the average market cap of the top 10 in the sector but above the sector median. It holds a strong lead over the next competitor, Healthpeak Properties, by more than 248%.
Comparisons with competitors
Check out how we compare the company to its competitors:
Does VTR have a competitive advantage?
Ventas, Inc. presents a clear competitive advantage, shown by its very favorable moat status. The company creates value with an ROIC surpassing WACC by 15%, and a strong upward ROIC trend indicating efficient capital use and growing profitability.
Looking ahead, Ventas leverages its high-quality, diversified healthcare real estate portfolio and partnerships with leading care providers. This positions the company to capture opportunities from demographic shifts and expand across key markets like the U.S., Canada, and the U.K.
SWOT Analysis
This SWOT analysis highlights Ventas, Inc.’s core competitive factors and risks shaping its strategic outlook.
Strengths
- strong ROIC well above WACC
- diversified healthcare real estate portfolio
- consistent revenue growth
Weaknesses
- high debt-to-equity ratio
- low interest coverage ratio
- elevated P/E ratio signals overvaluation
Opportunities
- aging population driving healthcare demand
- expansion in US and Canada markets
- partnerships with industry leaders
Threats
- rising interest rates increasing debt costs
- healthcare regulatory risks
- economic cycles affecting real estate values
Ventas’ durable competitive advantage and demographic tailwinds position it well for growth. However, elevated leverage and valuation warrant cautious risk management.
Stock Price Action Analysis
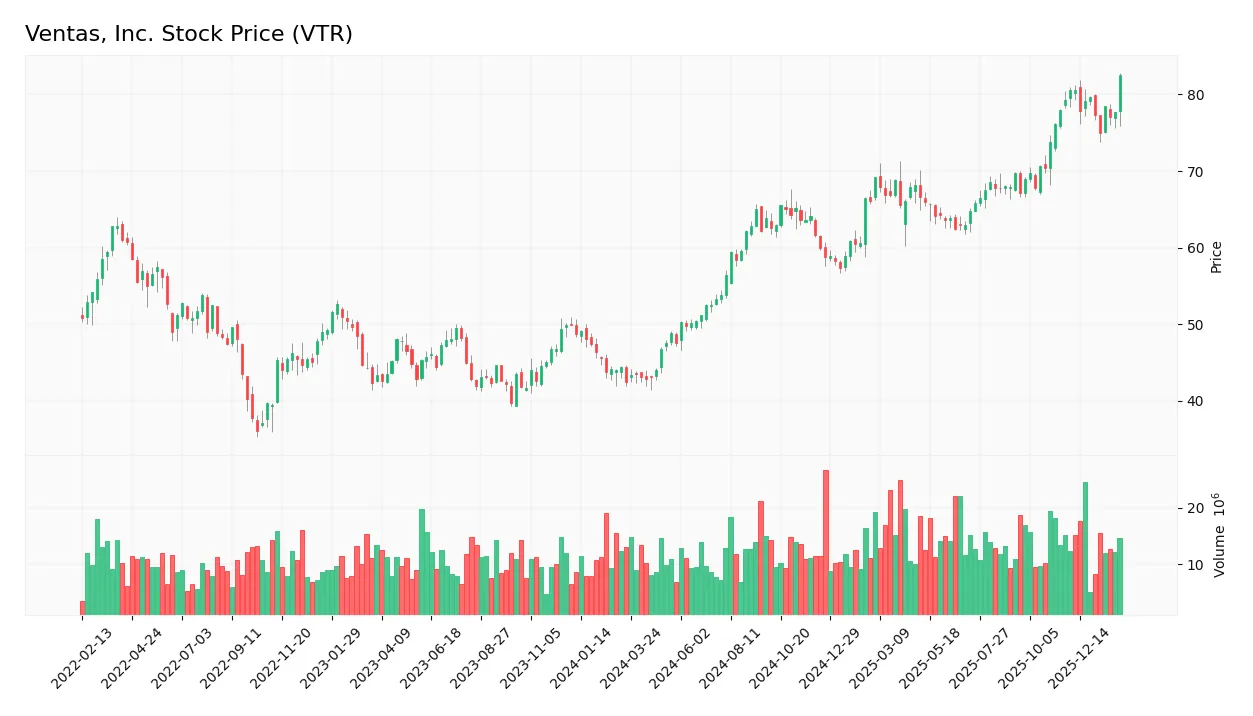
The weekly stock chart for Ventas, Inc. (VTR) over the last 12 months reveals significant price movement and key support and resistance levels:
Trend Analysis
Over the past year, VTR’s stock price rose 94.33%, indicating a strong bullish trend. The highest price reached was 82.55, the lowest 42.48, with deceleration in momentum. Recent three-month gains of 4.18% show a neutral trend with slight downward slope and reduced volatility (1.93 std deviation).
Volume Analysis
Trading volume over the last three months is increasing, with buyer volume comprising 58.05%, showing slight buyer dominance. This suggests growing investor interest and moderate positive sentiment supporting price stability in the recent period.
Target Prices
Analysts present a moderately bullish consensus on Ventas, Inc., with a balanced range reflecting cautious optimism.
| Target Low | Target High | Consensus |
|---|---|---|
| 73 | 94 | 84.75 |
The target prices suggest upside potential from current levels, with most analysts expecting a steady recovery in the real estate investment trust sector.

Don’t Let Luck Decide Your Entry Point
Optimize your entry points with our advanced ProRealTime indicators. You’ll get efficient buy signals with precise price targets for maximum performance. Start outperforming now!
Analyst & Consumer Opinions
This section examines grades and consumer feedback related to Ventas, Inc. (VTR), providing balanced insights.
Stock Grades
The following table shows recent verified grades for Ventas, Inc. from established financial institutions:
| Grading Company | Action | New Grade | Date |
|---|---|---|---|
| Keybanc | Maintain | Overweight | 2025-12-04 |
| Wells Fargo | Maintain | Overweight | 2025-11-25 |
| Scotiabank | Maintain | Sector Perform | 2025-11-13 |
| Citigroup | Maintain | Buy | 2025-11-11 |
| Cantor Fitzgerald | Maintain | Overweight | 2025-10-31 |
| Wells Fargo | Maintain | Overweight | 2025-10-21 |
| Evercore ISI Group | Maintain | Outperform | 2025-09-15 |
| Scotiabank | Maintain | Sector Perform | 2025-08-28 |
| Argus Research | Maintain | Buy | 2025-08-26 |
| JP Morgan | Maintain | Overweight | 2025-08-26 |
Overall, grades consistently indicate a positive outlook, with multiple firms maintaining “Overweight” and “Buy” ratings. Sector Perform ratings appear stable, reflecting measured confidence in the stock’s performance.
Consumer Opinions
Ventas, Inc. sparks mixed reactions among consumers, reflecting its complex footprint in healthcare real estate.
| Positive Reviews | Negative Reviews |
|---|---|
| Reliable partnership with healthcare providers | Some complaints about slow response times |
| Strong portfolio of high-quality properties | Concerns over rising rental costs |
| Transparent communication during lease negotiations | Occasional maintenance delays reported |
| Consistent property upgrades enhancing tenant experience | Limited flexibility in lease terms |
Overall, consumers appreciate Ventas’ quality assets and clear communication. However, recurring issues include responsiveness and lease rigidity, which could impact tenant satisfaction long-term.
Risk Analysis
Below is a summary of key risks facing Ventas, Inc., including their likelihood and potential impact:
| Category | Description | Probability | Impact |
|---|---|---|---|
| Financial Health | Altman Z-Score indicates distress risk, signaling potential bankruptcy risk. | High | High |
| Profitability | Low net margin (4.31%) and ROE (2.01%) constrain earnings growth. | Medium | Medium |
| Leverage | Debt-to-equity ratio of 1.07 and low interest coverage (1.4x) raise financial strain. | Medium | High |
| Valuation | Extremely high P/E (140x) suggests overvaluation risk. | Medium | Medium |
| Liquidity | Very high current ratio (5.04) signals inefficient capital use despite strong quick ratio. | Low | Low |
| Market Volatility | Beta of 0.77 indicates lower sensitivity to market swings but limits upside in bull markets. | Low | Low |
The Altman Z-Score places Ventas in the distress zone, a rare red flag in S&P 500 REITs. Combined with weak profitability and tight interest coverage, these financial stresses merit caution. The sky-high P/E ratio further signals market exuberance, raising valuation risk despite favorable ROIC vs. WACC dynamics. I advise close monitoring of debt servicing and earnings trends.
Should You Buy Ventas, Inc.?
Ventas, Inc. appears to be creating value with a durable moat supported by a growing ROIC well above WACC. While profitability shows gradual improvement, the company’s leverage profile and credit risk remain substantial. Its overall rating of C suggests cautious analytical interpretation.
Strength & Efficiency Pillars
Ventas, Inc. posts a solid EBIT margin of 14.73%, reflecting operational efficiency. Its ROIC stands at 21.6%, comfortably above the WACC of 6.57%, marking the company as a clear value creator. Despite a modest net margin of 4.31% and a low ROE of 2.01%, the firm’s growing ROIC trend and strong Piotroski score of 7 indicate improving profitability and financial strength over time.
Weaknesses and Drawbacks
Ventas is currently in financial distress, with a concerning Altman Z-Score of 1.55 signaling potential bankruptcy risk. This solvency red flag overshadows its operational metrics. The company also suffers from an extremely high P/E ratio of 140.08, implying an expensive valuation, while its debt-to-equity ratio of 1.07 and low interest coverage of 1.4 raise leverage concerns. Additionally, a high current ratio of 5.04, although seemingly liquid, may indicate inefficient capital deployment.
Our Final Verdict about Ventas, Inc.
Despite operational strengths and clear value creation, Ventas’ placement in the distress zone with an Altman Z-Score below 1.8 makes its financial profile highly speculative. The substantial solvency risk outweighs favorable margins and growth signs. Investors with low risk tolerance may find this profile too risky for conservative capital, requiring cautious monitoring rather than active exposure.
Disclaimer: This content is for informational purposes only and does not constitute financial, investment, or other professional advice. Investing in financial markets involves a significant risk of loss, and past performance is not indicative of future results.
Additional Resources
- Ventas, Inc. SEC 10-K Report – TradingView (Feb 06, 2026)
- Ventas Inc (VTR) Q4 2025 Earnings Call Highlights: Strong Growth and Strategic Investments … By GuruFocus – Investing.com Canada (Feb 06, 2026)
- Scotiabank Maintains Ventas Inc(VTR.US) With Hold Rating, Raises Target Price to $80 – 富途牛牛 (Feb 07, 2026)
- Ventas, Inc. (NYSE:VTR) Increases Dividend to $0.52 Per Share – MarketBeat (Feb 06, 2026)
- Ventas Q4 FFO Meet, Revenues Beat Estimates, Same-Store Cash NOI Rises – The Globe and Mail (Feb 07, 2026)
For more information about Ventas, Inc., please visit the official website: ventasreit.com