Home > Analyses > Consumer Defensive > US Foods Holding Corp.
US Foods Holding Corp. fuels America’s foodservice industry by delivering fresh, frozen, and dry products to thousands of kitchens nationwide. It commands a leading role with a vast distribution network and a reputation for quality and reliability. Known for innovation in supply chain efficiency, US Foods shapes how restaurants and institutions serve their customers. But as competition intensifies, I ask: does US Foods’ current financial strength support its lofty market valuation and growth ambitions?

Table of contents
Business Model & Company Overview
US Foods Holding Corp., founded in 2007 and headquartered in Rosemont, Illinois, stands as a dominant player in the food distribution industry. It operates a cohesive ecosystem that supplies fresh, frozen, and dry food alongside non-food products to a vast network of foodservice customers across the US. This network spans single-unit restaurants to national chains, hospitals, and government organizations, supported by 70 broadline and 80 cash-and-carry facilities.
The company’s revenue engine balances product distribution with an extensive national footprint, serving diverse markets including the Americas. Its scale and operational reach enable efficient supply chains critical to clients’ success. US Foods’ competitive advantage lies in its integrated platform, which fosters customer loyalty and positions it as a key architect in shaping the future of foodservice distribution.
Financial Performance & Fundamental Metrics
I analyze US Foods Holding Corp.’s income statement, key financial ratios, and dividend payout policy to assess its operational efficiency and shareholder returns.
Income Statement
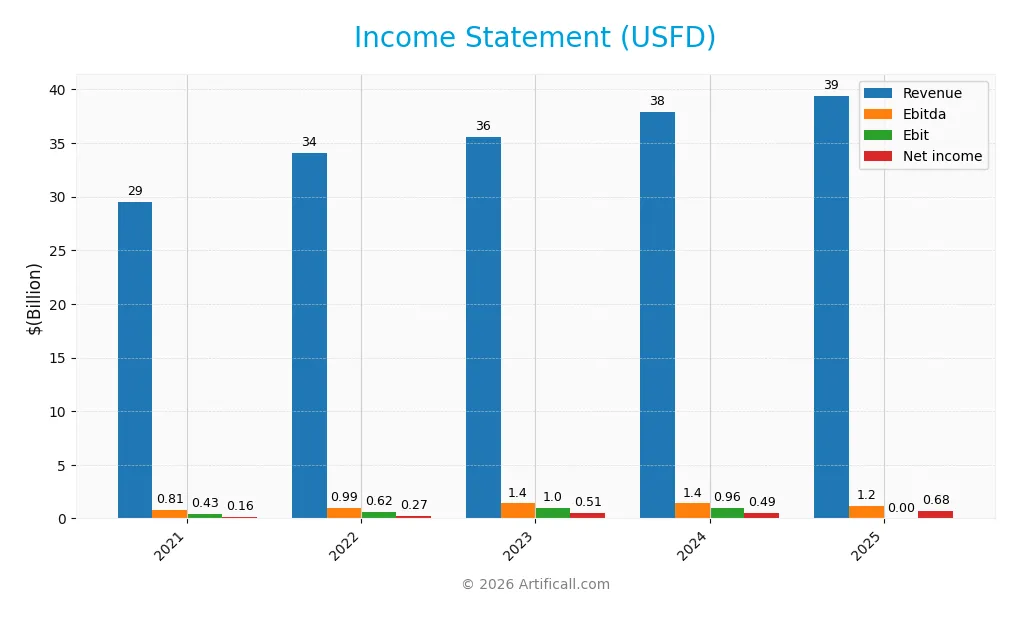
Below is the income statement for US Foods Holding Corp. (USFD) covering fiscal years 2021 through 2025. Values are in USD.
| 2021 | 2022 | 2023 | 2024 | 2025 | |
|---|---|---|---|---|---|
| Revenue | 29.5B | 34.1B | 35.6B | 37.9B | 39.4B |
| Cost of Revenue | 24.8B | 28.6B | 29.4B | 31.3B | 32.6B |
| Operating Expenses | 4.23B | 4.90B | 5.13B | 5.44B | 5.67B |
| Gross Profit | 4.65B | 5.49B | 6.15B | 6.53B | 6.86B |
| EBITDA | 805M | 988M | 1.40B | 1.40B | 1.20B |
| EBIT | 427M | 616M | 1.00B | 959M | 0 |
| Interest Expense | 213M | 255M | 324M | 315M | 305M |
| Net Income | 164M | 265M | 506M | 494M | 676M |
| EPS | 0.55 | 1.02 | 2.09 | 2.05 | 2.98 |
| Filing Date | 2022-02-17 | 2023-02-17 | 2024-02-15 | 2025-02-13 | 2026-02-12 |
Income Statement Evolution
US Foods Holding Corp. (USFD) recorded steady revenue growth, rising 33.7% from 2021 to 2025. Gross profit expanded 5.05% year-over-year in 2025, supporting a stable gross margin near 17.4%. However, EBIT declined sharply in 2025, erasing prior gains, while net income surged 31.5% with improved net margins, reflecting mixed margin trends.
Is the Income Statement Favorable?
The 2025 income statement shows a favorable net margin of 1.71%, boosted by a 45.5% EPS increase. Despite a neutral gross margin and a 0% EBIT margin—markedly unfavorable—the company’s interest expenses remain well-managed. Overall, fundamentals are positive with growth in profitability counterbalancing operational margin pressure.
Financial Ratios
The following table presents key financial ratios for US Foods Holding Corp. from 2021 to 2025, highlighting profitability, liquidity, leverage, and market valuation metrics:
| Ratios | 2021 | 2022 | 2023 | 2024 | 2025 |
|---|---|---|---|---|---|
| Net Margin | 0.56% | 0.78% | 1.42% | 1.30% | 1.71% |
| ROE | 3.84% | 5.90% | 10.65% | 10.91% | 15.70% |
| ROIC | 3.16% | 4.23% | 7.26% | 8.02% | 8.61% |
| P/E | 47.15 | 28.76 | 21.45 | 33.26 | 25.64 |
| P/B | 1.81 | 1.70 | 2.29 | 3.63 | 4.03 |
| Current Ratio | 1.41 | 1.37 | 1.30 | 1.21 | 1.16 |
| Quick Ratio | 0.75 | 0.79 | 0.78 | 0.71 | 0.68 |
| D/E | 1.28 | 1.18 | 1.10 | 1.20 | 1.21 |
| Debt-to-Assets | 43.7% | 41.6% | 39.4% | 40.4% | 37.3% |
| Interest Coverage | 1.99 | 2.33 | 3.14 | 3.49 | 3.93 |
| Asset Turnover | 2.36 | 2.67 | 2.70 | 2.82 | 2.83 |
| Fixed Asset Turnover | 14.5 | 15.7 | 15.6 | 15.8 | 14.7 |
| Dividend Yield | 0.36% | 0.49% | 0.06% | 0.00% | 0.00% |
Evolution of Financial Ratios
US Foods Holding Corp.’s Return on Equity (ROE) improved steadily from 3.8% in 2021 to 15.7% in 2025, signaling enhanced profitability. The Current Ratio declined from 1.41 to 1.16, showing reduced short-term liquidity. Debt-to-Equity Ratio remained elevated, fluctuating around 1.1 to 1.2, indicating consistent leverage levels over the period.
Are the Financial Ratios Fovorable?
In 2025, profitability shows mixed signals: ROE is favorable at 15.7%, but net profit margin is low at 1.71%, marked unfavorable. Liquidity ratios are neutral to weak; Current Ratio is 1.16 (neutral), Quick Ratio 0.68 (unfavorable). Leverage remains a concern with a Debt-to-Equity ratio of 1.21 (unfavorable). Asset efficiency is strong, with asset turnover at 2.83 (favorable). Overall, ratios lean slightly unfavorable.
Shareholder Return Policy
US Foods Holding Corp. (USFD) has not paid dividends since 2024, reflecting a zero dividend payout ratio and yield. The company does not currently engage in share buybacks, indicating a focus on reinvestment or other capital uses.
This approach aligns with sustaining long-term shareholder value through internal funding rather than immediate cash returns. Given the absence of dividends and buybacks, investors should monitor how retained earnings support growth or debt management.
Score analysis
The following radar chart illustrates key financial scores across valuation and profitability metrics for a comprehensive view:
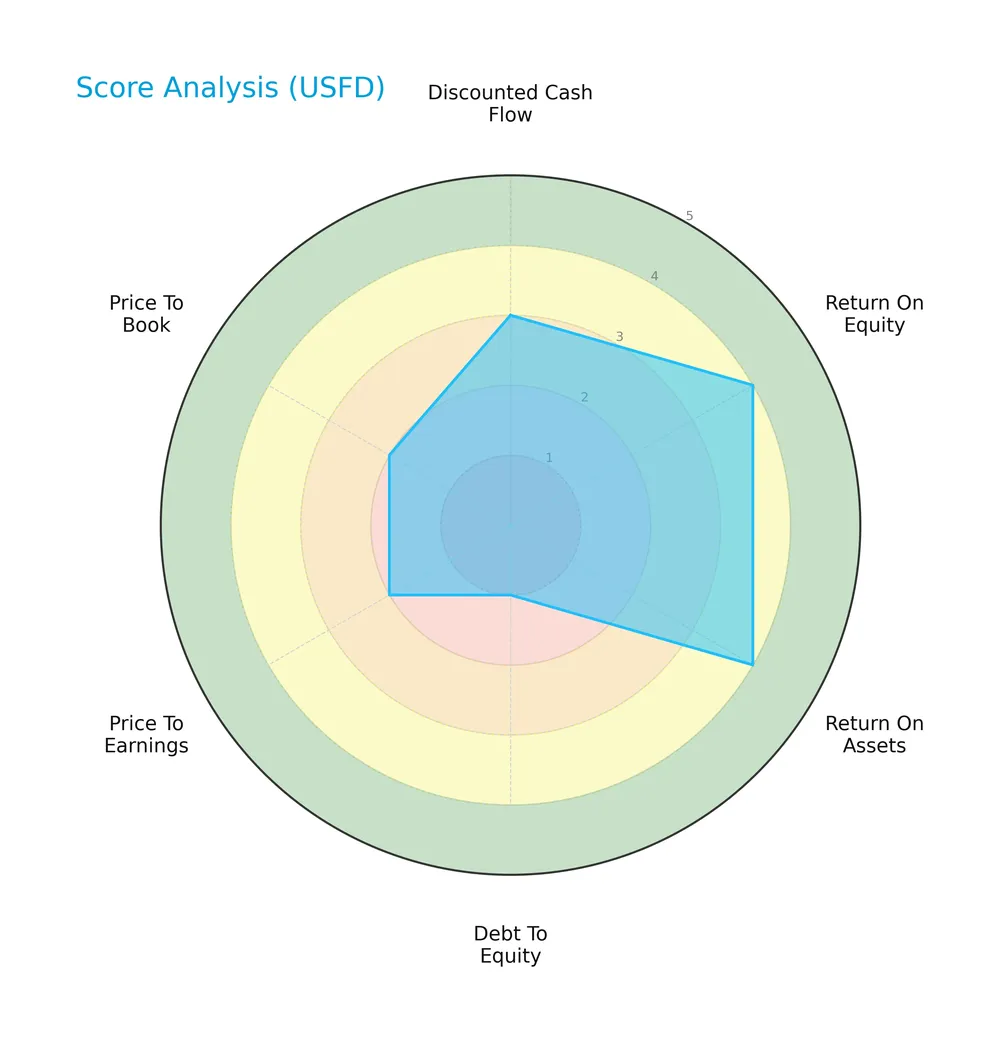
US Foods Holding Corp. scores moderately on discounted cash flow (3) with favorable returns on equity (4) and assets (4). However, its debt-to-equity ratio is very unfavorable (1), and valuation multiples—P/E (2) and P/B (2)—are also weak.
Analysis of the company’s bankruptcy risk
The Altman Z-Score places the company firmly in the safe zone, indicating a low risk of bankruptcy and solid financial stability:

Is the company in good financial health?
This Piotroski diagram highlights the company’s financial strength based on profitability, leverage, and efficiency criteria:

With a Piotroski Score of 6, US Foods Holding shows average financial health. This suggests reasonable strength but leaves room for improvement relative to top-tier value investments.
Competitive Landscape & Sector Positioning
This analysis examines US Foods Holding Corp.’s role within the food distribution sector, focusing on strategic positioning and revenue breakdown. I will assess whether US Foods holds a competitive advantage over its main competitors based on product offerings and market reach.
Strategic Positioning
US Foods Holding Corp. maintains a diversified product portfolio with seven distinct segments, each generating significant revenue. The company focuses exclusively on the U.S. market, serving a broad range of foodservice customers, from independent restaurants to government institutions, reinforcing a concentrated geographic strategy within the food distribution sector.
Revenue by Segment
The pie chart illustrates US Foods Holding Corp.’s revenue distribution by product segment for the fiscal year 2025.
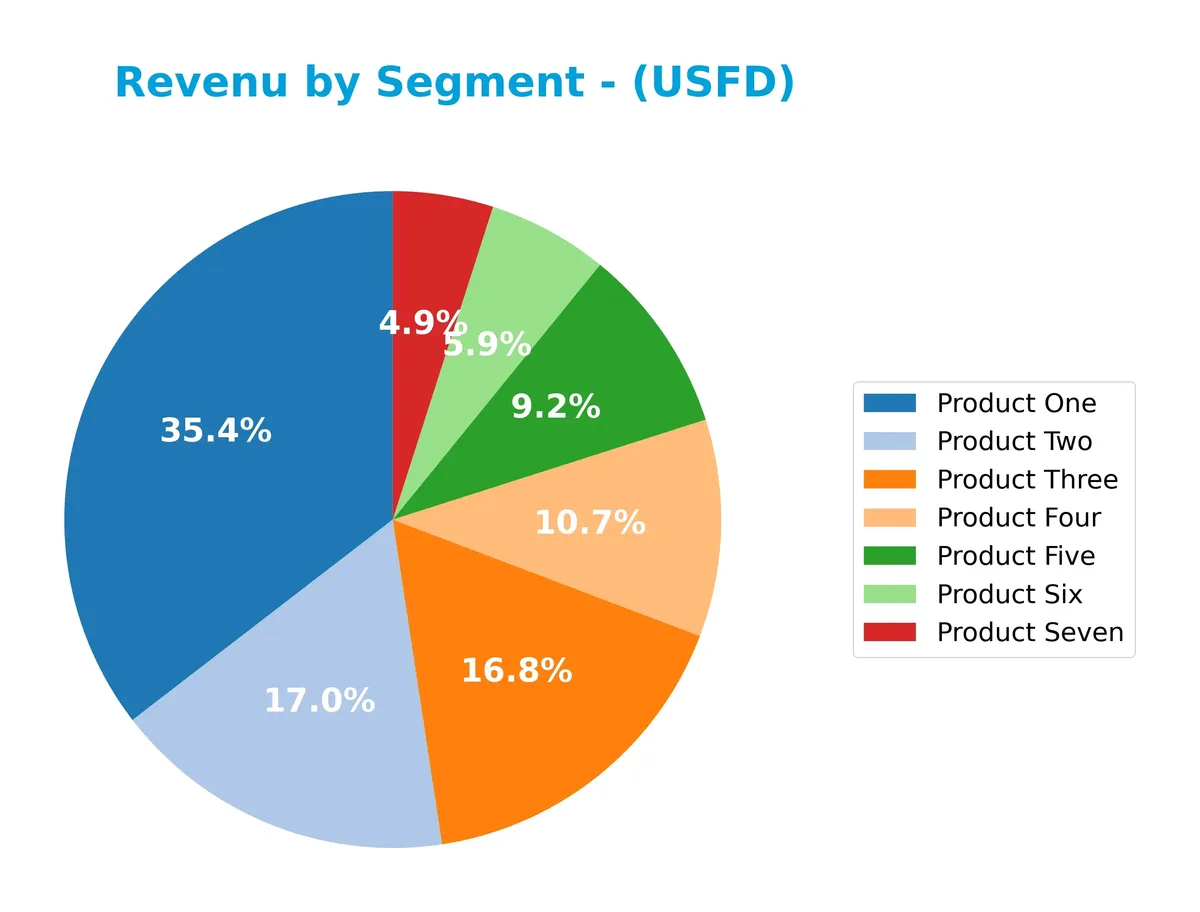
Product One dominates with $13.97B, followed by Product Two and Product Three at $6.69B and $6.64B, respectively. Product Four and Product Five also contribute significantly with $4.21B and $3.63B. The most recent year shows steady growth in top segments, particularly Product One, indicating strong core demand and limited concentration risk despite reliance on a few large product lines.
Key Products & Brands
US Foods Holding Corp. generates revenue from a diverse range of product categories as follows:
| Product | Description |
|---|---|
| Product One | Largest revenue contributor; core foodservice products. |
| Product Two | Significant segment supporting food distribution. |
| Product Three | Mid-sized revenue category in food and related supplies. |
| Product Four | Growing segment contributing over $4B in recent years. |
| Product Five | Consistent revenue stream around $3.6B annually. |
| Product Six | Smaller segment, but steadily increasing revenue. |
| Product Seven | Lowest revenue category, near $2B in 2025. |
US Foods’ revenue streams show a clear tiering, with Product One dominating and others supporting a broad portfolio. This diversification helps stabilize overall sales in a competitive food distribution sector.
Main Competitors
There are 3 main competitors in the Food Distribution industry; below is a table of the top 3 leaders by market capitalization:
| Competitor | Market Cap. |
|---|---|
| Sysco Corporation | 35.2B |
| US Foods Holding Corp. | 16.8B |
| Performance Food Group Company | 14.1B |
US Foods Holding Corp. ranks 2nd among its competitors. Its market cap is 63% of the sector leader, Sysco Corporation. The company is positioned above both the average market cap of the top 10 competitors (22B) and the median in the sector (16.8B). It maintains a 58% gap below the leader, highlighting a significant scale difference with the top player.
Comparisons with competitors
Check out how we compare the company to its competitors:
Does US Foods Holding Corp. have a competitive advantage?
US Foods Holding Corp. currently does not demonstrate a clear competitive advantage, as its ROIC remains below WACC, indicating value shedding despite improving profitability. The company’s food distribution sector performance is slightly favorable but lacks strong economic moat characteristics.
Looking ahead, US Foods could benefit from expansion into new markets and the development of innovative products to leverage its broadline and cash-and-carry network. These opportunities may support continued ROIC growth and help establish a more sustainable competitive position.
SWOT Analysis
This analysis highlights US Foods Holding Corp.’s key internal and external factors shaping its strategic position.
Strengths
- strong revenue growth over 5 years
- improving ROIC trend
- favorable return on equity
Weaknesses
- zero dividend yield
- unfavorable interest coverage
- high debt-to-equity ratio
Opportunities
- expanding foodservice market
- increasing demand for fresh and specialty foods
- potential for operational efficiency gains
Threats
- intense competition in food distribution
- margin pressure from rising costs
- economic sensitivity affecting customers
US Foods shows solid growth and improving profitability but carries leverage and margin risks. Strategic focus should balance expansion with debt management and cost control.
Stock Price Action Analysis
The weekly stock chart for US Foods Holding Corp. illustrates significant price movements and volume patterns over the analyzed periods:
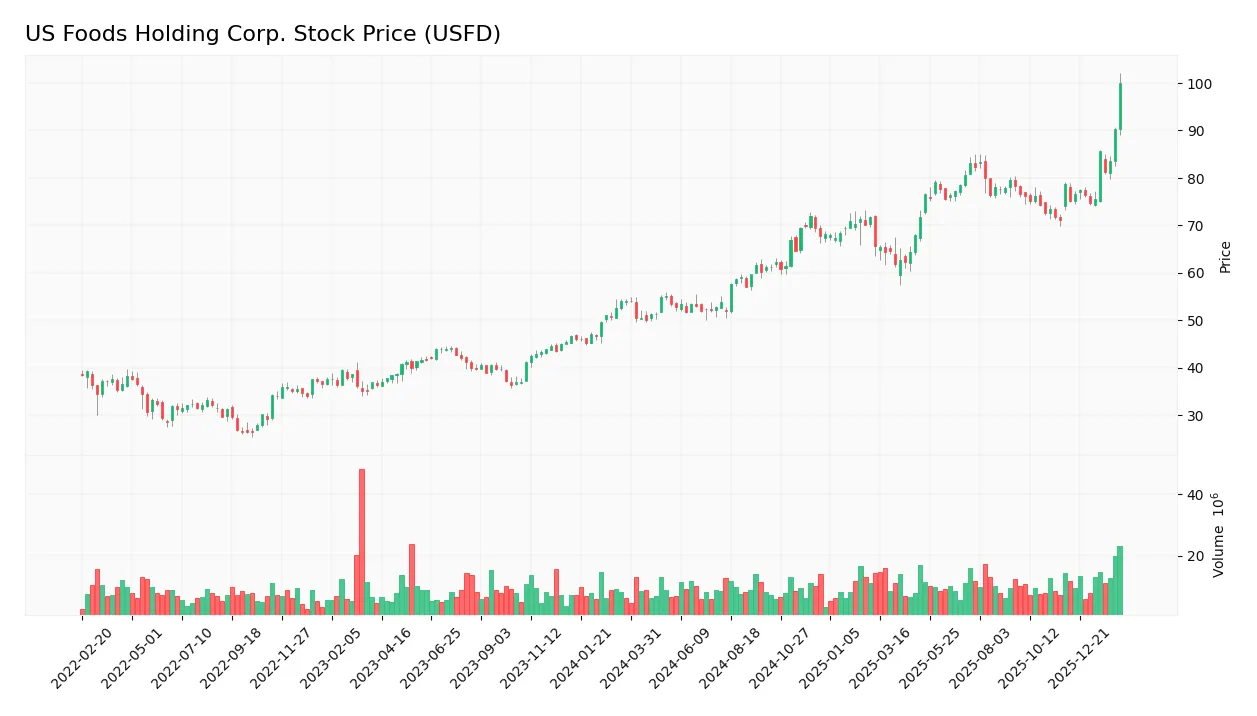
Trend Analysis
Over the past 12 months, USFD’s stock price surged 85.16%, indicating a strong bullish trend with accelerating momentum. The price ranged between 50.04 and 99.93, showing high volatility with a 10.68 standard deviation. Recent three-month gains of 27.02% confirm continued bullish acceleration.
Volume Analysis
Trading volume has increased, driven by buyers accounting for 57.64% overall and 76.86% in the recent period. This strong buyer dominance reflects heightened investor interest and confidence, suggesting robust market participation and upward price pressure.
Target Prices
Analysts set a clear target consensus for US Foods Holding Corp., reflecting moderate upside potential.
| Target Low | Target High | Consensus |
|---|---|---|
| 94 | 117 | 108.33 |
The target range suggests analysts expect USFD to trade between $94 and $117, with a consensus near $108, indicating cautious optimism.

Don’t Let Luck Decide Your Entry Point
Optimize your entry points with our advanced ProRealTime indicators. You’ll get efficient buy signals with precise price targets for maximum performance. Start outperforming now!
Analyst & Consumer Opinions
This section examines analyst ratings and consumer feedback to provide a balanced overview of US Foods Holding Corp.’s market perception.
Stock Grades
Here are the latest verified analyst grades for US Foods Holding Corp. from recognized firms as of early 2026:
| Grading Company | Action | New Grade | Date |
|---|---|---|---|
| Barclays | Maintain | Overweight | 2026-02-13 |
| BTIG | Maintain | Buy | 2026-02-13 |
| Citigroup | Maintain | Buy | 2026-02-13 |
| Guggenheim | Maintain | Buy | 2026-02-13 |
| Piper Sandler | Downgrade | Neutral | 2026-02-13 |
| Wells Fargo | Maintain | Overweight | 2026-02-13 |
| BMO Capital | Maintain | Outperform | 2026-02-13 |
The consensus remains bullish with a majority maintaining Buy or Outperform ratings. Piper Sandler’s downgrade to Neutral marks a rare caution amid broad confidence.
Consumer Opinions
US Foods Holding Corp. sparks mixed reactions among its customers, reflecting both strong service and areas needing improvement.
| Positive Reviews | Negative Reviews |
|---|---|
| Reliable delivery schedules that meet business needs. | Occasional order inaccuracies causing delays. |
| Wide product selection supporting diverse menus. | Customer service response times can be slow. |
| Competitive pricing compared to industry peers. | Packaging sometimes damages fresh produce. |
Overall, consumers praise US Foods for its dependable delivery and broad product range. However, recurring issues with order accuracy and customer support highlight areas for operational refinement.
Risk Analysis
The following table summarizes key risks facing US Foods Holding Corp., rated by likelihood and potential impact:
| Category | Description | Probability | Impact |
|---|---|---|---|
| Financial Leverage | High debt-to-equity ratio (1.21) increases financial risk. | High | High |
| Liquidity | Low quick ratio (0.68) signals potential short-term cash issues. | Medium | Medium |
| Profitability | Low net margin (1.71%) limits buffer against downturns. | High | Medium |
| Valuation | Elevated P/E (25.64) and P/B (4.03) ratios suggest overvaluation. | Medium | Medium |
| Interest Coverage | Interest coverage at 0.0 raises red flags on debt servicing. | High | High |
| Market Volatility | Beta near 1.02 implies stock moves with the market volatility. | Medium | Medium |
I emphasize leverage and interest coverage risks as most acute. Despite a safe Altman Z-score (4.85), the inability to cover interest expenses threatens financial stability if conditions worsen. The firm’s moderate liquidity further constrains flexibility. Recent industry inflation pressures and supply chain disruptions exacerbate margin risk. Investors must weigh these vulnerabilities against USFD’s favorable ROE and asset turnover before committing capital.
Should You Buy US Foods Holding Corp.?
US Foods Holding Corp. appears to be improving profitability with a slightly favorable moat reflecting growing ROIC despite shedding value. Its leverage profile is substantial, tempering operational efficiency. Overall, the company suggests a B rating, indicating a very favorable yet cautious investment profile.
Strength & Efficiency Pillars
US Foods Holding Corp. posts a favorable return on equity of 15.7%, signaling efficient shareholder capital use. Its return on invested capital (ROIC) stands at 8.61%, slightly above its weighted average cost of capital (WACC) of 7.7%, indicating modest value creation. Operational efficiency shows in strong asset turnover ratios—2.83 overall and 14.7 for fixed assets—highlighting effective asset utilization. While net margins remain low at 1.71%, the firm’s growing ROIC trend suggests improving profitability over time.
Weaknesses and Drawbacks
Despite solid fundamentals, valuation metrics raise caution. The price-to-earnings ratio at 25.64 and price-to-book ratio of 4.03 suggest the stock trades at a premium, potentially limiting upside. Leverage is a concern with a debt-to-equity ratio of 1.21, reflecting heavy reliance on debt financing. Liquidity metrics also flag risks: a quick ratio of 0.68 is below the safe threshold, and interest coverage at zero signals vulnerability to rising borrowing costs. These factors warrant careful risk management.
Our Final Verdict about US Foods Holding Corp.
US Foods Holding Corp. presents a fundamentally sound profile with improving profitability and solid operational efficiency. The bullish long-term trend paired with strong recent buyer dominance (76.86%) suggests growing investor confidence. However, premium valuation and elevated leverage may temper near-term enthusiasm. This profile might appear suitable for investors willing to accept moderate risk in exchange for potential long-term gains, but a cautious entry point could be prudent.
Disclaimer: This content is for informational purposes only and does not constitute financial, investment, or other professional advice. Investing in financial markets involves a significant risk of loss, and past performance is not indicative of future results.
Additional Resources
- Longbow Finance SA Increases Stake in US Foods Holding Corp. $USFD – MarketBeat (Feb 13, 2026)
- Barclays Raises Price Target for US Foods Holdings (USFD) to $10 – GuruFocus (Feb 13, 2026)
- US Foods Holding Corp. (NYSE:USFD) Q4 2025 Earnings Call Transcript – Insider Monkey (Feb 13, 2026)
- US Foods sees profit growth despite ‘softer economic environment’ (USFD:NYSE) – Seeking Alpha (Feb 12, 2026)
- Why Are US Foods (USFD) Shares Soaring Today – Finviz (Feb 12, 2026)
For more information about US Foods Holding Corp., please visit the official website: usfoods.com