Home > Analyses > Energy > Uranium Royalty Corp.
Uranium Royalty Corp. quietly powers the future by securing crucial uranium assets that fuel global energy needs. As a pure-play uranium royalty company, it commands a diversified portfolio across key mining projects in North America and Africa, establishing itself as an influential player in the uranium sector. Renowned for its strategic asset management and exposure to a growing clean energy market, the company presents a compelling case. Yet, as market dynamics evolve, the question remains: does Uranium Royalty’s current valuation reflect its potential for sustainable growth and resilience?

Table of contents
Business Model & Company Overview
Uranium Royalty Corp., founded in 2017 and headquartered in Vancouver, Canada, stands as a pure-play uranium royalty company with a focused mission to acquire and manage a diversified portfolio of uranium interests. Its ecosystem spans key uranium projects across North America and Namibia, creating a unique position in the uranium industry by leveraging royalty agreements rather than direct mining operations.
The company’s revenue engine is built on royalties derived from multiple geographically dispersed uranium assets, balancing exposure across Canadian, U.S., and African markets. This model ensures a steady income stream without the capital intensity of mining, emphasizing recurring royalties as its core value driver. Uranium Royalty Corp.’s competitive advantage lies in its strategic asset diversity and low operational risk, which underpin its role in shaping the future of uranium investing.
Financial Performance & Fundamental Metrics
In this section, I analyze Uranium Royalty Corp.’s income statement, key financial ratios, and dividend payout policy to assess its fundamental health.
Income Statement
The table below summarizes Uranium Royalty Corp.’s key income statement figures for the fiscal years 2021 through 2025, reported in CAD.

| 2021 | 2022 | 2023 | 2024 | 2025 | |
|---|---|---|---|---|---|
| Revenue | 0 | 0 | 13.9M | 42.7M | 15.6M |
| Cost of Revenue | 0 | 2K | 12.9M | 29.8M | 14.0M |
| Operating Expenses | 1.47M | 5.49M | 4.68M | 5.87M | 6.36M |
| Gross Profit | 0 | -2K | 0.9M | 12.9M | 1.56M |
| EBITDA | -1.85M | -5.73M | -4.20M | 7.79M | -4.75M |
| EBIT | -1.85M | -5.73M | -4.22M | 7.77M | -4.87M |
| Interest Expense | 0 | 722K | 1.64M | 9K | 436K |
| Net Income | -1.38M | -4.26M | -5.84M | 9.78M | -5.65M |
| EPS | -0.0191 | -0.0482 | -0.0597 | 0.09 | -0.0446 |
| Filing Date | 2021-04-30 | 2022-04-30 | 2023-04-30 | 2024-04-30 | 2025-07-16 |
Income Statement Evolution
From 2021 to 2025, Uranium Royalty Corp.’s revenue showed a volatile pattern, peaking at 42.7M CAD in 2024 before sharply dropping 63.5% to 15.6M CAD in 2025. Net income followed a similar trajectory, swinging from a 9.78M CAD profit in 2024 to a 5.65M CAD loss in 2025. Gross margin remained neutral at roughly 10%, while net and EBIT margins deteriorated significantly, reflecting declining profitability.
Is the Income Statement Favorable?
The 2025 income statement reveals unfavorable fundamentals, with a net loss of 5.65M CAD and a negative net margin of -36.3%. Despite a modestly favorable interest expense ratio of 2.8%, operating income was deeply negative at -4.81M CAD. The significant year-over-year declines across revenue, gross profit, EBIT, and net income confirm a challenging financial environment. Overall, the income statement’s financial health in 2025 is assessed as unfavorable.
Financial Ratios
The following table presents key financial ratios for Uranium Royalty Corp. (ticker: UROY) over the fiscal years 2021 to 2025:
| Ratios | 2021 | 2022 | 2023 | 2024 | 2025 |
|---|---|---|---|---|---|
| Net Margin | 0% | 0% | -42% | 23% | -36% |
| ROE | -1.8% | -2.6% | -3.3% | 3.5% | -1.9% |
| ROIC | -1.4% | -2.0% | -2.0% | 2.6% | -1.6% |
| P/E | -226 | -90 | -43 | 35 | -56 |
| P/B | 4.12 | 2.32 | 1.42 | 1.24 | 1.07 |
| Current Ratio | 99.8 | 276 | 13.4 | 84.0 | 233.5 |
| Quick Ratio | 75.4 | 121.4 | 5.15 | 16.2 | 233.5 |
| D/E | 0.00053 | 0.079 | 0.056 | 0.0007 | 0.0007 |
| Debt-to-Assets | 0.00053 | 0.073 | 0.053 | 0.0007 | 0.0007 |
| Interest Coverage | 0 | -7.6 | -2.3 | 786 | -11 |
| Asset Turnover | 0 | 0 | 0.075 | 0.15 | 0.053 |
| Fixed Asset Turnover | 0 | 0 | 144 | 236 | 83 |
| Dividend Yield | 0 | 0 | 0 | 0 | 0 |
Evolution of Financial Ratios
Over the period, Uranium Royalty Corp.’s Return on Equity (ROE) remained negative, indicating persistent unprofitability with a slight deterioration to -1.92% in 2025. The Current Ratio showed extreme volatility, peaking at 233.49 in 2025, signaling unusual liquidity levels. Meanwhile, the Debt-to-Equity Ratio stayed near zero, reflecting very low leverage and consistent capital structure stability.
Are the Financial Ratios Favorable?
In 2025, profitability ratios such as net margin (-36.26%) and ROE (-1.92%) were unfavorable, highlighting ongoing losses. Liquidity showed mixed signals: the current ratio was excessively high and deemed unfavorable, while the quick ratio was favorable. Leverage ratios were generally positive, with minimal debt and a low debt-to-assets ratio of 0.07%. Efficiency indicators like asset turnover were low and unfavorable, but fixed asset turnover was high and favorable. Overall, 57.14% of key ratios were unfavorable, leading to a generally unfavorable financial ratios assessment.
Shareholder Return Policy
Uranium Royalty Corp. (UROY) does not pay dividends, reflecting its consistent net losses and negative operating cash flows in recent years. The company appears to prioritize reinvestment and growth, with no share buyback programs reported.
This policy aligns with a high-growth or early-stage strategy focused on long-term shareholder value creation rather than immediate income distribution. The absence of dividends and buybacks supports capital preservation amid ongoing operating challenges, indicating a cautious approach toward sustainable value.
Score analysis
The following radar chart illustrates the key financial scores evaluating Uranium Royalty Corp.’s valuation and profitability metrics:
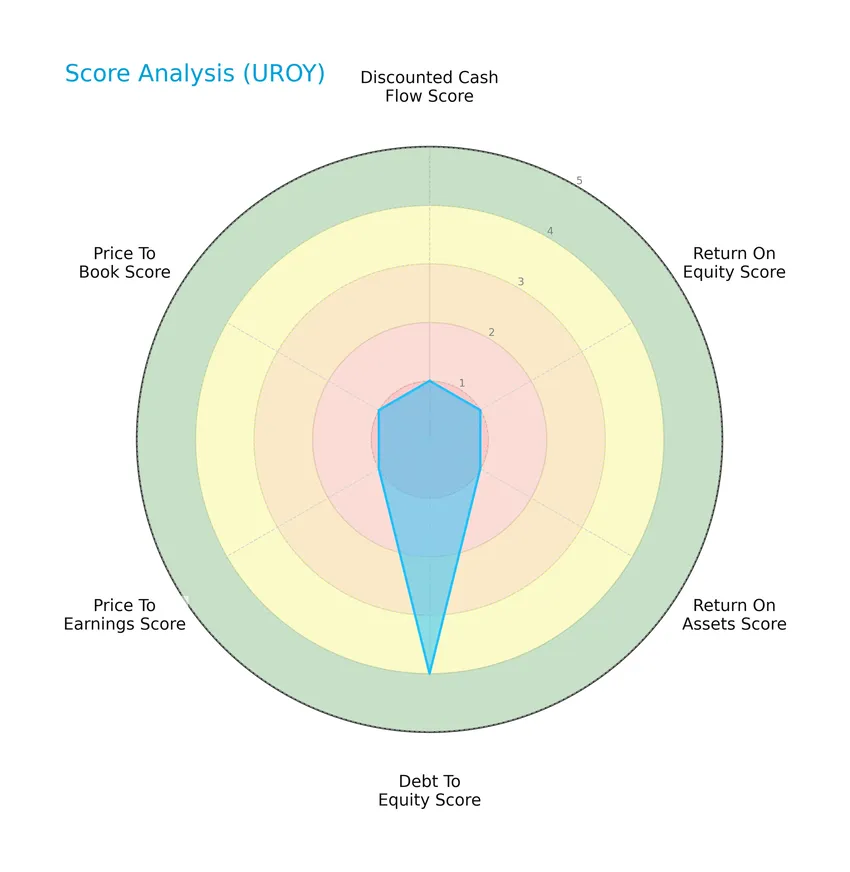
The company exhibits very unfavorable scores in discounted cash flow, return on equity, return on assets, price to earnings, and price to book ratios, all scoring 1. Its debt-to-equity score stands out as favorable at 4, indicating a stronger position in managing leverage compared to other metrics.
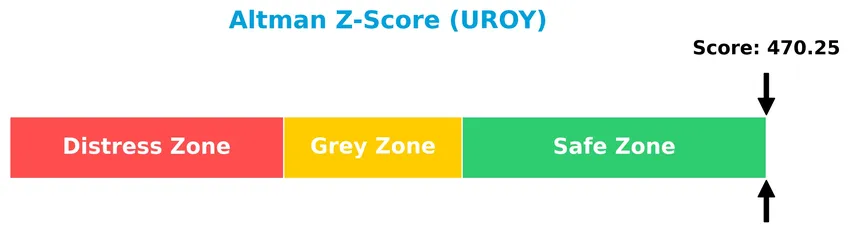
Analysis of the company’s bankruptcy risk
Uranium Royalty Corp. is currently positioned well within the safe zone according to the Altman Z-Score, suggesting a very low risk of bankruptcy:
Is the company in good financial health?
The Piotroski Score diagram below helps assess Uranium Royalty Corp.’s financial health status based on key accounting signals:

With a Piotroski Score of 3, the company is considered very weak in financial health, reflecting limited strength in profitability, leverage, liquidity, and operational efficiency criteria.
Competitive Landscape & Sector Positioning
This sector analysis will explore Uranium Royalty Corp.’s strategic positioning, revenue streams, key products, main competitors, and overall market environment. I will also examine whether the company holds any competitive advantage compared to its peers. This overview will include a SWOT analysis to provide a balanced view of opportunities and risks.
Strategic Positioning
Uranium Royalty Corp. focuses on a concentrated product portfolio in uranium, managing geographically diversified royalty interests across multiple projects in Canada, the U.S., and Namibia. This strategy provides exposure to varied mining sites while maintaining a pure-play focus within the uranium sector.
Key Products & Brands
The following table outlines the key uranium royalty interests managed by Uranium Royalty Corp.:
| Product | Description |
|---|---|
| McArthur River Project | A uranium royalty interest located in Saskatchewan, Canada, part of the company’s geographically diversified portfolio. |
| Cigar Lake / Waterbury Lake | Royalty interests in these uranium projects situated in Saskatchewan, Canada. |
| Roughrider Project | A uranium project in Saskatchewan, Canada, included in Uranium Royalty Corp.’s portfolio. |
| Russell Lake & Russell Lake South | Uranium royalty interests in two adjacent projects in Saskatchewan, Canada. |
| Dawn Lake Project | Another Saskatchewan-based uranium royalty asset held by the company. |
| Anderson and Workman Creek Projects | Uranium royalty interests in Arizona, USA. |
| Lance and Reno Creek Projects | Uranium projects located in Wyoming, USA, part of the royalty portfolio. |
| Church Rock and Roca Honda Projects | Royalty interests in New Mexico, USA. |
| Dewey-Burdock Project | A uranium project in South Dakota, USA, included in the company’s holdings. |
| Slick Rock Project | Uranium royalty asset situated in Colorado, USA. |
| Langer Heinrich Project | A uranium royalty interest located in Namibia. |
| Michelin Project | A uranium royalty asset in Newfoundland and Labrador, Canada. |
Uranium Royalty Corp. focuses on acquiring and managing royalty interests in a geographically diverse range of uranium projects across North America and Namibia, positioning itself as a pure-play uranium royalty company.
Main Competitors
The uranium sector includes 10 main competitors, with the table below listing the top 10 leaders by market capitalization:
| Competitor | Market Cap. |
|---|---|
| Cameco Corporation | 39.8B |
| NexGen Energy Ltd. | 6.0B |
| Uranium Energy Corp. | 5.6B |
| Centrus Energy Corp. | 4.2B |
| Energy Fuels Inc. | 3.5B |
| Denison Mines Corp. | 2.4B |
| Ur-Energy Inc. | 507M |
| IsoEnergy Ltd. | 499M |
| Uranium Royalty Corp. | 471M |
| enCore Energy Corp. | 464M |
Uranium Royalty Corp. ranks 9th among its peers, with a market cap at 1.58% of the top leader, Cameco Corporation. It sits below both the average market cap of the top 10, which is 6.35B, and the sector median of 2.92B. The company’s market cap is about 21% lower than its nearest competitor above, IsoEnergy Ltd., highlighting a moderate gap in scale.
Does UROY have a competitive advantage?
Uranium Royalty Corp. does not currently present a competitive advantage, as its return on invested capital (ROIC) is significantly below its weighted average cost of capital (WACC), indicating value destruction and declining profitability. The company’s financial performance from 2021 to 2025 shows unfavorable trends with negative margins and declining net income.
Looking ahead, Uranium Royalty Corp. manages a geographically diversified portfolio of uranium royalty interests across Canada, the US, and Namibia, offering potential exposure to various projects. Future opportunities may arise from new uranium market dynamics and exploration results within its royalty portfolio, though current financials reflect operational and profitability challenges.
Comparisons with competitors
Check out how we compare the company to its competitors:
SWOT Analysis
This SWOT analysis highlights Uranium Royalty Corp.’s key internal and external factors to guide investment decisions.
Strengths
- Pure-play uranium royalty model
- Diversified geographic asset base
- Low debt levels with favorable debt-to-assets ratio
Weaknesses
- Negative net margin and EBIT margin
- Sharp revenue and profit declines
- Very weak Piotroski score indicating financial weakness
Opportunities
- Rising global demand for clean energy fuels
- Potential uranium price recovery
- Expansion into new uranium projects and royalties
Threats
- Volatile uranium market prices
- Regulatory and environmental risks
- High beta indicating stock price volatility
Overall, Uranium Royalty Corp. benefits from a focused asset portfolio and low leverage but faces significant profitability challenges and financial weakness. Strategic focus should be on improving operational efficiency and capitalizing on uranium market recovery while managing high market risks.
Stock Price Action Analysis
The weekly stock chart below illustrates Uranium Royalty Corp.’s price movements and trends over the past 12 months:
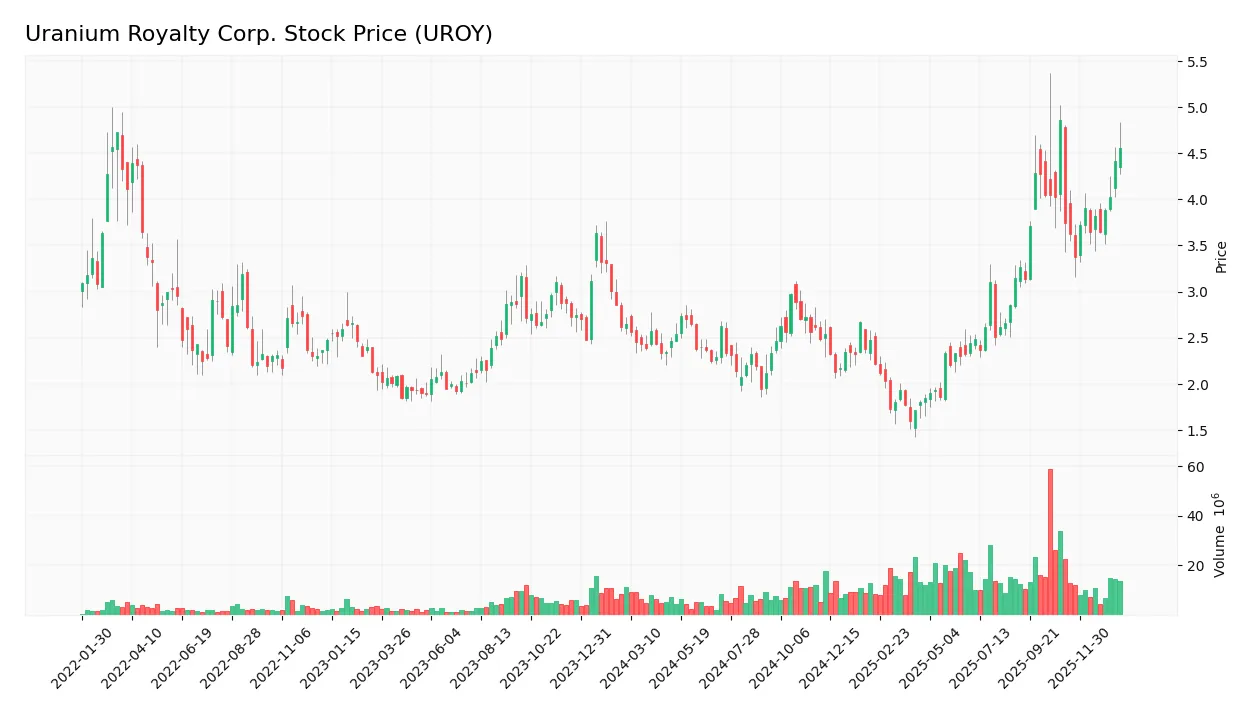
Trend Analysis
Over the past 12 months, UROY’s stock price increased by 72.08%, indicating a bullish trend with price acceleration. The highest price reached 4.86 and the lowest was 1.6, while volatility measured by a 0.71 standard deviation suggests moderate fluctuations during this strong upward momentum.
Volume Analysis
Trading volume has been increasing, with buyers accounting for 53.26% of total activity historically and rising to 57.16% recently, indicating a slightly buyer-dominant market over the last three months. This suggests growing investor interest and participation, reflecting confidence in the stock’s continued upward trajectory.
Target Prices
No verified target price data is available from recognized analysts for Uranium Royalty Corp. Market sentiment remains cautious due to sector volatility and evolving uranium demand dynamics.
Analyst & Consumer Opinions
This section reviews analyst ratings and consumer feedback to provide a balanced perspective on Uranium Royalty Corp. (UROY).

Don’t Let Luck Decide Your Entry Point
Optimize your entry points with our advanced ProRealTime indicators. You’ll get efficient buy signals with precise price targets for maximum performance. Start outperforming now!
Stock Grades
Here is a summary of recent stock grades assigned to Uranium Royalty Corp. by a recognized grading company:
| Grading Company | Action | New Grade | Date |
|---|---|---|---|
| HC Wainwright & Co. | Maintain | Buy | 2025-04-22 |
| HC Wainwright & Co. | Maintain | Buy | 2024-12-19 |
| HC Wainwright & Co. | Maintain | Buy | 2024-09-17 |
| HC Wainwright & Co. | Maintain | Buy | 2024-06-17 |
| HC Wainwright & Co. | Maintain | Buy | 2024-03-11 |
| HC Wainwright & Co. | Maintain | Buy | 2022-01-03 |
| HC Wainwright & Co. | Maintain | Buy | 2021-09-29 |
| HC Wainwright & Co. | Maintain | Buy | 2021-09-28 |
| HC Wainwright & Co. | Maintain | Buy | 2021-07-02 |
| HC Wainwright & Co. | Maintain | Buy | 2021-07-01 |
The consistent “Buy” ratings from HC Wainwright & Co. over several years reflect a stable positive outlook on Uranium Royalty Corp., with no recent changes in recommendation. Overall, the consensus among analysts remains firmly positive.
Consumer Opinions
Consumer sentiment around Uranium Royalty Corp. (UROY) reflects a mix of appreciation for its niche market position and concerns about sector volatility.
| Positive Reviews | Negative Reviews |
|---|---|
| “Strong focus on uranium royalties, a unique investment angle.” | “High dependency on uranium market cycles creates risk.” |
| “Good dividend potential with steady royalty income streams.” | “Limited diversification increases vulnerability.” |
| “Management seems transparent and committed to shareholder value.” | “Stock price can be highly volatile with commodity swings.” |
Overall, consumers appreciate Uranium Royalty Corp.’s clear niche in uranium royalties and its dividend prospects, but they remain cautious about the inherent risks tied to uranium price fluctuations and limited diversification.
Risk Analysis
The following table summarizes the key risks associated with Uranium Royalty Corp. (UROY) investment as of 2026:
| Category | Description | Probability | Impact |
|---|---|---|---|
| Financial Health | Negative net margin (-36.26%) and unfavorable ROE and ROIC indicate ongoing profitability issues. | High | High |
| Market Volatility | High beta (2.034) suggests significant stock price volatility relative to the market. | High | Medium |
| Liquidity Risk | Extremely high current ratio (233.49) may signal inefficient asset use, despite strong quick ratio. | Medium | Medium |
| Debt Management | Low debt-to-equity (0.0) and debt-to-assets (0.07%) reflect minimal leverage risk. | Low | Low |
| Dividend Policy | No dividend yield, potentially limiting income-focused investors’ appeal. | Medium | Low |
| Operational Risk | Exposure to uranium market fluctuations and geopolitical risks due to diversified global projects. | Medium | High |
| Financial Distress | Piotroski score of 3 (very weak) warns of financial weakness despite Altman Z-Score indicating safety. | Medium | High |
The most likely and impactful risks for UROY stem from its weak profitability and operational exposure to volatile uranium markets. Despite being in the Altman Z-Score safe zone, the very weak Piotroski score and unfavorable profitability ratios highlight caution. Investors should weigh potential volatility and operational challenges carefully when considering UROY.
Should You Buy Uranium Royalty Corp.?
Uranium Royalty Corp. could be seen as facing significant challenges with declining profitability and a very unfavorable competitive moat, while its leverage profile appears manageable. Despite a strong Altman Z-Score, the overall rating suggests a cautious analytical interpretation with a C- grade.
Strength & Efficiency Pillars
Uranium Royalty Corp. presents a mixed financial profile, with certain strengths in its financial health metrics. The company boasts an Altman Z-score of 470.25, placing it securely in the safe zone, which signals very low bankruptcy risk. Its debt-to-equity ratio of 0.0 and debt-to-assets at 7% indicate a conservative leverage position, supporting financial stability. Additionally, a favorable Piotroski score of 3, though weak, suggests moderate operational resilience. However, profitability metrics such as ROE at -1.92% and ROIC at -1.63% are negative, with ROIC well below WACC at 13.49%, confirming that the company is currently destroying value rather than creating it.
Weaknesses and Drawbacks
The company faces substantial challenges in profitability and growth, with a net margin of -36.26% and EBIT margin of -31.24%, both deeply unfavorable. Revenue and earnings have sharply declined, with a 63.48% drop in revenue over the past year and a 310.75% fall in net income over the overall period, highlighting persistent operational difficulties. While valuation metrics such as a negative P/E of -56.0 and P/B of 1.07 might appear favorable, they reflect underlying losses and market skepticism. Furthermore, the extremely high current ratio of 233.49 suggests possible inefficiencies in working capital management, and an interest coverage ratio of -11.17 points to insufficient earnings to cover interest expenses.
Our Verdict about Uranium Royalty Corp.
The long-term fundamental profile appears unfavorable due to ongoing value destruction and weak profitability. Despite this, the stock exhibits a bullish overall trend with a 72.08% price increase and recent buyer dominance at 57.16%, suggesting some market optimism. Given this contrast, Uranium Royalty Corp. may appear to offer speculative upside but could warrant a cautious, wait-and-see approach pending improvements in core financial performance and value creation metrics.
Disclaimer: This content is for informational purposes only and does not constitute financial, investment, or other professional advice. Investing in financial markets involves a significant risk of loss, and past performance is not indicative of future results.
Additional Resources
- Nuclear Education Dashboard • Uranium Royalty Corp (UROY) – CarbonCredits.com (Jan 19, 2026)
- Uranium Royalty Corp. (UROY) Renews Its At-the-Market (ATM) Equity Program – Yahoo Finance (Sep 12, 2025)
- Raymond James Remains a Hold on Uranium Royalty Corp (UROY) – The Globe and Mail (Jan 15, 2026)
- Uranium Royalty (NASDAQ:UROY) Stock Price Up 10.3% – Here’s Why – MarketBeat (Jan 02, 2026)
- Uranium Royalty: Ideal In Theory, Fragile In Practice (NASDAQ:UROY) – Seeking Alpha (Jun 17, 2025)
For more information about Uranium Royalty Corp., please visit the official website: uraniumroyalty.com