Home > Analyses > Energy > Uranium Energy Corp.
Uranium Energy Corp. powers the future of clean energy by advancing uranium exploration and production across North and South America. With a diverse portfolio of mines and projects in Texas, Arizona, Wyoming, Canada, and Paraguay, UEC stands out for its strategic resource base and operational expertise in the uranium sector. Known for innovation and disciplined growth, the company is well-positioned in a market where nuclear energy demand is resurging. The key question now: does UEC’s current valuation reflect its long-term growth potential in this evolving energy landscape?

Table of contents
Business Model & Company Overview
Uranium Energy Corp., founded in 2003 and headquartered in Corpus Christi, Texas, stands as a significant player in the uranium industry. The company operates a cohesive ecosystem spanning exploration, pre-extraction, extraction, and processing of uranium and titanium concentrates. Its portfolio includes key projects across the United States, Canada, and Paraguay, reflecting a robust commitment to resource development and energy supply.
The company’s revenue engine is driven by its diversified asset base, balancing mining operations with processing capabilities, enabling steady value creation. Uranium Energy Corp.’s strategic presence in the Americas and select international markets underpins its growth potential. Its strong foothold in critical mineral resources cements a durable economic moat, positioning it to influence the future dynamics of the global uranium sector.
Financial Performance & Fundamental Metrics
In this section, I analyze Uranium Energy Corp.’s income statement, key financial ratios, and dividend payout policy to assess its investment potential.
Income Statement
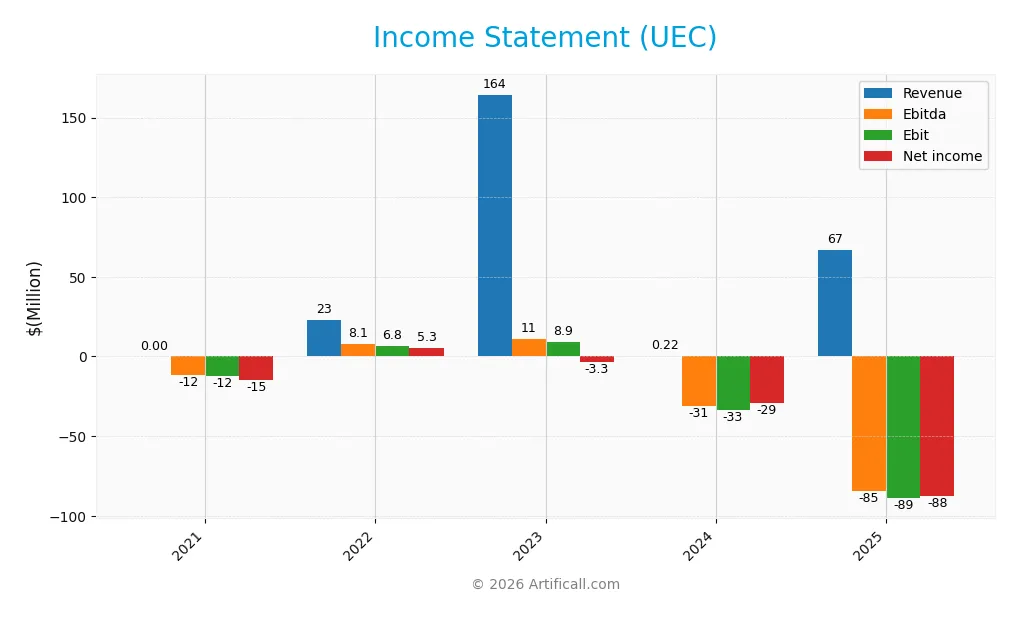
The table below summarizes Uranium Energy Corp.’s key income statement figures over the last five fiscal years, reflecting its financial performance and profit metrics in USD.
| 2021 | 2022 | 2023 | 2024 | 2025 | |
|---|---|---|---|---|---|
| Revenue | 0 | 23.2M | 164.4M | 224K | 66.8M |
| Cost of Revenue | 4.48M | 15.9M | 133.3M | 187K | 42.4M |
| Operating Expenses | 13.0M | 26.6M | 22.1M | 56.4M | 97.8M |
| Gross Profit | -4.48M | 7.29M | 31.1M | 37K | 24.5M |
| EBITDA | -11.5M | 8.15M | 10.9M | -31.2M | -84.5M |
| EBIT | -11.9M | 6.77M | 8.87M | -33.4M | -88.9M |
| Interest Expense | 2.88M | 1.52M | 805K | 827K | 1.45M |
| Net Income | -14.8M | 5.25M | -3.31M | -29.2M | -87.7M |
| EPS | -0.0704 | 0.0194 | -0.0091 | -0.0735 | -0.20 |
| Filing Date | 2021-10-28 | 2023-04-03 | 2024-04-02 | 2024-09-27 | 2025-09-24 |
Income Statement Evolution
From 2021 to 2025, Uranium Energy Corp.’s revenue showed significant volatility, peaking sharply in 2023 at 164M before drastically declining to 67M in 2025. Net income deteriorated overall, moving from a loss of 14.8M in 2021 to a larger loss of 87.7M in 2025, reflecting worsening profitability. Gross margin improved to a favorable 36.62% in 2025, but EBIT and net margins remained deeply negative, indicating persistent operational losses.
Is the Income Statement Favorable?
The 2025 income statement reveals unfavorable fundamentals despite a strong gross margin of 36.62% and a favorable interest expense ratio of 2.16%. Operating expenses and other costs overwhelmed revenue, resulting in an EBIT margin of -133.14% and a net margin of -131.15%. While revenue and gross profit grew significantly year-over-year, net income and EPS declined sharply, suggesting ongoing challenges in controlling costs and achieving profitability. Overall, the income statement presents an unfavorable financial position.
Financial Ratios
The table below presents key financial ratios for Uranium Energy Corp. (UEC) over the fiscal years 2021 to 2025:
| Ratios | 2021 | 2022 | 2023 | 2024 | 2025 |
|---|---|---|---|---|---|
| Net Margin | 0% | 23% | -2% | -130% | -131% |
| ROE | -10% | 2% | -1% | -4% | -9% |
| ROIC | -11% | -6% | 1% | -6% | -7% |
| P/E | -31 | 209 | -397 | -81 | -42 |
| P/B | 3.01 | 3.36 | 2.08 | 3.03 | 3.77 |
| Current Ratio | 5.66 | 12.03 | 4.53 | 8.05 | 8.85 |
| Quick Ratio | 3.46 | 4.19 | 4.02 | 5.46 | 5.85 |
| D/E | 0.07 | 0.004 | 0.002 | 0.003 | 0.002 |
| Debt-to-Assets | 6% | 0.3% | 0.2% | 0.3% | 0.2% |
| Interest Coverage | -6.1 | -13 | 11 | -68 | -51 |
| Asset Turnover | 0 | 0.07 | 0.22 | 0.0003 | 0.06 |
| Fixed Asset Turnover | 0 | 0.11 | 0.28 | 0.0004 | 0.09 |
| Dividend Yield | 0% | 0% | 0% | 0% | 0% |
Evolution of Financial Ratios
Over the period, Uranium Energy Corp.’s Return on Equity (ROE) has consistently been negative, reflecting declining profitability and losses. The Current Ratio showed an overall increase, reaching 8.85 in 2025, indicating strong short-term liquidity. Meanwhile, the Debt-to-Equity Ratio remained very low and stable near zero, signaling minimal leverage. Profitability margins deteriorated sharply after 2023, with gross profit margins fluctuating and net profit margins deepening into negative territory.
Are the Financial Ratios Favorable?
In 2025, the company’s profitability ratios, including net margin (-131.15%) and ROE (-8.91%), were unfavorable, highlighting sustained losses. Liquidity measures were mixed: the Current Ratio was high but deemed unfavorable, whereas the Quick Ratio was favorable at 5.85. Leverage ratios such as Debt-to-Equity (0.0) and Debt-to-Assets (0.21%) were favorable, indicating low debt levels. Efficiency ratios, including asset turnover (0.06) and fixed asset turnover (0.09), were unfavorable. Market valuation metrics showed a favorable price-to-earnings ratio (-42.3) but an unfavorable price-to-book ratio (3.77). Overall, 64% of key ratios were unfavorable, leading to a generally unfavorable financial profile.
Shareholder Return Policy
Uranium Energy Corp. (UEC) does not pay dividends, reflecting its consistent net losses and negative profit margins in recent years. The company focuses on reinvestment and growth, with no dividend payout or yield reported, indicating prioritization of capital allocation toward operations rather than direct shareholder returns.
No share buyback programs are noted, consistent with its financial position and high cash ratios but negative free cash flow per share. This approach aligns with sustaining long-term shareholder value by preserving capital during loss-making phases rather than distributing cash, supporting a cautious financial strategy.
Score analysis
The following radar chart presents a comprehensive view of Uranium Energy Corp.’s key financial scores:
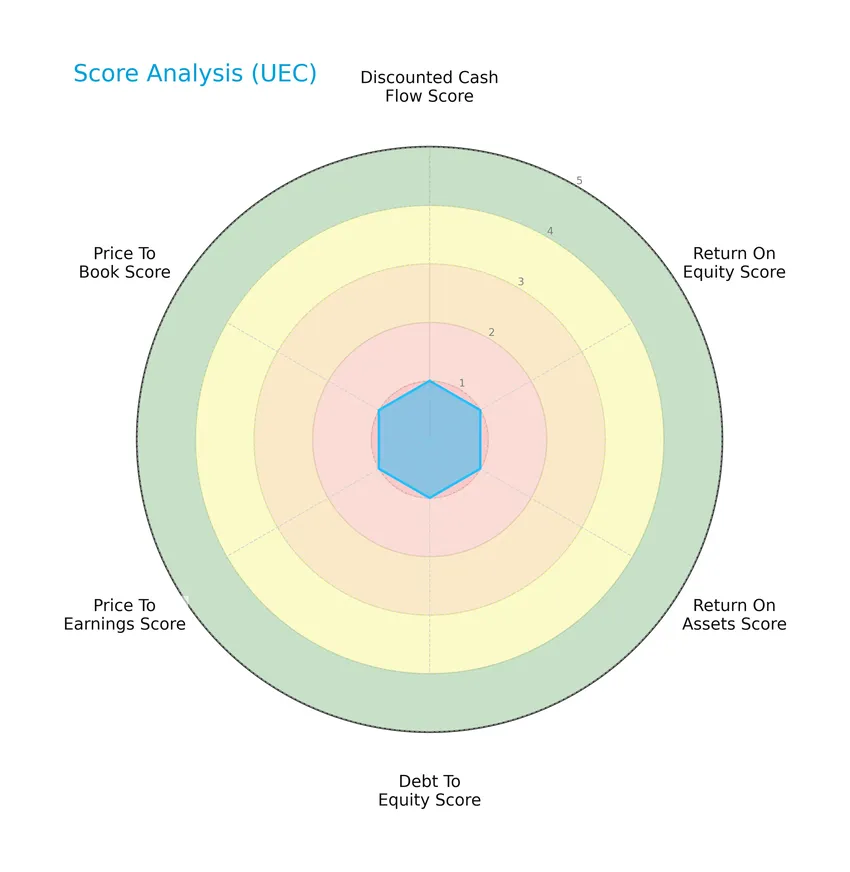
The company scores very low across all metrics, including discounted cash flow, return on equity, return on assets, debt to equity, price to earnings, and price to book, indicating a broadly unfavorable financial profile.
Analysis of the company’s bankruptcy risk
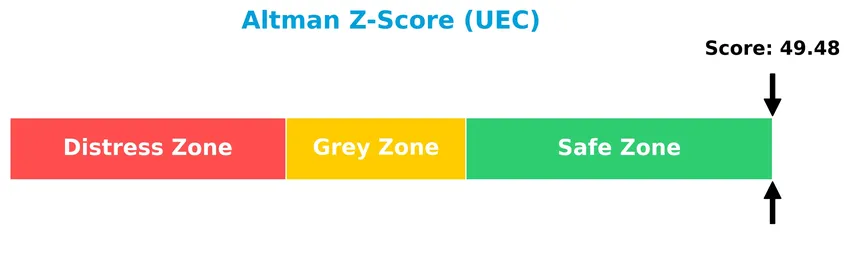
Uranium Energy Corp. exhibits a very high Altman Z-Score, placing it firmly in the safe zone for bankruptcy risk:
Is the company in good financial health?
The Piotroski diagram below illustrates the company’s financial health based on its Piotroski Score:

With a Piotroski Score of 2, Uranium Energy Corp. is classified as very weak financially, suggesting limited strength in profitability, leverage, liquidity, and operational efficiency.
Competitive Landscape & Sector Positioning
This sector analysis will examine Uranium Energy Corp.’s strategic positioning, revenue by segment, key products, main competitors, competitive advantages, and SWOT analysis. I will assess whether the company holds a competitive advantage over its peers in the uranium energy industry.
Strategic Positioning
Uranium Energy Corp. focuses on uranium and titanium extraction, operating primarily in the US, Canada, and Paraguay, with projects concentrated in key mining states. Its revenue is heavily reliant on inventory sales, showing limited diversification in product lines or geographic markets.
Revenue by Segment
This pie chart illustrates Uranium Energy Corp.’s revenue distribution by segment for the fiscal year 2025, highlighting the company’s sales and service income streams.
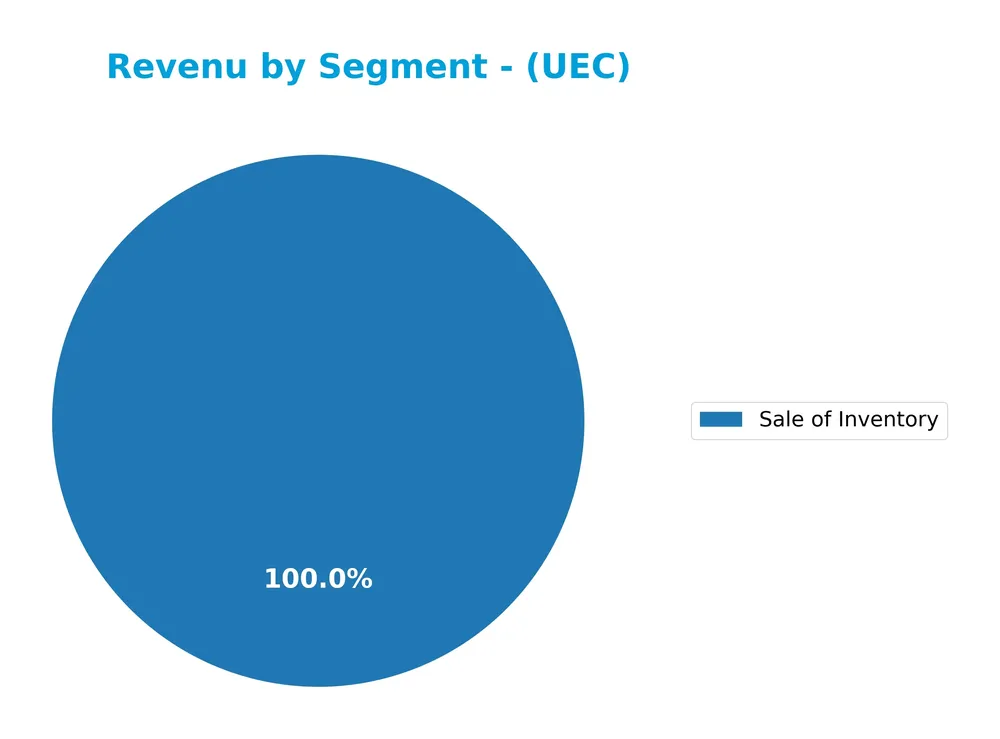
The data reveals that “Sale of Inventory” dominates Uranium Energy Corp.’s revenue, contributing $66.8M in 2025 after a complete absence of sales in 2024. Toll Processing Services remain a minor segment, showing very small revenue figures in prior years but none reported in 2025. The sharp rebound in inventory sales signals a significant business acceleration, although reliance on a single segment may pose concentration risks going forward.
Key Products & Brands
The table below outlines Uranium Energy Corp.’s principal products and services offered to the market:
| Product | Description |
|---|---|
| Sale of Inventory | Sales of uranium and titanium concentrates extracted and processed from various mining projects. |
| Toll Processing Services | Contractual processing of uranium and titanium concentrates for third parties. |
Uranium Energy Corp. primarily generates revenue through the sale of uranium and titanium inventory from its mining projects, supplemented by toll processing services for external clients.
Main Competitors
There are 10 competitors in the uranium sector; below are the top 10 leaders by market capitalization:
| Competitor | Market Cap. |
|---|---|
| Cameco Corporation | 39.8B |
| NexGen Energy Ltd. | 6.0B |
| Uranium Energy Corp. | 5.6B |
| Centrus Energy Corp. | 4.2B |
| Energy Fuels Inc. | 3.5B |
| Denison Mines Corp. | 2.4B |
| Ur-Energy Inc. | 507M |
| IsoEnergy Ltd. | 499M |
| Uranium Royalty Corp. | 471M |
| enCore Energy Corp. | 464M |
Uranium Energy Corp. ranks 3rd among its uranium peers, holding 22.6% of the top player’s market cap. It stands above both the average market cap of the top 10 competitors (6.35B) and the sector median (2.92B). The company maintains a significant 33.09% market cap gap with NexGen Energy Ltd. above it.
Comparisons with competitors
Check out how we compare the company to its competitors:
Does UEC have a competitive advantage?
Uranium Energy Corp. currently does not present a clear competitive advantage as it is shedding value with a negative ROIC compared to its WACC, indicating inefficiency in capital use despite a growing ROIC trend. The company’s income statement shows unfavorable EBIT and net margins, reinforcing its challenges in delivering consistent profitability.
Looking ahead, UEC’s operations span multiple uranium and titanium projects across the US, Canada, and Paraguay, suggesting potential growth opportunities through resource development and market expansion. Continued improvement in profitability metrics could support a more favorable competitive position if operational efficiencies and market conditions improve.
SWOT Analysis
This SWOT analysis highlights Uranium Energy Corp.’s key internal and external factors to support informed investment decisions.
Strengths
- Large market cap at 9B USD
- Diverse uranium and titanium projects across multiple US states and Paraguay
- Strong liquidity ratios with quick ratio 5.85 and zero debt
Weaknesses
- Negative net margin of -131%
- Unfavorable ROE and ROIC indicating value destruction
- Very weak Piotroski score of 2 signaling poor financial health
Opportunities
- Growing uranium demand due to energy transition
- Increasing ROIC trend suggesting improving profitability
- Potential expansion in US and international mining projects
Threats
- Volatile uranium prices impacting revenues
- Regulatory and environmental risks in mining
- Intense competition and geopolitical uncertainties
Uranium Energy Corp. shows solid asset diversification and liquidity but struggles with profitability and financial strength. Its strategy should focus on improving operational efficiency and capitalizing on rising uranium demand while carefully managing market and regulatory risks.
Stock Price Action Analysis
The weekly stock chart for Uranium Energy Corp. (UEC) over the past 100 weeks reveals significant price movement and volatility:
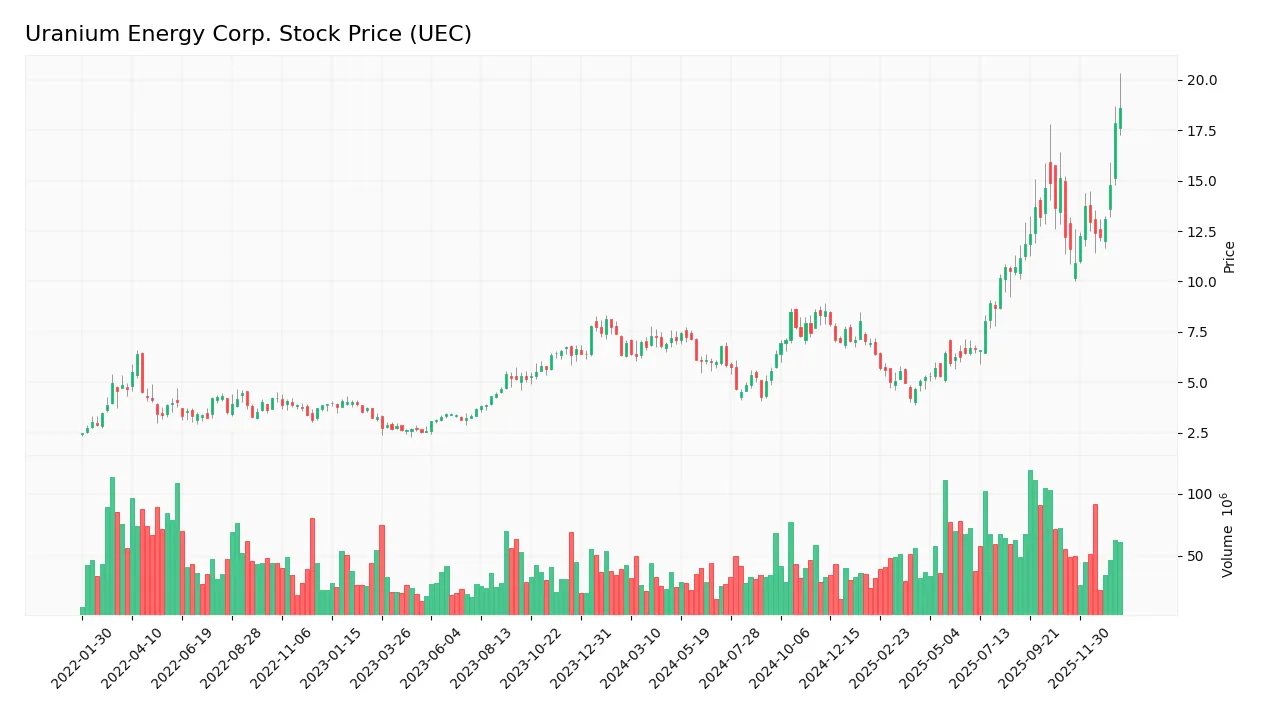
Trend Analysis
Over the past 12 months, UEC’s stock price increased by 168.3%, indicating a strong bullish trend with clear acceleration. The price ranged from a low of 4.22 to a high of 18.62, with a volatility measure (standard deviation) of 3.16, confirming notable price fluctuations during this period.
Volume Analysis
In the last three months, trading volume shows a slight seller dominance with buyers accounting for 46.32%. Volume activity is increasing overall, though recent buyer participation has decreased, suggesting cautious investor sentiment amid rising market engagement.
Target Prices
The current analyst consensus for Uranium Energy Corp. (UEC) indicates a moderately optimistic outlook.
| Target High | Target Low | Consensus |
|---|---|---|
| 19.75 | 14 | 17.08 |
Analysts expect UEC’s stock price to trade between $14 and $19.75, with a consensus target of around $17.08, reflecting positive growth potential while acknowledging market risks.

Don’t Let Luck Decide Your Entry Point
Optimize your entry points with our advanced ProRealTime indicators. You’ll get efficient buy signals with precise price targets for maximum performance. Start outperforming now!
Analyst & Consumer Opinions
This section reviews recent analyst ratings and consumer feedback related to Uranium Energy Corp. (UEC).
Stock Grades
Here is a summary of the most recent verified analyst grades for Uranium Energy Corp. from recognized financial institutions:
| Grading Company | Action | New Grade | Date |
|---|---|---|---|
| Roth Capital | Maintain | Buy | 2025-12-11 |
| Goldman Sachs | Maintain | Buy | 2025-09-26 |
| Roth Capital | Maintain | Buy | 2025-09-25 |
| HC Wainwright & Co. | Maintain | Buy | 2025-09-25 |
| BMO Capital | Downgrade | Market Perform | 2025-09-25 |
| Roth Capital | Maintain | Buy | 2025-09-03 |
| HC Wainwright & Co. | Maintain | Buy | 2025-08-06 |
| HC Wainwright & Co. | Maintain | Buy | 2025-03-13 |
| HC Wainwright & Co. | Maintain | Buy | 2024-12-09 |
| Roth MKM | Maintain | Buy | 2024-10-23 |
The consensus among major analysts remains predominantly positive with six buy ratings and one hold, reflecting a stable outlook for Uranium Energy Corp. The only notable change was BMO Capital’s downgrade from Outperform to Market Perform.
Consumer Opinions
Uranium Energy Corp. (UEC) has sparked diverse reactions from its consumer base, reflecting a mix of optimism and concern about its future prospects.
| Positive Reviews | Negative Reviews |
|---|---|
| Strong potential in the uranium market growth. | Volatility in stock price causing investor anxiety. |
| Commitment to sustainable uranium mining methods. | Delays in project developments reported. |
| Transparent communication and regular updates. | Limited dividend payouts affecting income investors. |
| Experienced management team with clear vision. | Exposure to regulatory risks in the energy sector. |
Overall, consumers appreciate UEC’s focus on sustainable practices and market potential but express caution over stock volatility and project delays, indicating the need for careful risk management when investing.
Risk Analysis
Below is a summary table outlining the key risks facing Uranium Energy Corp. to consider before investing:
| Category | Description | Probability | Impact |
|---|---|---|---|
| Financial Health | Continued negative net margin (-131.15%) and weak profitability metrics | High | High |
| Market Volatility | Stock price fluctuates widely between $3.85 and $20.34; recent -6.24% drop | High | Medium |
| Operational Risks | Exposure to geopolitical and regulatory changes in uranium mining regions | Medium | High |
| Liquidity Risks | High current ratio (8.85) but unfavorable interest coverage (-61.54) | Medium | Medium |
| Credit Risk | Low debt-to-equity ratio (0.0) reduces credit risk but weak returns | Low | Medium |
The most concerning risks for Uranium Energy Corp. are its sustained financial losses and volatile market price. While the Altman Z-Score indicates a safe zone, the very weak Piotroski score and negative profitability ratios highlight ongoing operational and financial challenges that investors should monitor carefully.
Should You Buy Uranium Energy Corp.?
Uranium Energy Corp. appears to be navigating a challenging profitability environment with negative returns despite improving operational efficiency, while its competitive moat seems slightly unfavorable due to value destruction. Supported by a manageable leverage profile but very weak overall rating (D+), the analytical interpretation suggests caution for value creation potential.
Strength & Efficiency Pillars
Uranium Energy Corp. exhibits a resilient financial foundation as evidenced by an Altman Z-Score of 49.48, placing it securely in the safe zone and signaling low bankruptcy risk. The company benefits from a robust quick ratio of 5.85 and zero debt-to-equity, indicating strong liquidity and conservative leverage. Although its ROIC stands at -6.57% against a WACC of 9.69%, marking a value destruction scenario, the improving ROIC trend suggests emerging operational efficiencies. The Piotroski score of 2 denotes financial weakness, tempering the otherwise solid financial health signals.
Weaknesses and Drawbacks
The investment case is clouded by significant profitability and valuation concerns. Uranium Energy Corp.’s net margin is deeply negative at -131.15%, alongside an unfavorable EBIT margin of -133.14%, reflecting persistent operational losses. Its price-to-book ratio sits at 3.77, suggesting a premium valuation despite weak fundamentals. The current ratio is elevated at 8.85, which, while indicating liquidity, may imply inefficient asset utilization. Additionally, recent seller dominance at 53.68% volume share introduces near-term market pressure, potentially constraining upside momentum.
Our Verdict about Uranium Energy Corp.
The fundamental profile of Uranium Energy Corp. appears unfavorable due to persistent profitability deficits and value destruction despite a solid balance sheet. However, the stock’s overall bullish trend with 168.3% price appreciation and recent acceleration suggests positive investor sentiment. Despite this long-term strength, the slight seller dominance in the recent period suggests a cautious, wait-and-see approach may be prudent for investors seeking a more favorable entry point.
Disclaimer: This content is for informational purposes only and does not constitute financial, investment, or other professional advice. Investing in financial markets involves a significant risk of loss, and past performance is not indicative of future results.
Additional Resources
- Uranium Energy Positioned At Center Of U.S. Fuel Chain Reset – simplywall.st (Jan 24, 2026)
- Uranium Energy (UEC) Is Up 13.7% After U.S. Nuclear Fuel Policy Tailwinds Intensify Supply Focus – Sahm (Jan 24, 2026)
- Uranium Energy (UEC) Stock Sinks As Market Gains: What You Should Know – Yahoo Finance (Jan 23, 2026)
- Uranium bull market accelerates 📈 Stock euphoria returns as Uranium Energy Corp jumps 35% – XTB.com (Jan 20, 2026)
- Uranium Energy (NYSEAMERICAN:UEC) Reaches New 12-Month High – Here’s What Happened – MarketBeat (Jan 21, 2026)
For more information about Uranium Energy Corp., please visit the official website: uraniumenergy.com