Home > Analyses > Energy > Ur-Energy Inc.
Ur-Energy Inc. powers the future by mining uranium critical for clean energy and national security. It commands a strong position in the uranium industry with its Lost Creek project, spanning 48,000 acres in Wyoming. Known for operational focus and strategic asset control, Ur-Energy blends innovation with resource stewardship. As the uranium market evolves, I question whether Ur-Energy’s fundamentals justify its current valuation and growth prospects.

Table of contents
Business Model & Company Overview
Ur-Energy Inc., founded in 2004 and headquartered in Littleton, Colorado, commands a competitive position in the uranium industry. It operates a cohesive ecosystem centered on the exploration, development, and operation of uranium mineral properties. Its flagship Lost Creek project spans 48,000 acres in Wyoming’s Great Divide Basin, underpinning its status as a key player in domestic uranium production.
The company’s revenue engine balances project development with resource extraction across 12 U.S. sites, leveraging long-term mineral leases to secure supply. While primarily focused on physical uranium assets, Ur-Energy strategically serves global energy markets. Its economic moat lies in extensive land holdings and operational expertise, shaping the future of uranium supply amid evolving energy demands.
Financial Performance & Fundamental Metrics
I analyze Ur-Energy Inc.’s income statement, key financial ratios, and dividend payout policy to assess its core financial health and shareholder returns.
Income Statement
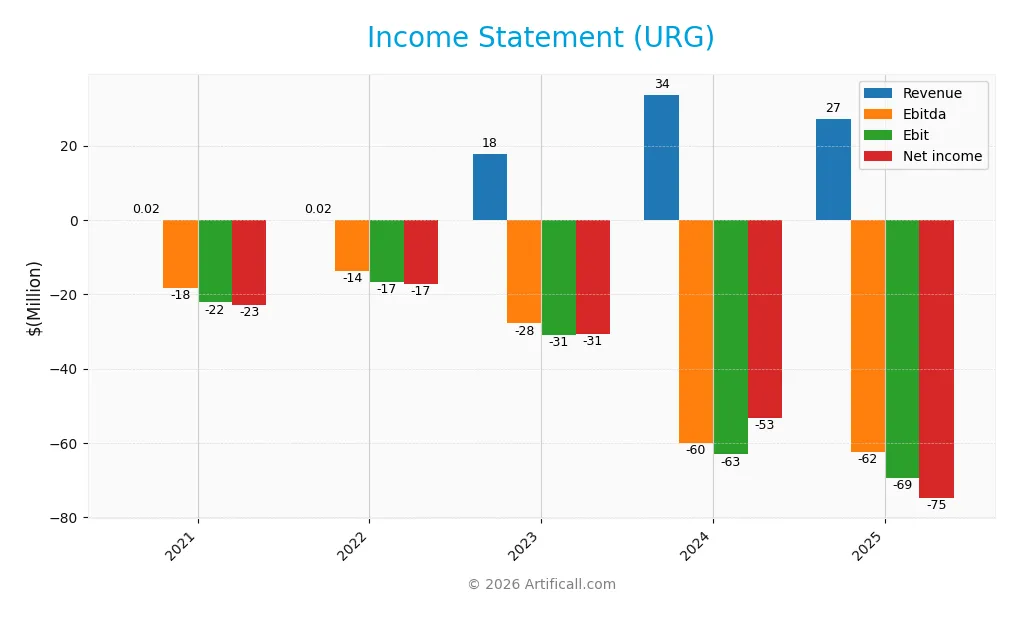
The table below summarizes Ur-Energy Inc.’s key income statement figures for fiscal years 2021 through 2025, reflecting persistent operational challenges and negative earnings.
| 2021 | 2022 | 2023 | 2024 | 2025 | |
|---|---|---|---|---|---|
| Revenue | 16K | 19K | 17.7M | 33.7M | 27.2M |
| Cost of Revenue | 7M | 6.9M | 19.4M | 42.7M | 87.7M |
| Operating Expenses | 9.8M | 12.9M | 29.2M | 54.1M | 8.9M |
| Gross Profit | -6.98M | -6.84M | -1.69M | -8.97M | -60.5M |
| EBITDA | -18.4M | -13.7M | -27.9M | -59.9M | -62.3M |
| EBIT | -22.2M | -16.7M | -30.8M | -63.1M | -69.4M |
| Interest Expense | 733K | 463K | 0 | 0 | 1.95M |
| Net Income | -22.9M | -17.1M | -30.7M | -53.2M | -74.9M |
| EPS | -0.12 | -0.08 | -0.12 | -0.17 | -0.20 |
| Filing Date | 2022-09-21 | 2023-03-06 | 2024-03-12 | 2025-04-11 | 2026-03-10 |
Income Statement Evolution
Between 2021 and 2025, Ur-Energy’s revenue surged dramatically from negligible levels to $27.2M in 2025 but dropped 19% year-over-year from 2024 to 2025. Net income remained negative throughout, deepening to -$75M in 2025. Margins worsened, with a gross margin of -222% and net margin of -275%, reflecting persistent operational challenges and cost inefficiencies.
Is the Income Statement Favorable?
In 2025, the fundamentals appear unfavorable. Despite a revenue base of $27.2M, the company reported a gross loss of $60.5M and an operating loss of $69.4M. Interest expense is moderate at 7.2% of revenue but fails to offset heavy operating losses. Negative EPS of -$0.20 and deteriorating net income reinforce ongoing profitability struggles, signaling significant financial risk.
Financial Ratios
The table below summarizes key financial ratios for Ur-Energy Inc. over the past five fiscal years:
| Ratios | 2021 | 2022 | 2023 | 2024 | 2025 |
|---|---|---|---|---|---|
| Net Margin | -1433.63% | -902.11% | -173.40% | -1.58% | -2.75% |
| ROE | -33.06% | -27.42% | -40.95% | -40.05% | -96.70% |
| ROIC | -14.46% | -18.56% | -24.83% | -36.01% | -28.29% |
| P/E | -10.41 | -14.79 | -13.06 | -6.87 | -6.84 |
| P/B | 3.44 | 4.06 | 5.35 | 2.75 | 6.61 |
| Current Ratio | 7.81 | 6.66 | 6.35 | 5.99 | 5.44 |
| Quick Ratio | 7.81 | 5.16 | 6.09 | 4.91 | 4.56 |
| D/E | 0.18 | 0.18 | 0.09 | 0.01 | 0.88 |
| Debt-to-Assets | 10.21% | 10.27% | 5.10% | 0.64% | 25.04% |
| Interest Coverage | -22.86 | -42.75 | 0 | 0 | -35.63 |
| Asset Turnover | 0.00 | 0.00 | 0.14 | 0.17 | 0.10 |
| Fixed Asset Turnover | 0.00 | 0.00 | 0.32 | 0.00 | 0.29 |
| Dividend Yield | 0 | 0 | 0 | 0 | 0 |
Evolution of Financial Ratios
Ur-Energy’s Return on Equity (ROE) has declined sharply, reaching -96.7% in 2025, signaling worsening profitability. The Current Ratio remained high but decreased slightly to 5.44, indicating strong liquidity with minor erosion. The Debt-to-Equity Ratio rose to 0.88, showing increased leverage but staying within a manageable range. Overall, profitability deteriorated significantly.
Are the Financial Ratios Favorable?
The 2025 ratios reveal mixed signals. Profitability metrics like net margin and ROE are deeply unfavorable, reflecting persistent losses. Liquidity remains strong, supported by a quick ratio of 4.56, which is favorable. Leverage is neutral with a debt-to-equity ratio of 0.88 and a favorable debt-to-assets ratio at 25%. Efficiency ratios such as asset turnover are weak. Market valuation ratios indicate overvaluation risks. Overall, the ratios lean unfavorable.
Shareholder Return Policy
Ur-Energy Inc. does not pay dividends, reflecting its negative net income and ongoing reinvestment strategy. The company maintains no dividend payout and zero dividend yield, prioritizing capital allocation toward operational and development needs rather than shareholder distributions. Share buybacks are not reported.
This approach aligns with a high-growth or turnaround phase but carries risks of continued losses and cash burn. Without distributions or buybacks, the policy supports long-term value creation only if operational improvements materialize and financial stability improves.
Score analysis
The radar chart below visualizes Ur-Energy Inc.’s key financial scores, highlighting multiple areas of concern:
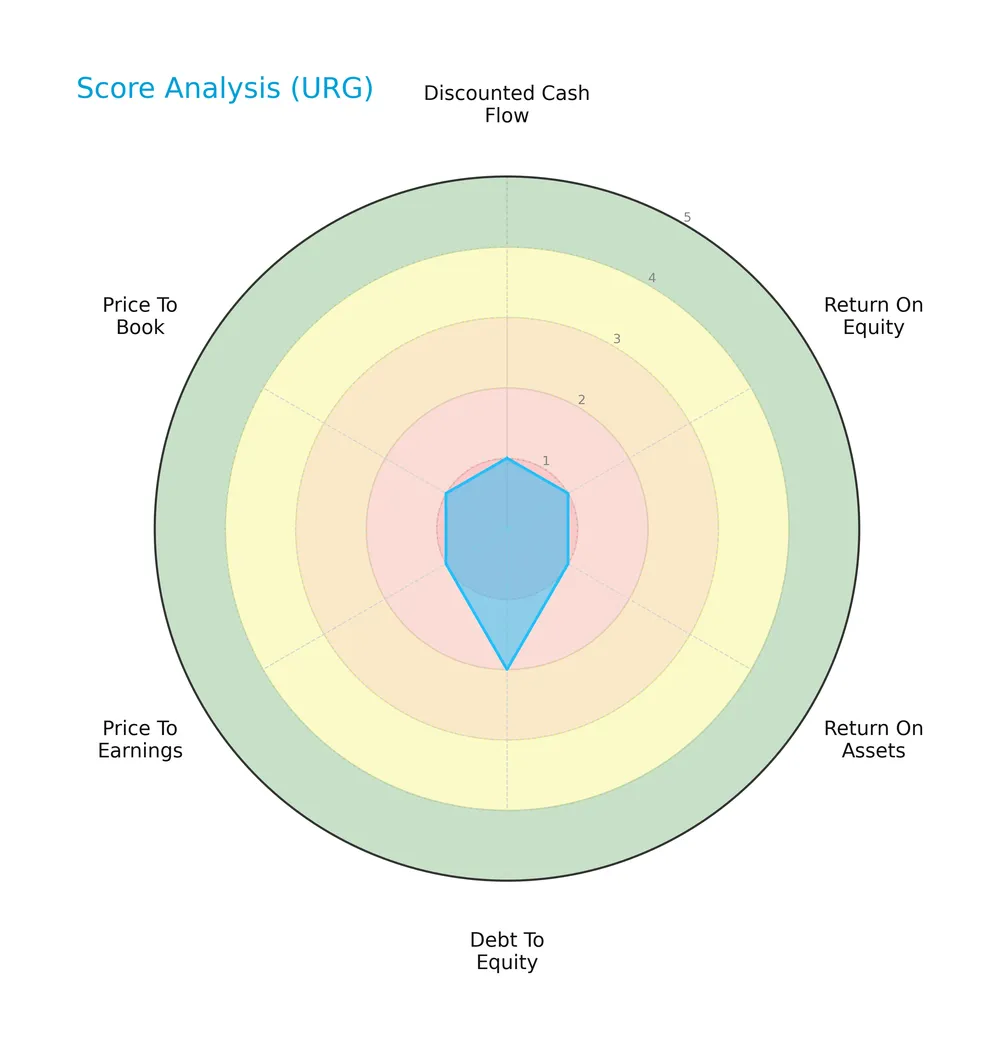
Ur-Energy Inc. scores very unfavorably across discounted cash flow, return on equity, return on assets, price-to-earnings, and price-to-book metrics. Its debt-to-equity score is slightly better but still unfavorable, indicating weak financial fundamentals overall.
Analysis of the company’s bankruptcy risk
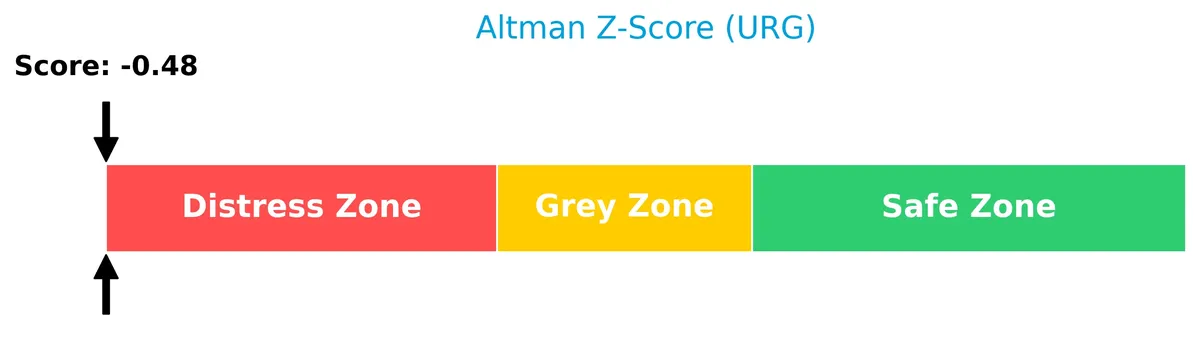
Ur-Energy Inc.’s Altman Z-Score places it deeply in the distress zone, signaling a high risk of bankruptcy:
Is the company in good financial health?
The Piotroski Score chart illustrates Ur-Energy Inc.’s very weak financial health status:
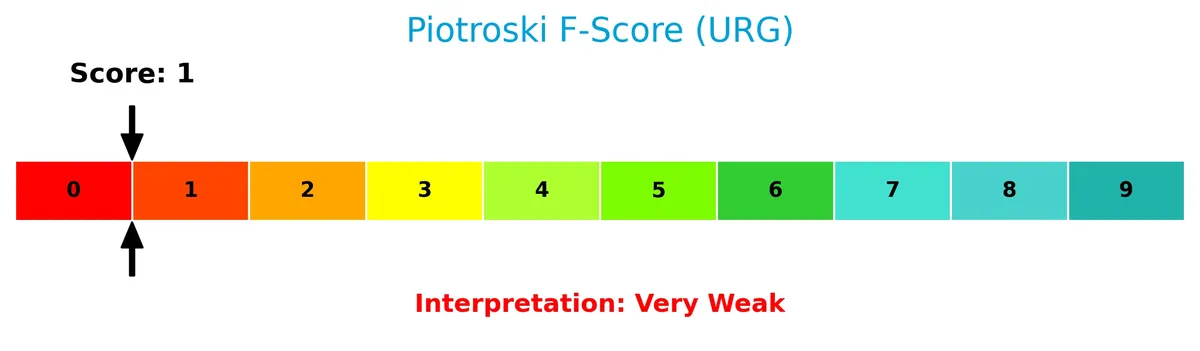
With a Piotroski Score of 1, the company demonstrates poor profitability, weak liquidity, and inefficient capital structure, signaling significant financial weakness.
Competitive Landscape & Sector Positioning
This analysis reviews Ur-Energy Inc.’s strategic positioning within the uranium sector, focusing on key products and revenue segments. I will evaluate whether Ur-Energy holds a competitive advantage over its main competitors.
Strategic Positioning
Ur-Energy Inc. concentrates its uranium operations within the United States, holding interests in 12 projects, primarily the Lost Creek site in Wyoming. The company maintains a focused geographic and product portfolio strategy in uranium mining, with no evident diversification beyond this sector or region.
Key Products & Brands
The following table outlines Ur-Energy Inc.’s primary products and key property assets:
| Product | Description |
|---|---|
| Uranium Mineral Properties | Acquisition, exploration, development, and operation of uranium mineral properties across 12 US projects. |
| Lost Creek Project | Flagship property with ~1,800 unpatented mining claims and 3 Wyoming mineral leases covering 48,000 acres in the Great Divide Basin. |
Ur-Energy’s core business centers on uranium mining, with a significant focus on the Lost Creek project, a substantial asset in Wyoming’s uranium sector.
Main Competitors
There are 10 main competitors in the Uranium industry, with the table below listing the top 10 leaders by market capitalization:
| Competitor | Market Cap. |
|---|---|
| Cameco Corporation | 39.8B |
| NexGen Energy Ltd. | 6.0B |
| Uranium Energy Corp. | 5.6B |
| Centrus Energy Corp. | 4.2B |
| Energy Fuels Inc. | 3.5B |
| Denison Mines Corp. | 2.4B |
| Ur-Energy Inc. | 507M |
| IsoEnergy Ltd. | 499M |
| Uranium Royalty Corp. | 471M |
| enCore Energy Corp. | 464M |
Ur-Energy Inc. ranks 7th among its top 10 competitors. Its market cap represents just 1.42% of the leader, Cameco Corporation. The company sits below both the average market cap of 6.35B for the top 10 and the sector median of 2.92B. It has a significant 323% gap to the next largest competitor above, indicating a sizable scale difference within the peer group.
Does Ur-Energy Inc. have a competitive advantage?
Ur-Energy Inc. currently lacks a competitive advantage, as it is destroying value with a sharply declining ROIC well below its WACC. This indicates inefficient capital use and diminishing profitability in its uranium operations.
Looking ahead, the company holds 12 uranium projects across the U.S., including the flagship Lost Creek site in Wyoming. These assets may offer growth opportunities if market conditions improve or new technologies enhance extraction efficiency.
Comparisons with competitors
Check out how we compare the company to its competitors:
SWOT Analysis
This SWOT analysis highlights Ur-Energy Inc.’s key factors influencing its current position and future prospects.
Strengths
- extensive uranium project portfolio
- flagship Lost Creek asset in Wyoming
- strong current ratio (5.44)
Weaknesses
- severe negative profitability metrics
- declining ROIC far below WACC
- very weak financial health scores (Altman Z-score, Piotroski)
Opportunities
- rising uranium demand amid energy transition
- potential government support for nuclear energy
- exploration upside in Great Divide Basin
Threats
- volatile uranium prices
- high operational losses and cash burn
- regulatory and environmental risks
Ur-Energy’s strengths lie in its strategic asset base but are overshadowed by persistent losses and deteriorating profitability. The company must optimize capital allocation and operational efficiency to capitalize on uranium market tailwinds while mitigating financial distress risks.
Stock Price Action Analysis
The weekly stock chart below illustrates Ur-Energy Inc.’s price fluctuations and overall momentum during the recent period:
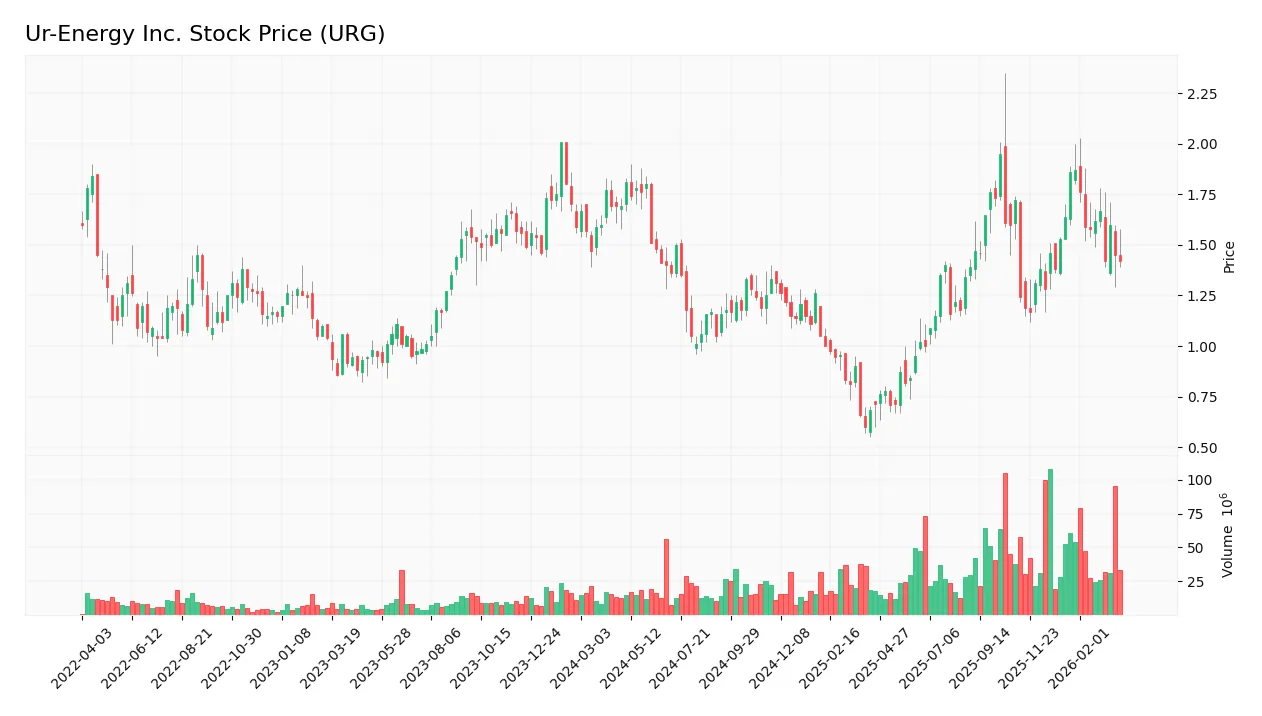
Trend Analysis
Over the past 12 months, URG’s stock price declined by 21.55%, signaling a bearish trend. The price fell from a high of 1.95 to a low of 0.6, with volatility measured by a 0.31 standard deviation. The downward momentum shows deceleration, indicating a slowing rate of decline.
Volume Analysis
Trading volume for URG is increasing overall, with total volume at 3.32B shares. Sellers dominate slightly, comprising 52% over the full period and 56% in the recent three months. This seller-driven activity suggests cautious investor sentiment and moderate market participation.
Target Prices
Analysts project a modest upside for Ur-Energy Inc., reflecting cautious optimism.
| Target Low | Target High | Consensus |
|---|---|---|
| 2.15 | 2.30 | 2.22 |
The target range suggests moderate growth potential, with the consensus price indicating a slight premium over current levels.
Analyst & Consumer Opinions
This section examines Ur-Energy Inc.’s analyst ratings alongside consumer feedback to provide a comprehensive sentiment overview.

Don’t Let Luck Decide Your Entry Point
Optimize your entry points with our advanced ProRealTime indicators. You’ll get efficient buy signals with precise price targets for maximum performance. Start outperforming now!
Stock Grades
Here is a concise summary of recent verified stock grades for Ur-Energy Inc. from recognized analysts:
| Grading Company | Action | New Grade | Date |
|---|---|---|---|
| HC Wainwright & Co. | Maintain | Buy | 2026-03-12 |
| HC Wainwright & Co. | Maintain | Buy | 2025-11-04 |
| B. Riley Securities | Maintain | Buy | 2025-09-25 |
| Roth Capital | Maintain | Buy | 2025-09-23 |
| HC Wainwright & Co. | Maintain | Buy | 2025-04-15 |
| HC Wainwright & Co. | Maintain | Buy | 2025-02-11 |
| Roth MKM | Maintain | Buy | 2024-10-23 |
| B. Riley Securities | Maintain | Buy | 2024-08-20 |
| HC Wainwright & Co. | Maintain | Buy | 2024-08-14 |
| HC Wainwright & Co. | Maintain | Buy | 2024-07-17 |
All recent grades for Ur-Energy Inc. remain consistently positive, with unanimous “Buy” ratings and no downgrades. This steady endorsement reflects strong confidence from leading equity analysts.
Consumer Opinions
Consumer sentiment around Ur-Energy Inc. reveals a mix of appreciation for its environmental focus and concerns over operational challenges.
| Positive Reviews | Negative Reviews |
|---|---|
| Commended for strong commitment to sustainable uranium mining. | Reports of occasional delays in project timelines. |
| Praised for transparent communication and investor updates. | Some dissatisfaction with fluctuating production output. |
| Appreciated for innovative approaches to reduce environmental impact. | Concerns about stock volatility impacting investor confidence. |
Overall, consumers admire Ur-Energy’s green initiatives and transparency. However, operational inconsistencies and stock volatility remain key concerns that could impact long-term confidence.
Risk Analysis
The following table highlights key risks facing Ur-Energy Inc., assessing their likelihood and potential impact:
| Category | Description | Probability | Impact |
|---|---|---|---|
| Financial Health | Negative net margin (-275%), negative ROE (-97%), and distress zone Altman Z-Score indicate severe financial distress. | High | High |
| Operational | Low asset turnover (0.1) and fixed asset turnover (0.29) suggest inefficiency in utilizing assets. | Medium | Medium |
| Market Volatility | Uranium price fluctuations and sector cyclicality could impact revenues and valuation. | High | High |
| Liquidity & Solvency | While current ratio is strong (5.44), negative interest coverage (-35.63) signals difficulty servicing debt obligations. | Medium | High |
| Valuation | High price-to-book ratio (6.61) combined with unfavorable price-to-earnings ratio may deter value-focused investors. | Medium | Medium |
The most pressing risks are Ur-Energy’s financial distress and sensitivity to uranium market cycles. The Altman Z-Score in the distress zone and the very weak Piotroski score reinforce bankruptcy concerns. Investors should weigh these risks carefully against potential uranium sector recoveries.
Should You Buy Ur-Energy Inc.?
Ur-Energy Inc. appears to be in financial distress with deteriorating profitability and a very unfavorable moat due to persistent value destruction. Despite a manageable leverage profile, its overall rating of D+ suggests significant operational and financial challenges remain.
Strength & Efficiency Pillars
Ur-Energy Inc. shows deeply negative profitability metrics with a net margin of -275.29% and return on equity of -96.7%. Its return on invested capital (ROIC) stands at -28.29%, well below its weighted average cost of capital (WACC) at 7.4%, signaling value destruction rather than creation. These figures underline operational inefficiencies and a lack of capital discipline. Historically, companies in the mining sector with such negative returns often struggle to generate sustainable shareholder value.
Weaknesses and Drawbacks
The company is in financial distress, confirmed by an Altman Z-Score of -0.48, placing it squarely in the “Distress Zone” and signaling a high bankruptcy risk. Its price-to-book ratio is elevated at 6.61, indicating an expensive valuation relative to net assets. The current ratio of 5.44 appears healthy superficially but may reflect inefficient asset management given the weak profitability. Negative interest coverage (-35.63) highlights challenges servicing debt. Seller dominance at 55.77% further pressures the stock short-term.
Our Final Verdict about Ur-Energy Inc.
Despite any operational efforts, Ur-Energy’s solvency risk makes it a highly speculative investment. The company’s distressed financial health and value-destroying returns point to elevated risks that could outweigh potential rewards. Investors should approach with extreme caution, as the profile is too risky for conservative capital and may only suit traders with a high risk tolerance.
Disclaimer: This content is for informational purposes only and does not constitute financial, investment, or other professional advice. Investing in financial markets involves a significant risk of loss, and past performance is not indicative of future results.
Additional Resources
- Why Ur-Energy’s higher 2026 spending hasn’t derailed Wall Street’s broader view – MSN (Mar 27, 2026)
- H.C. Wainwright Lowers its Price Target on Ur-Energy Inc. (URG) to $2.30 from $2.60 – Yahoo Finance (Mar 24, 2026)
- Ur-Energy Reports Higher 2025 Uranium Production – Let’s Data Science (Mar 24, 2026)
- Ur Energy: Q4 Earnings Snapshot – WHAS11 (Mar 10, 2026)
- Ur Energy (URG) Expected to Announce Quarterly Earnings on Wednesday – MarketBeat (Mar 04, 2026)
For more information about Ur-Energy Inc., please visit the official website: ur-energy.com